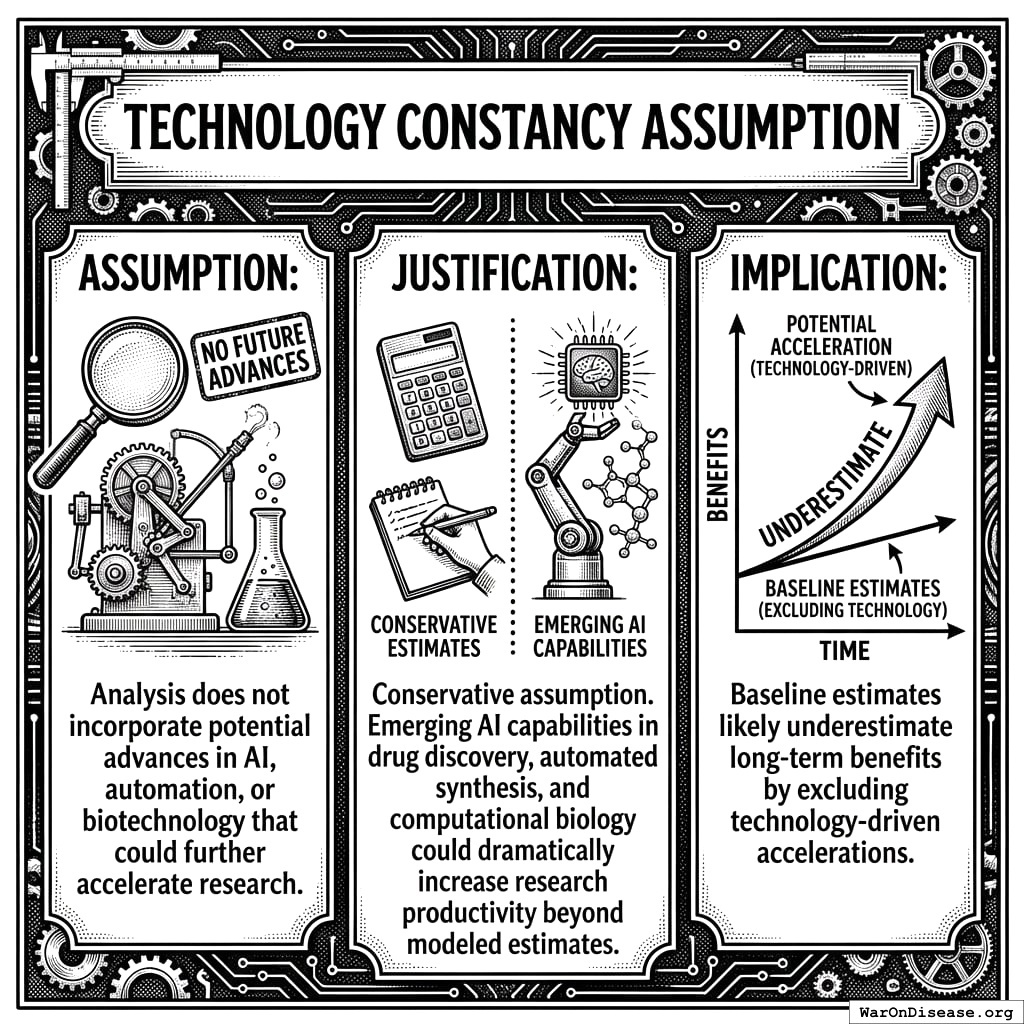
Opening requested calculation...
Please wait, this takes like 47 seconds. Thank you for your patience! :)
☠
0 humans have been terminated by curable diseases since this page started loading
Abstract
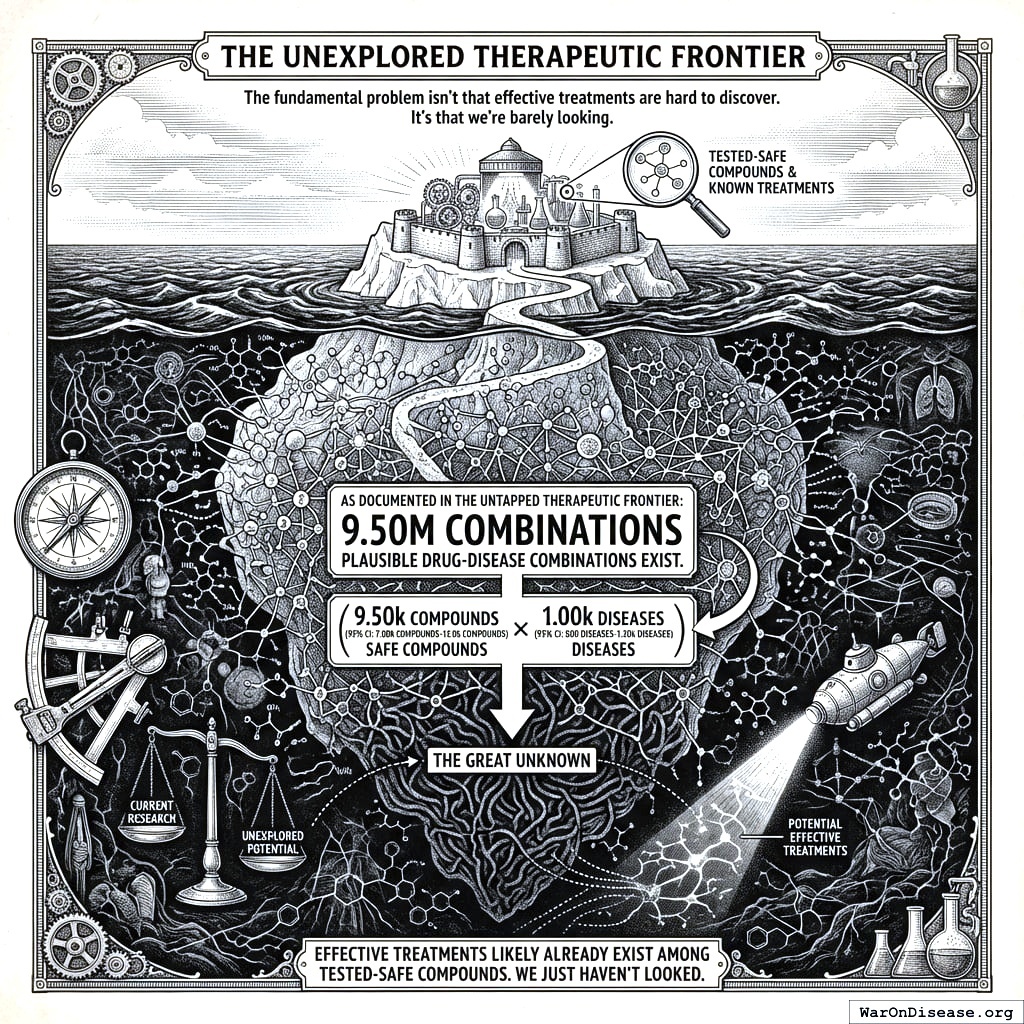
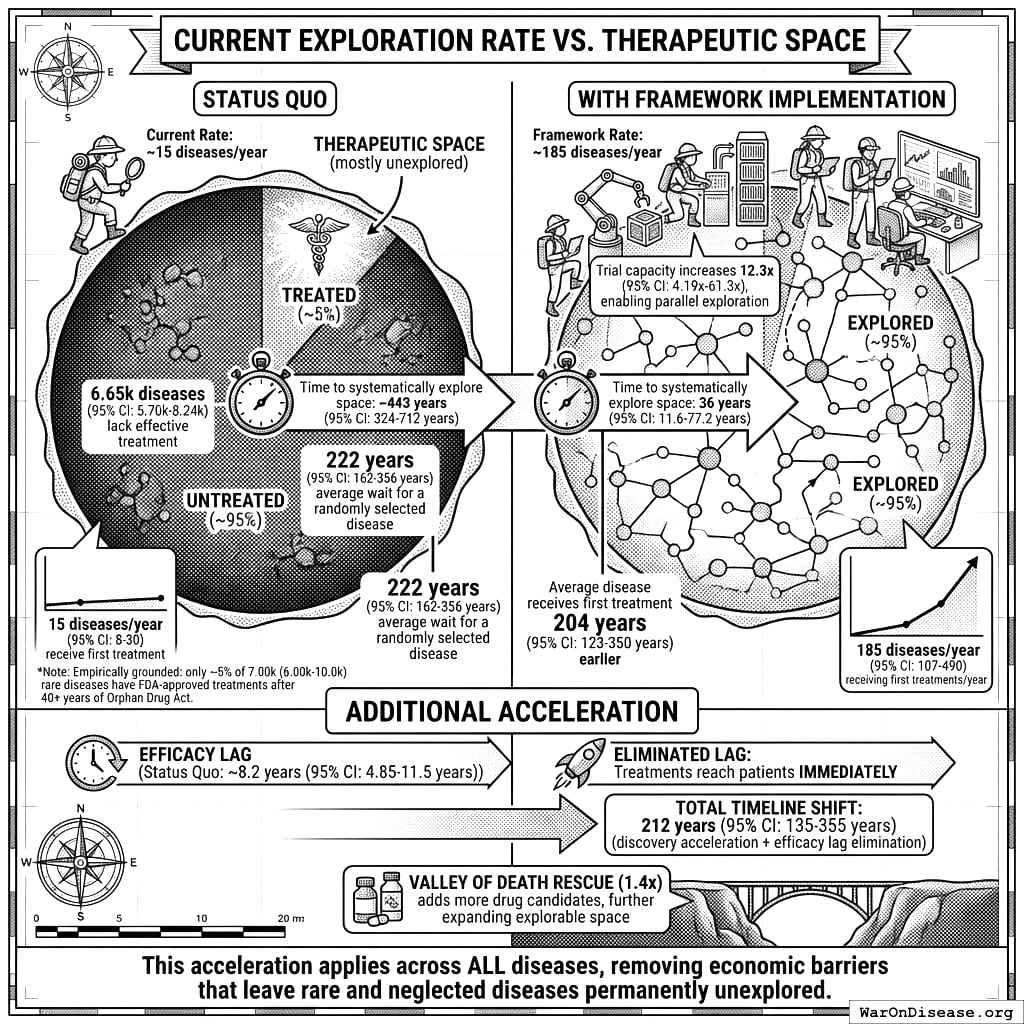
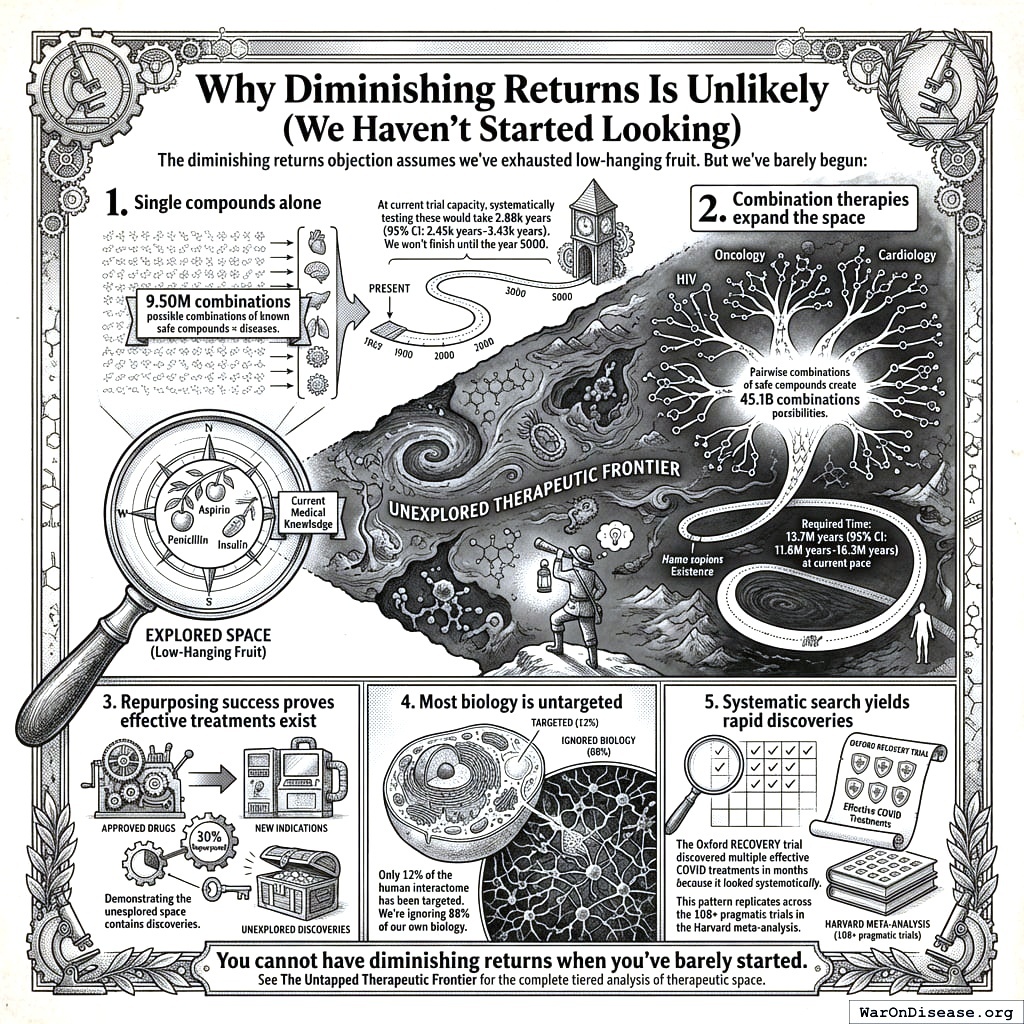
The bottleneck: Approximately 6,650 diseases (90% CI: 5,700 diseases-8,232 diseases) have zero FDA-approved treatments. At current trial capacity (~15 diseases/year (95% CI: 8 diseases/year-30 diseases/year) new treatments/year), systematically testing all 9.5 million combinations (90% CI: 6.68 million combinations-12.8 million combinations) plausible drug-disease combinations would take ~443 years (90% CI: 255 years-841 years). Effectively never.
\[
\begin{gathered}
N_{untreated} \\
= N_{rare} \times 0.95 \\
= 7{,}000 \times 0.95 \\
= 6{,}650
\end{gathered}
\]
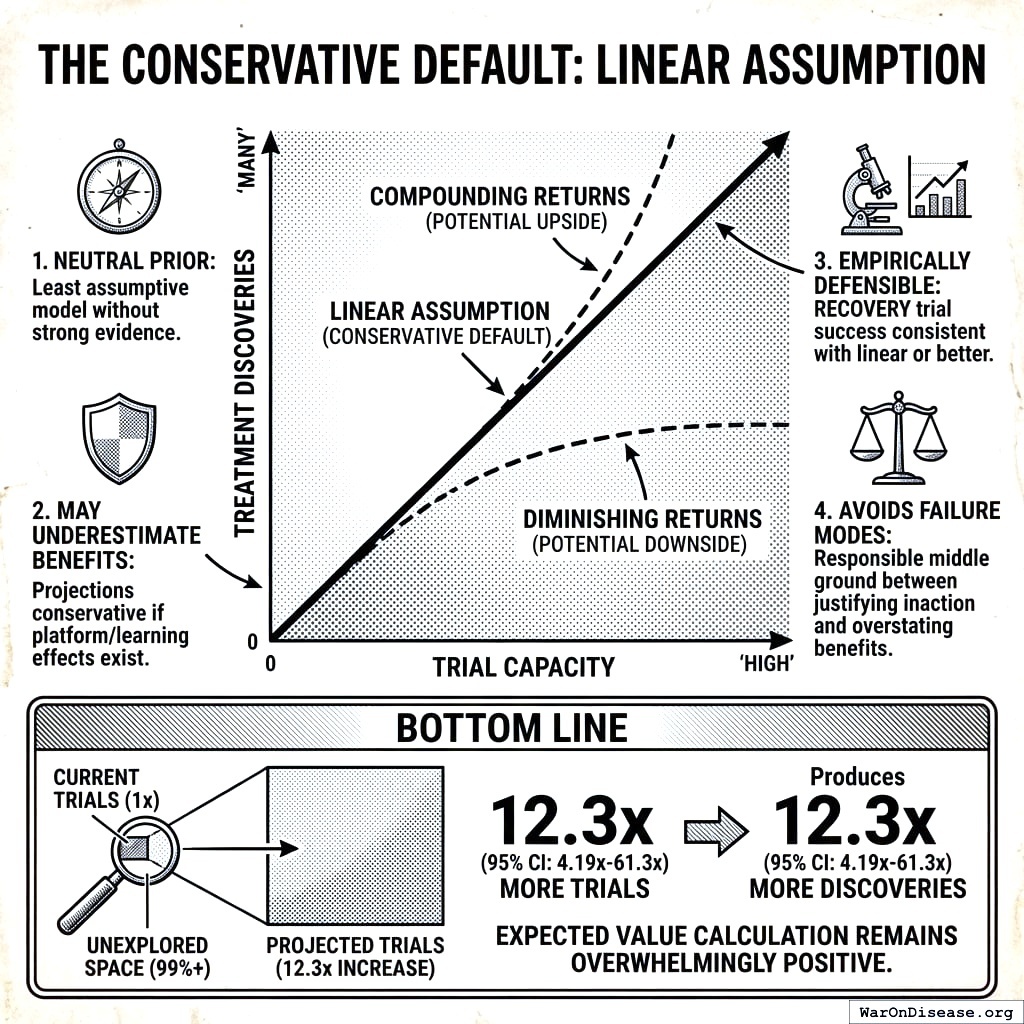
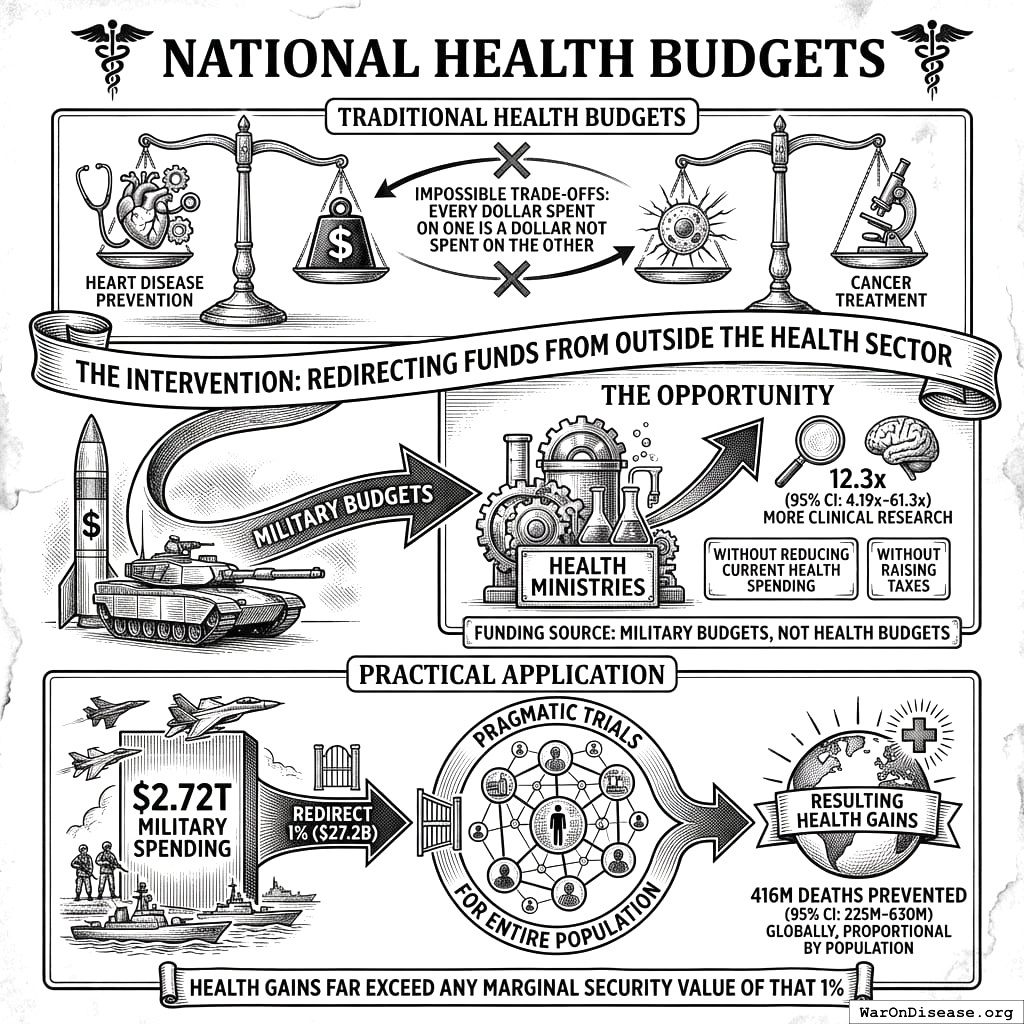
The solution: Redirecting 1% of global military spending ($27.2 billion/year) to pragmatic clinical trials increases capacity 12.3x (90% CI: 4.92x-50.8x) (to ~185 diseases/year (90% CI: 63.8 diseases/year-816 diseases/year) treatments/year). Pragmatic trials cost $929 (95% CI: $97-$3,000)/patient versus $41,000 (95% CI: $20,000-$120,000)/patient for traditional trials, enabling vastly more parallel research. This reduces time to explore all therapeutic possibilities from ~443 years (90% CI: 255 years-841 years) to ~36 years (90% CI: 8.15 years-106 years).
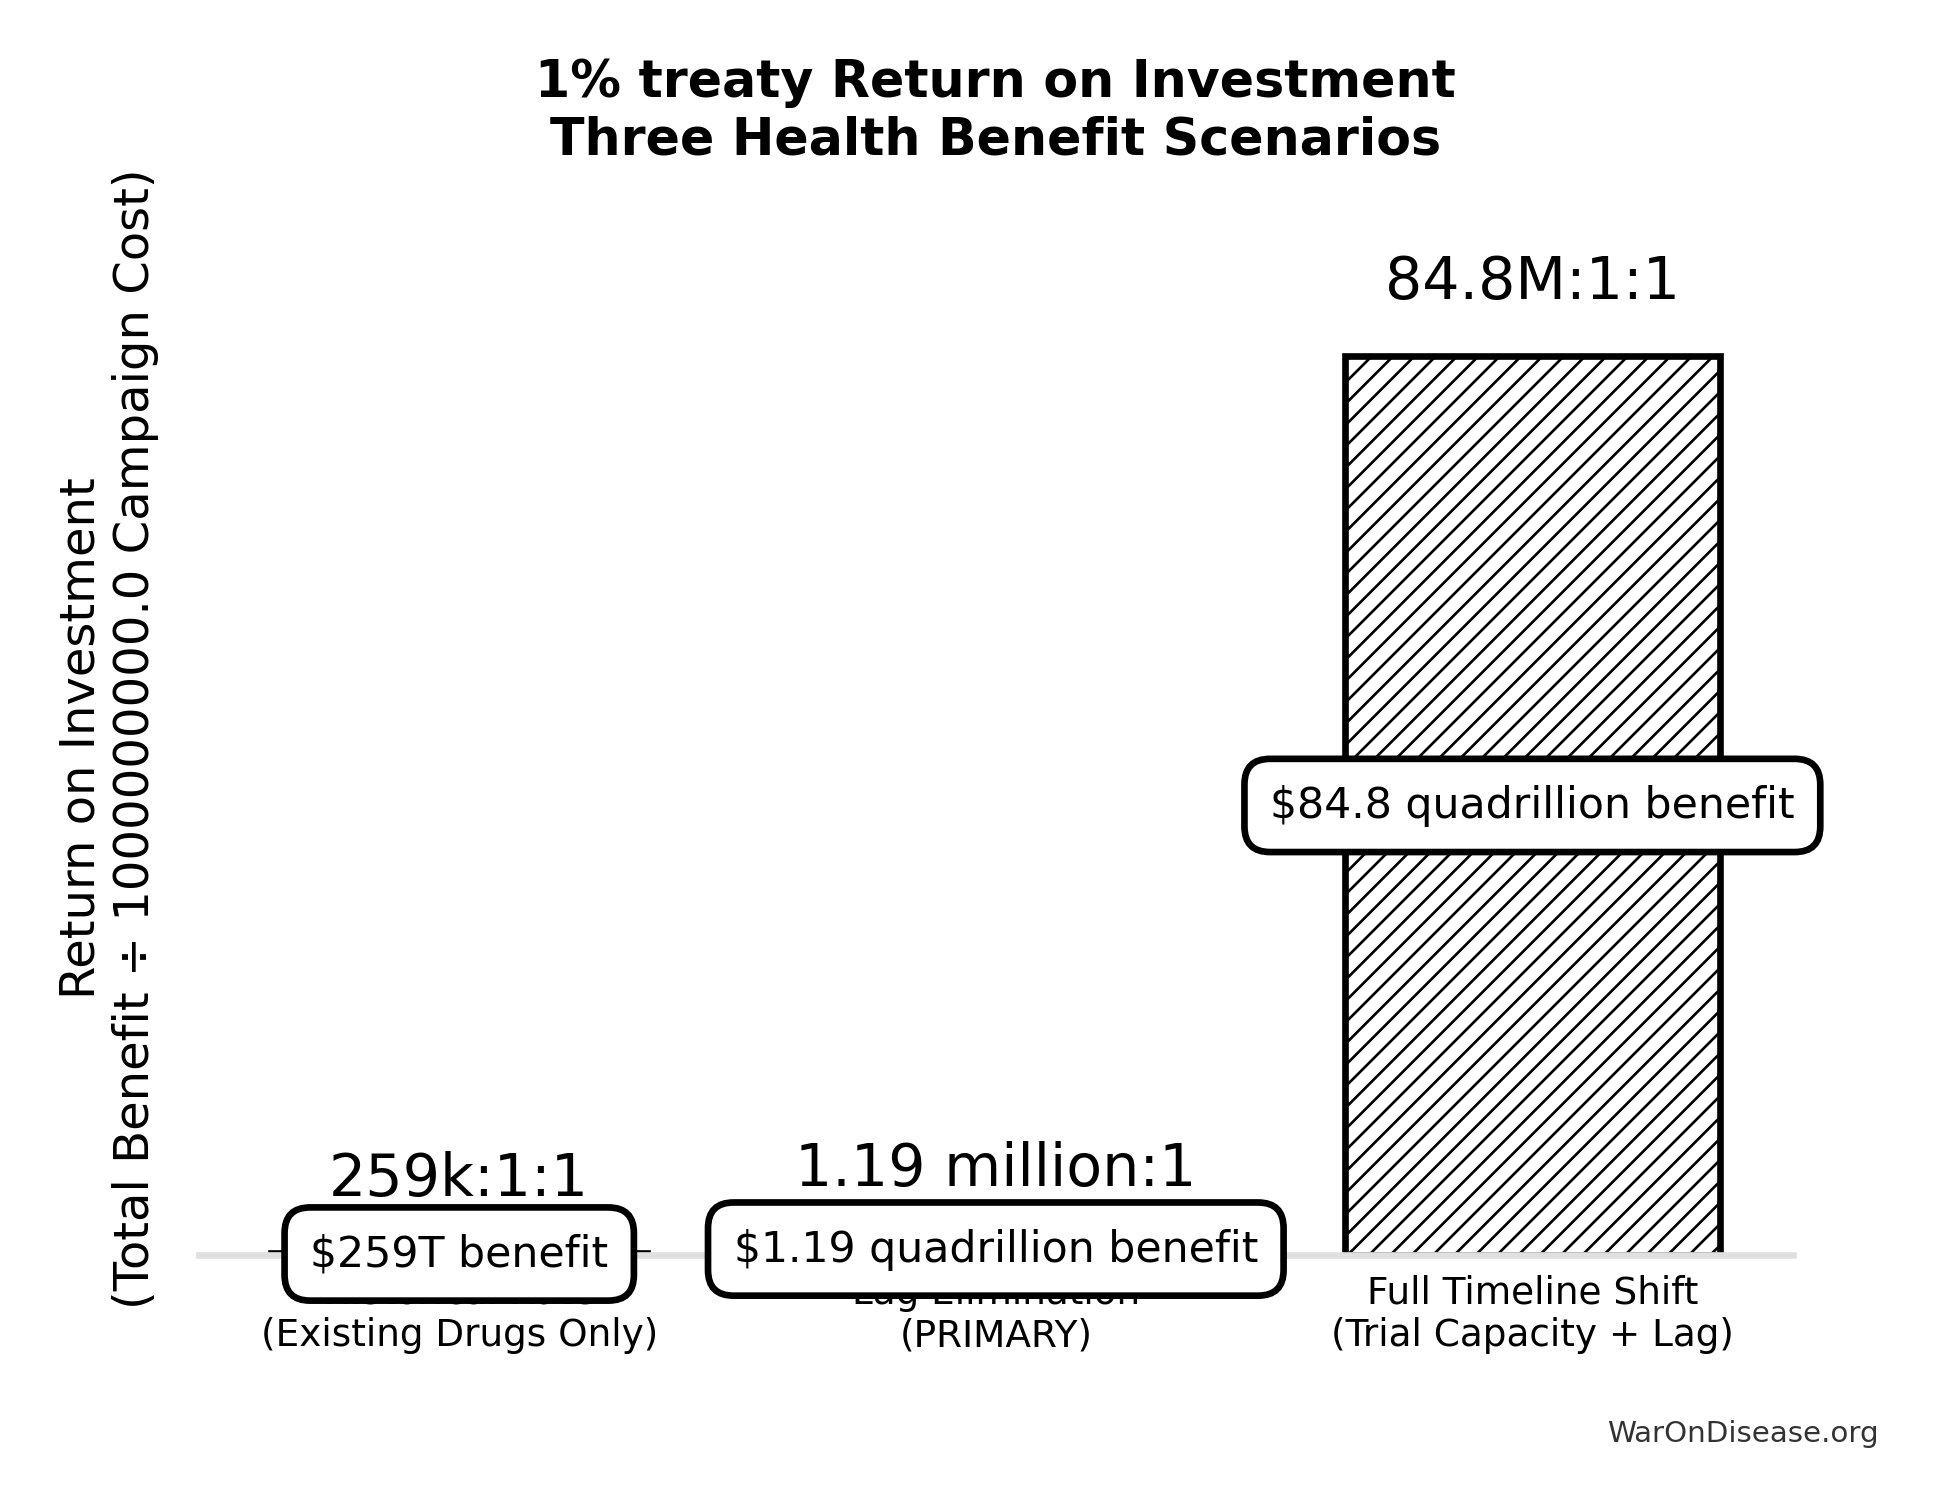
The impact: Treatments that would have taken decades to even begin researching under the status quo get discovered and delivered decades earlier. Combined with eliminating the 8.2 years (90% CI: 4.84 years-11.5 years) regulatory efficacy delay (via opt-in access to ubiquitous trials after Phase I safety), the average treatment reaches patients 212 years (90% CI: 124 years-398 years) sooner. This timeline shift saves 10.7 billion deaths (90% CI: 6.24 billion deaths-20.3 billion deaths), valued at $84.8 quadrillion (90% CI: $42.9 quadrillion-$172 quadrillion).
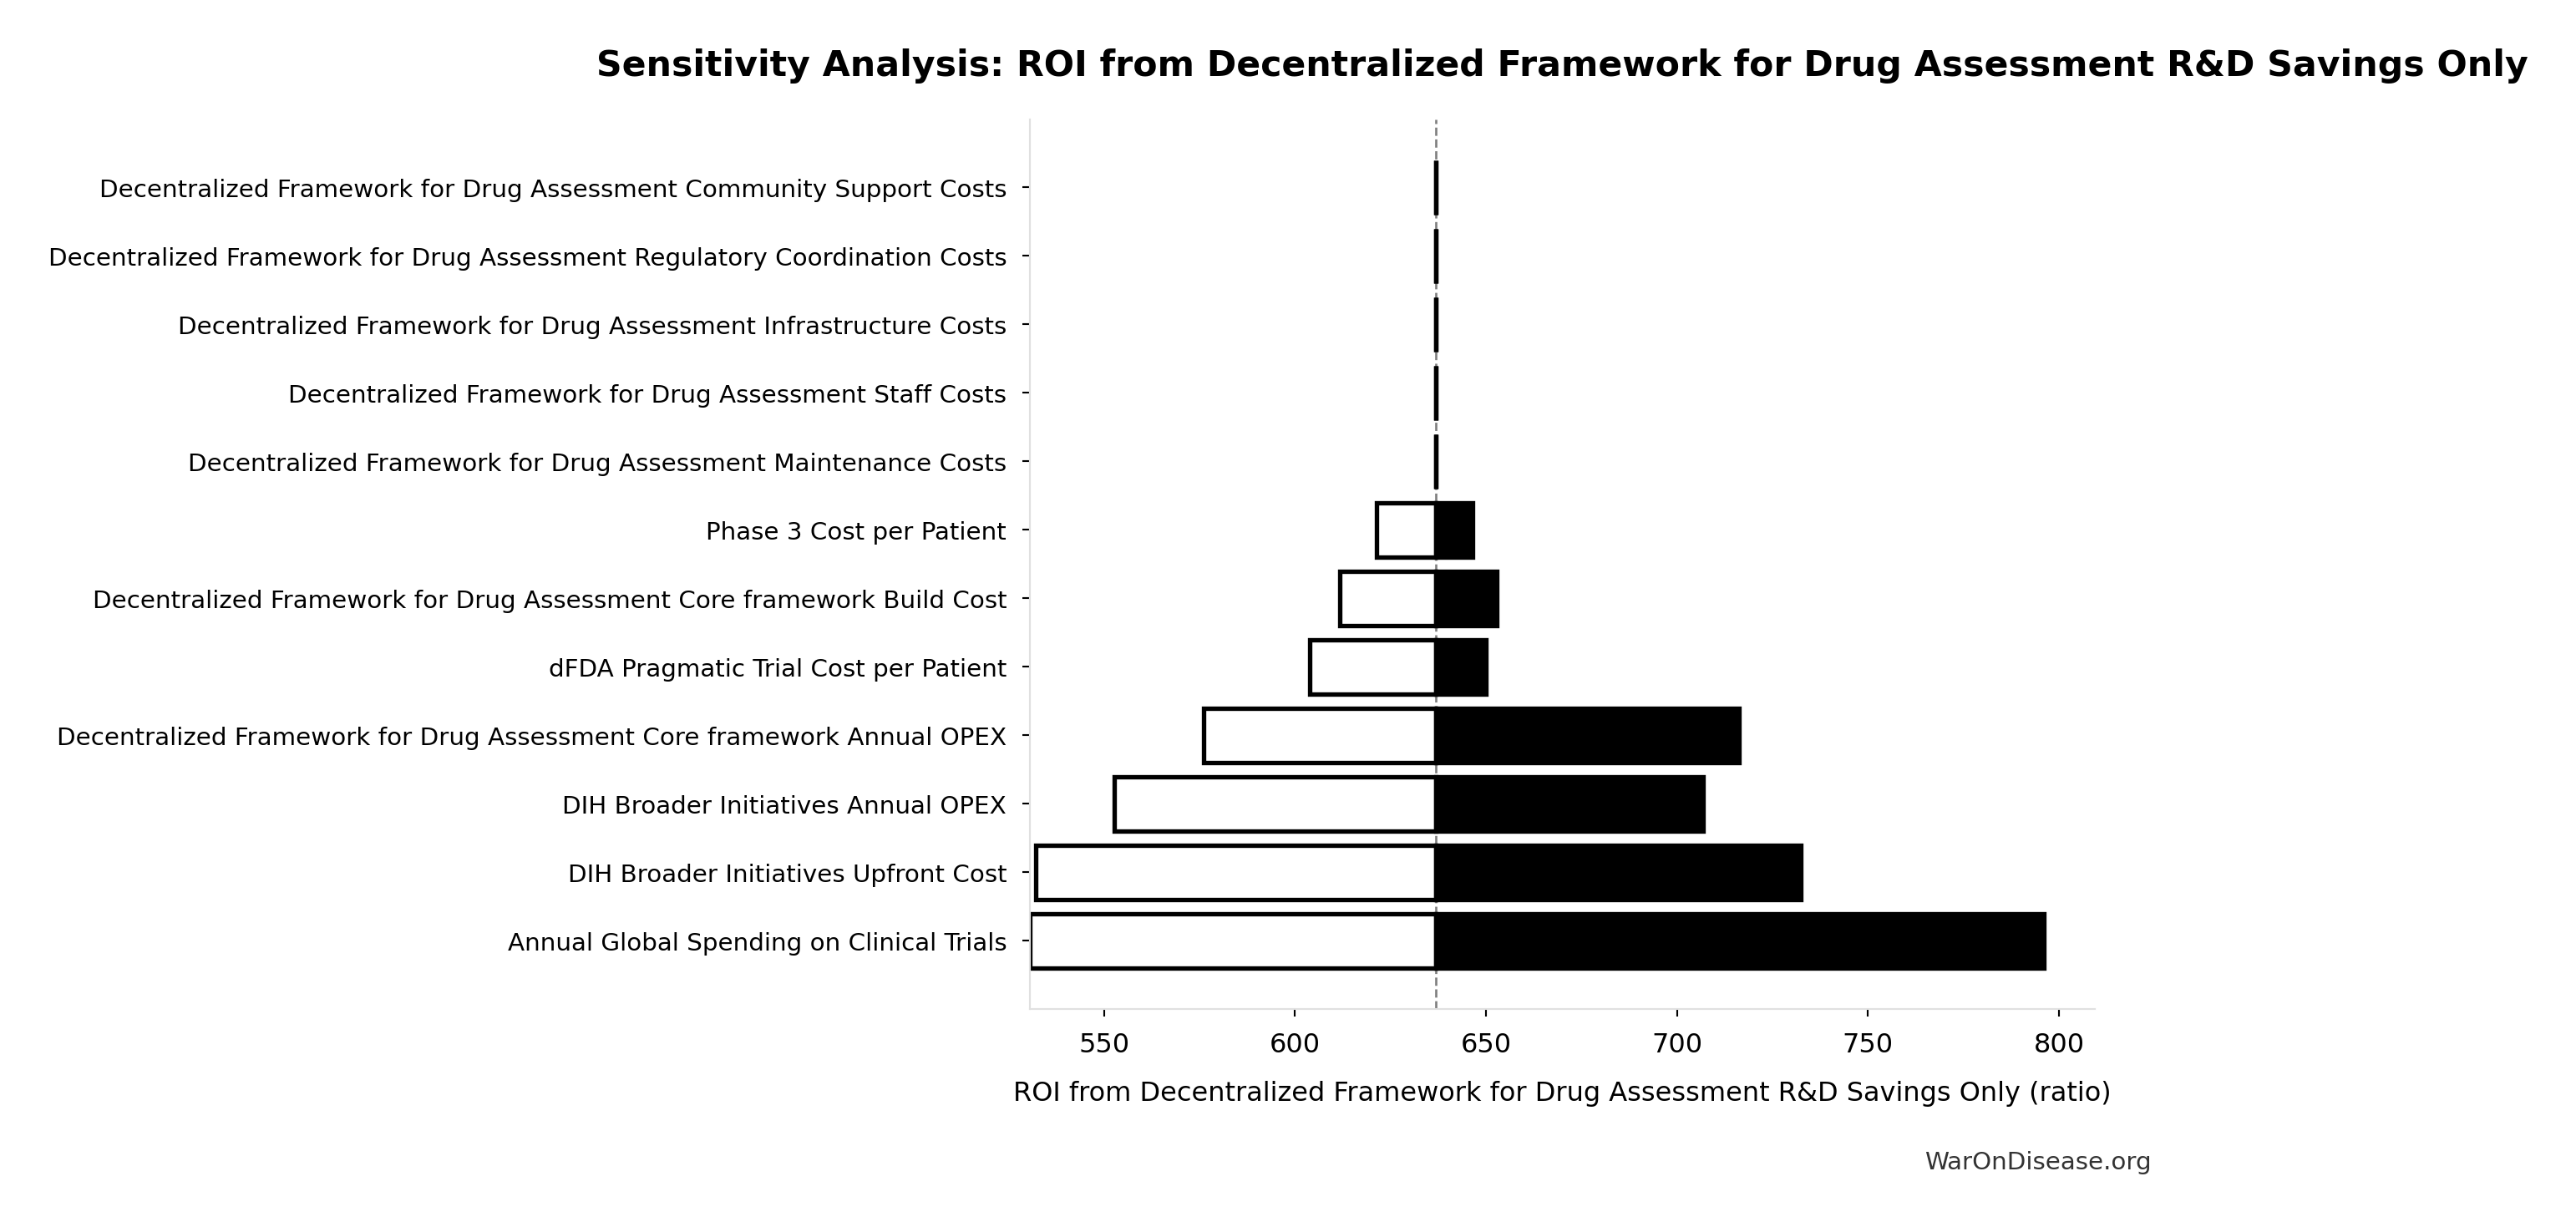
Cost-effectiveness: $0.00177 (90% CI: $0.000809-$0.00354)/DALY via treaty advocacy (50.3kx (90% CI: 25.0kx-111.1kx) better than bed nets) or $0.842 (90% CI: $0.264-$1.49)/DALY via direct funding. ROI ranges from 439 (90% CI: 321-600):1 (R&D savings only) to 84.8 million (90% CI: 39.6 million-194 million):1 (complete benefits). This qualifies as cost-saving: it reduces costs while improving outcomes.
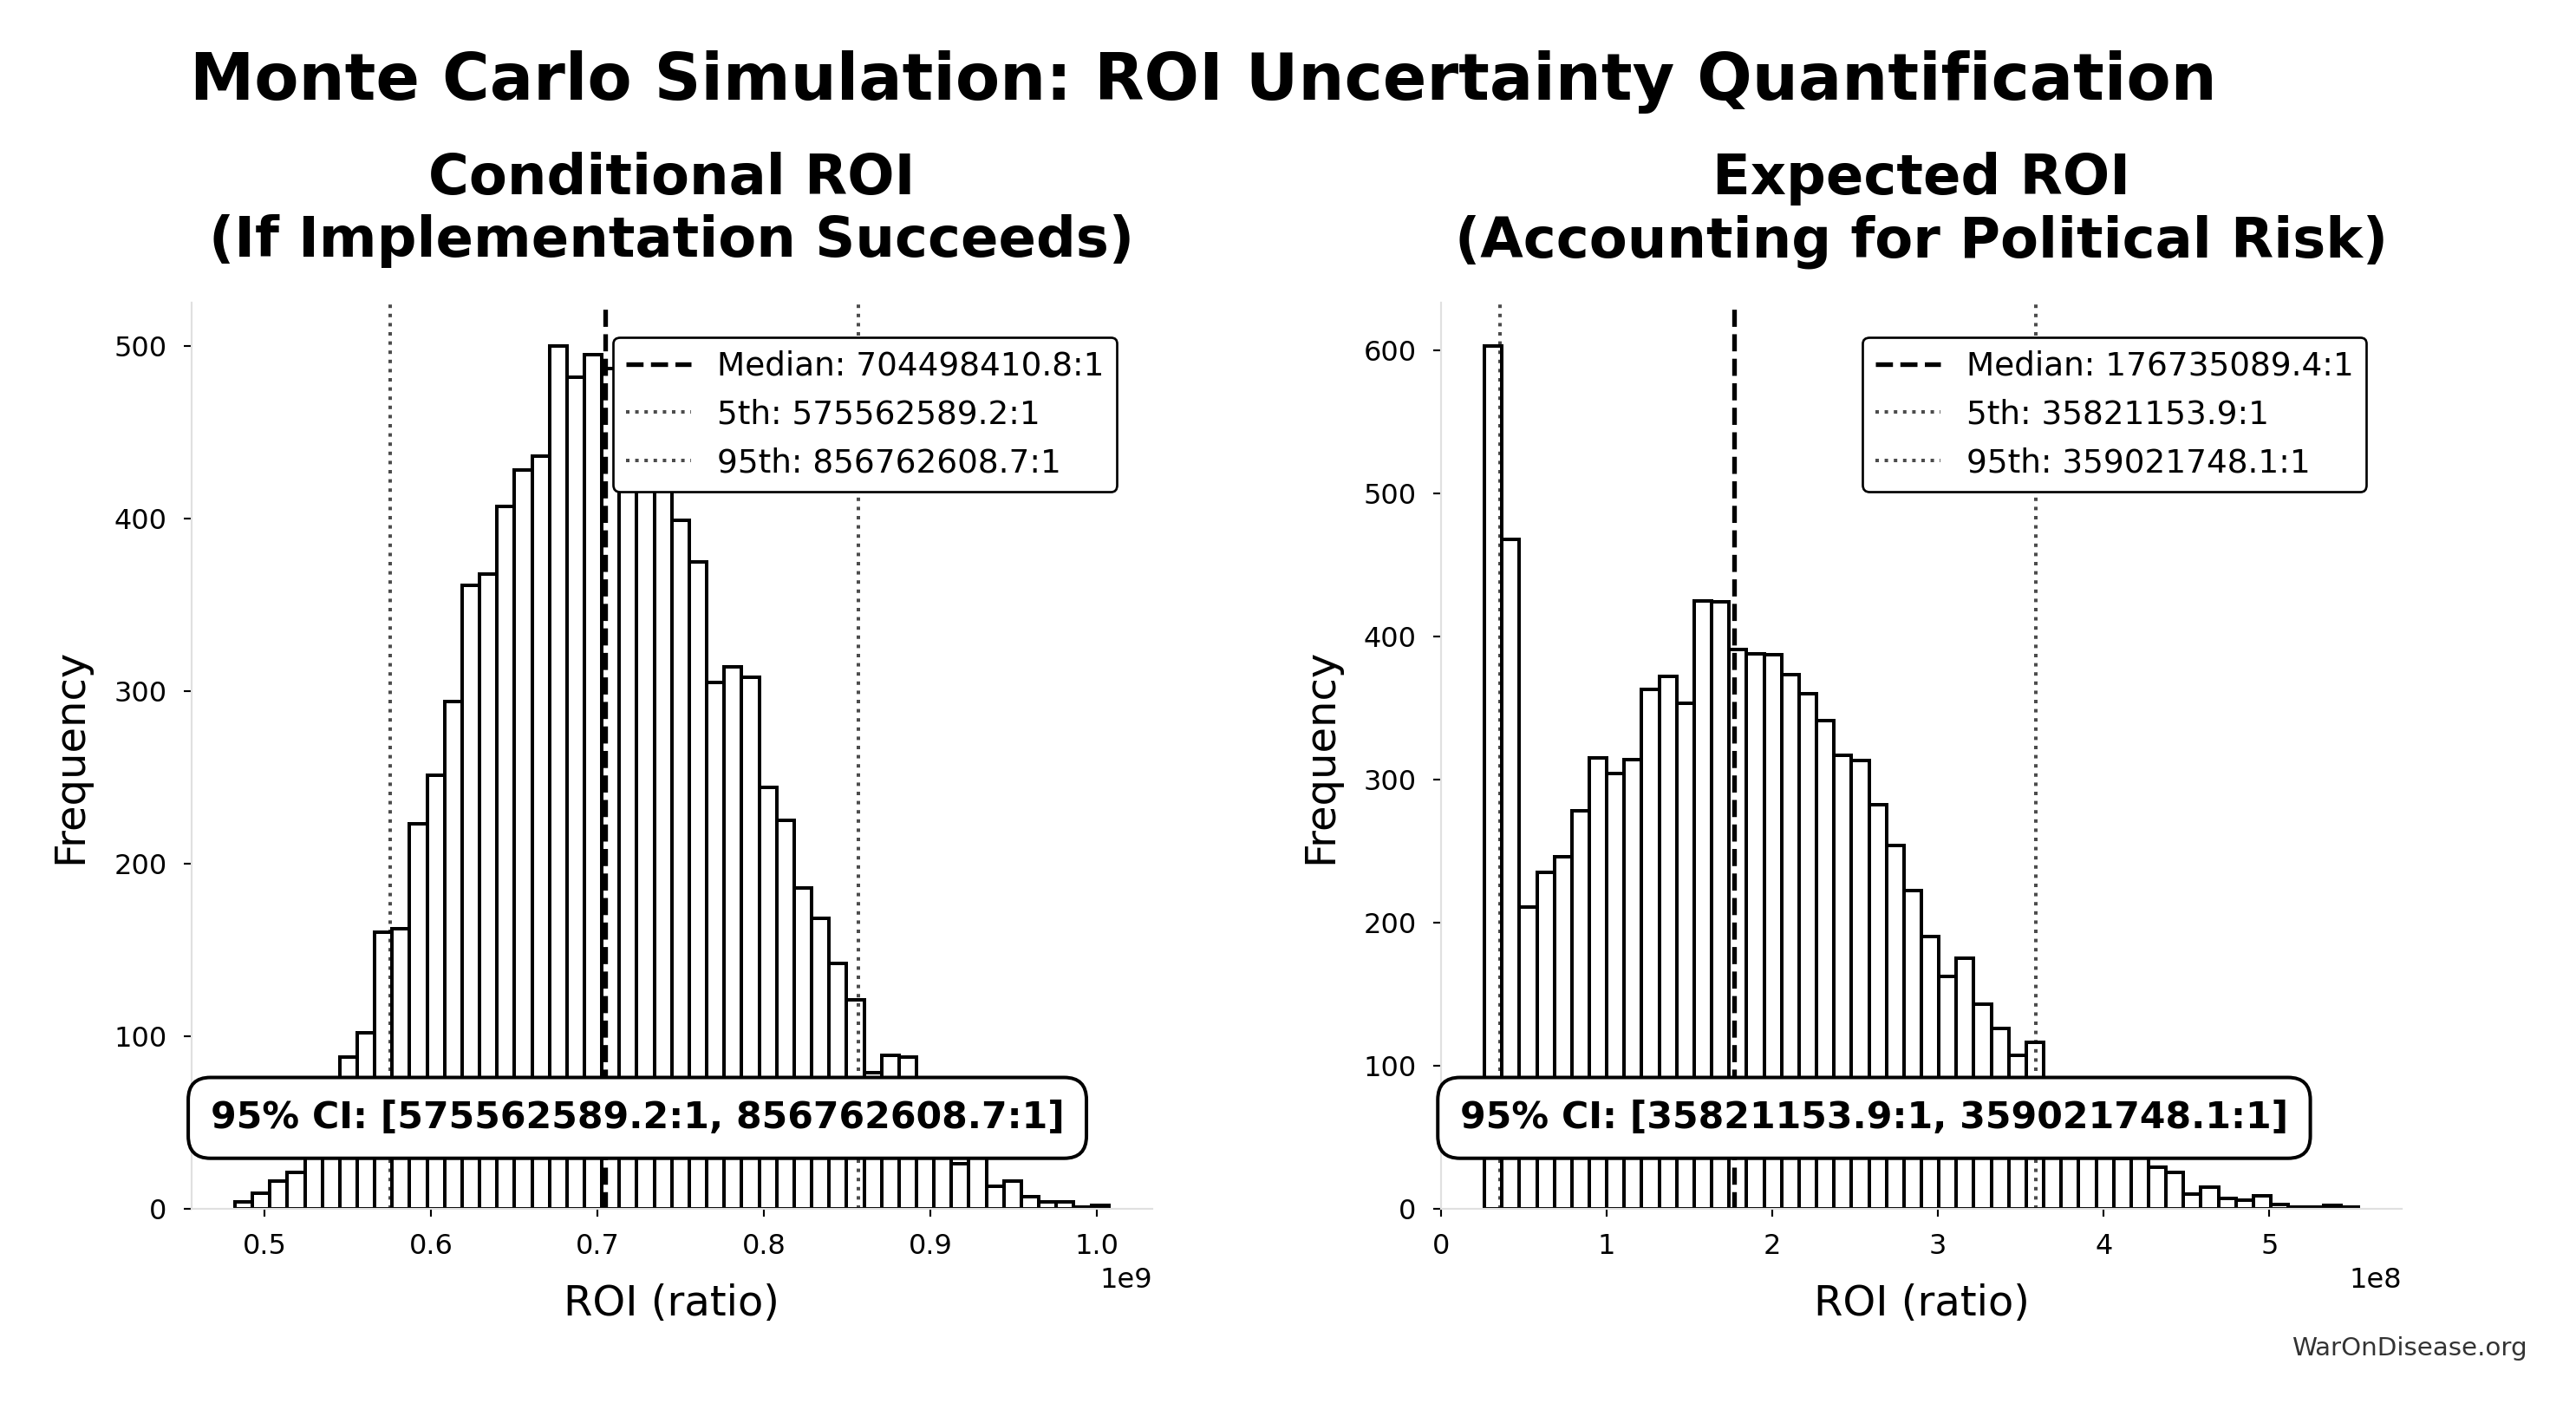
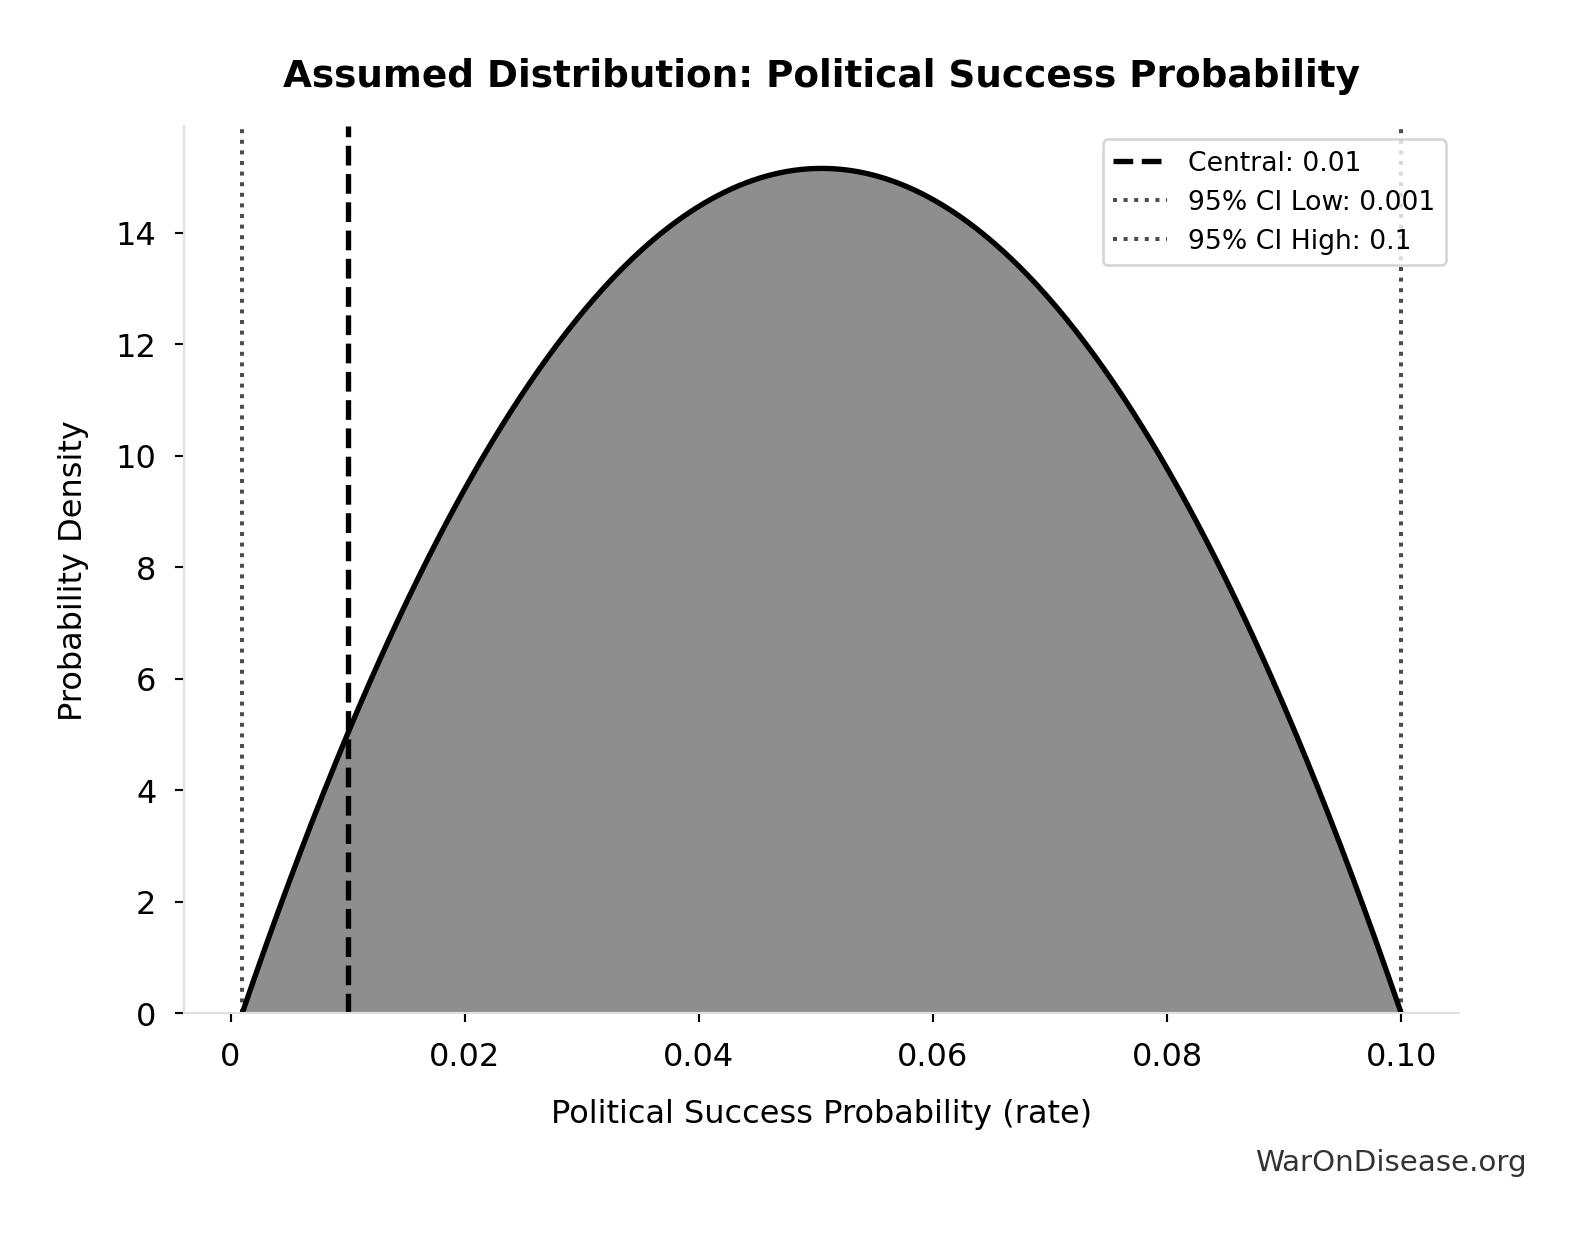
Robustness: Even at 1% (95% CI: 0.1%-10%) probability of treaty adoption, risk-adjusted cost-effectiveness ($0.177 (90% CI: $0.03-$2.92)/DALY) remains 503x (90% CI: 30.5x-3.0kx) better than bed nets. Monte Carlo simulation (10,000 trials) confirms the intervention remains cost-saving across parameter uncertainty. Benefit estimates are conditional on adoption but independent of the adoption pathway; the pathways specified to date differ in cost by more than an order of magnitude and the cost-effectiveness conclusion survives substituting any of them (Adoption Pathways and Cost Sensitivity).
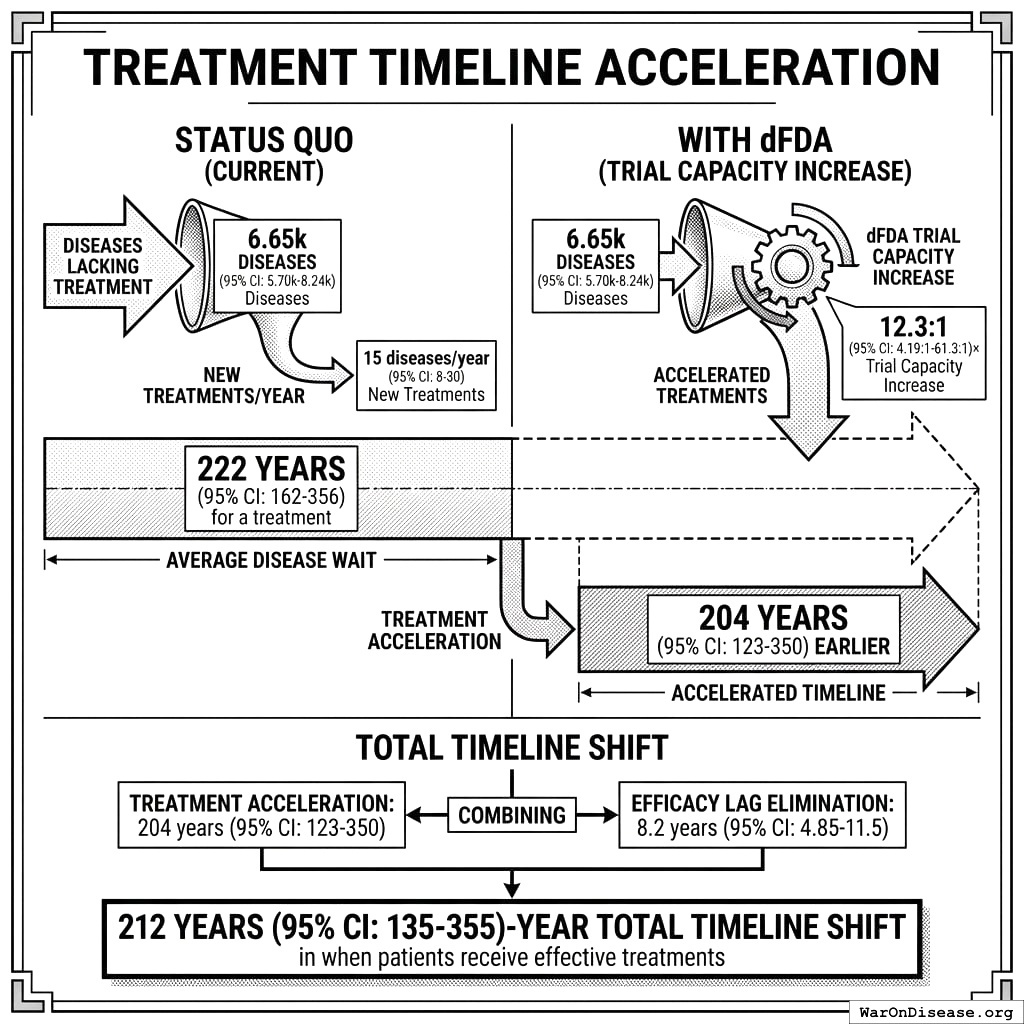
Impact Mechanism: The 212 years (90% CI: 124 years-398 years) average timeline shift combines two complementary effects:
Interpreting the 212 years (90% CI: 124 years-398 years) Timeline Figure: This is a discovery capacity model result, not “time travel” or a prediction that we will achieve results centuries from now. If we must test 9.5 million combinations (90% CI: 6.68 million combinations-12.8 million combinations) drug-disease combinations to find all effective treatments, the current system (15 diseases/year (95% CI: 8 diseases/year-30 diseases/year) treatments/year) would take ~443 years (90% CI: 255 years-841 years) to explore this therapeutic search space. Scaling capacity 12.3x (90% CI: 4.92x-50.8x) reduces exploration time to ~36 years (90% CI: 8.15 years-106 years). The “212 years (90% CI: 124 years-398 years)” represents the average time a treatment that could be discovered today would have waited under the old system versus the new system. Treatments discovered sooner save lives during the intervening period; this cumulative benefit over the acceleration period yields the headline mortality and economic figures.
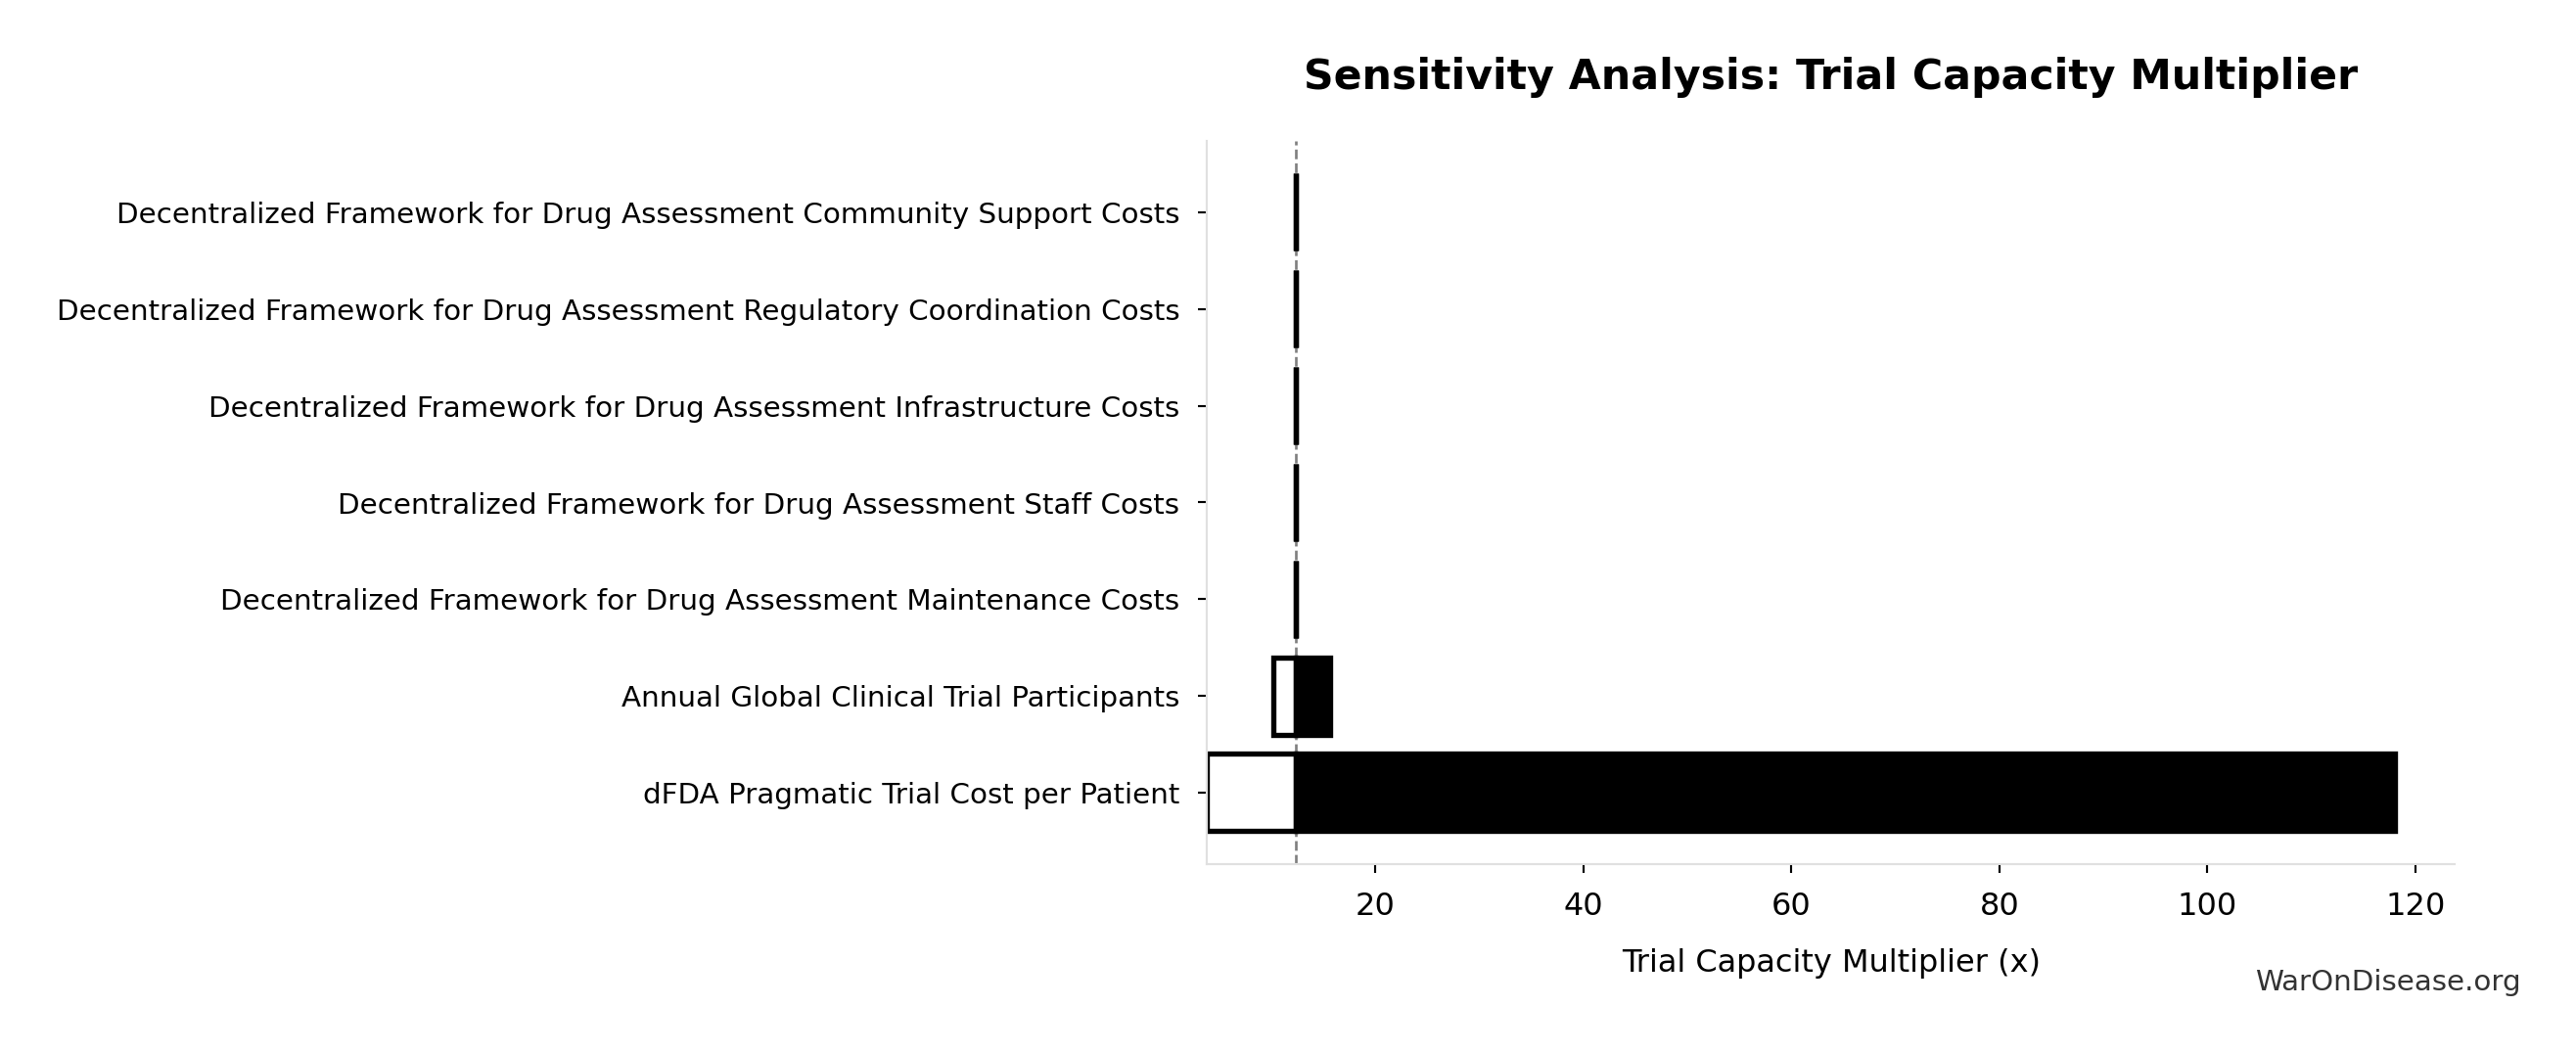
How the 12.3x (90% CI: 4.92x-50.8x) capacity increase works: Redirecting $27.2 billion/year at $929 (95% CI: $97-$3,000)/patient (based on ADAPTABLE trial; RECOVERY achieved $500 (95% CI: $400-$2,500)/patient under exceptional NHS/COVID conditions) enables 23.4 million patients/year (90% CI: 9.21 million patients/year-93.7 million patients/year) annual trial participants vs. current 1.9 million patients/year (95% CI: 1.5 million patients/year-2.3 million patients/year), increasing trial completion rate from 15 diseases/year (95% CI: 8 diseases/year-30 diseases/year) to 185 diseases/year (90% CI: 63.8 diseases/year-816 diseases/year). This removes the primary bottleneck to medical progress: currently less than 0.06% of willing patients can access trials, and over 9,500 compounds (95% CI: 7,000 compounds-12,000 compounds) proven-safe compounds (FDA-approved drugs + GRAS substances) remain untested for most conditions they could improve.
Methods: Cost-benefit analysis, NPV calculations, QALY modeling, and ICER analysis using SIPRI military expenditure data, WHO mortality statistics, Harvard meta-analysis of 108 embedded pragmatic trials135, and published clinical trial cost literature. Conservative estimates exclude research acceleration effects; complete estimates include all quantifiable benefits. All parameters, data sources, and uncertainty ranges documented in Parameters and Calculations.
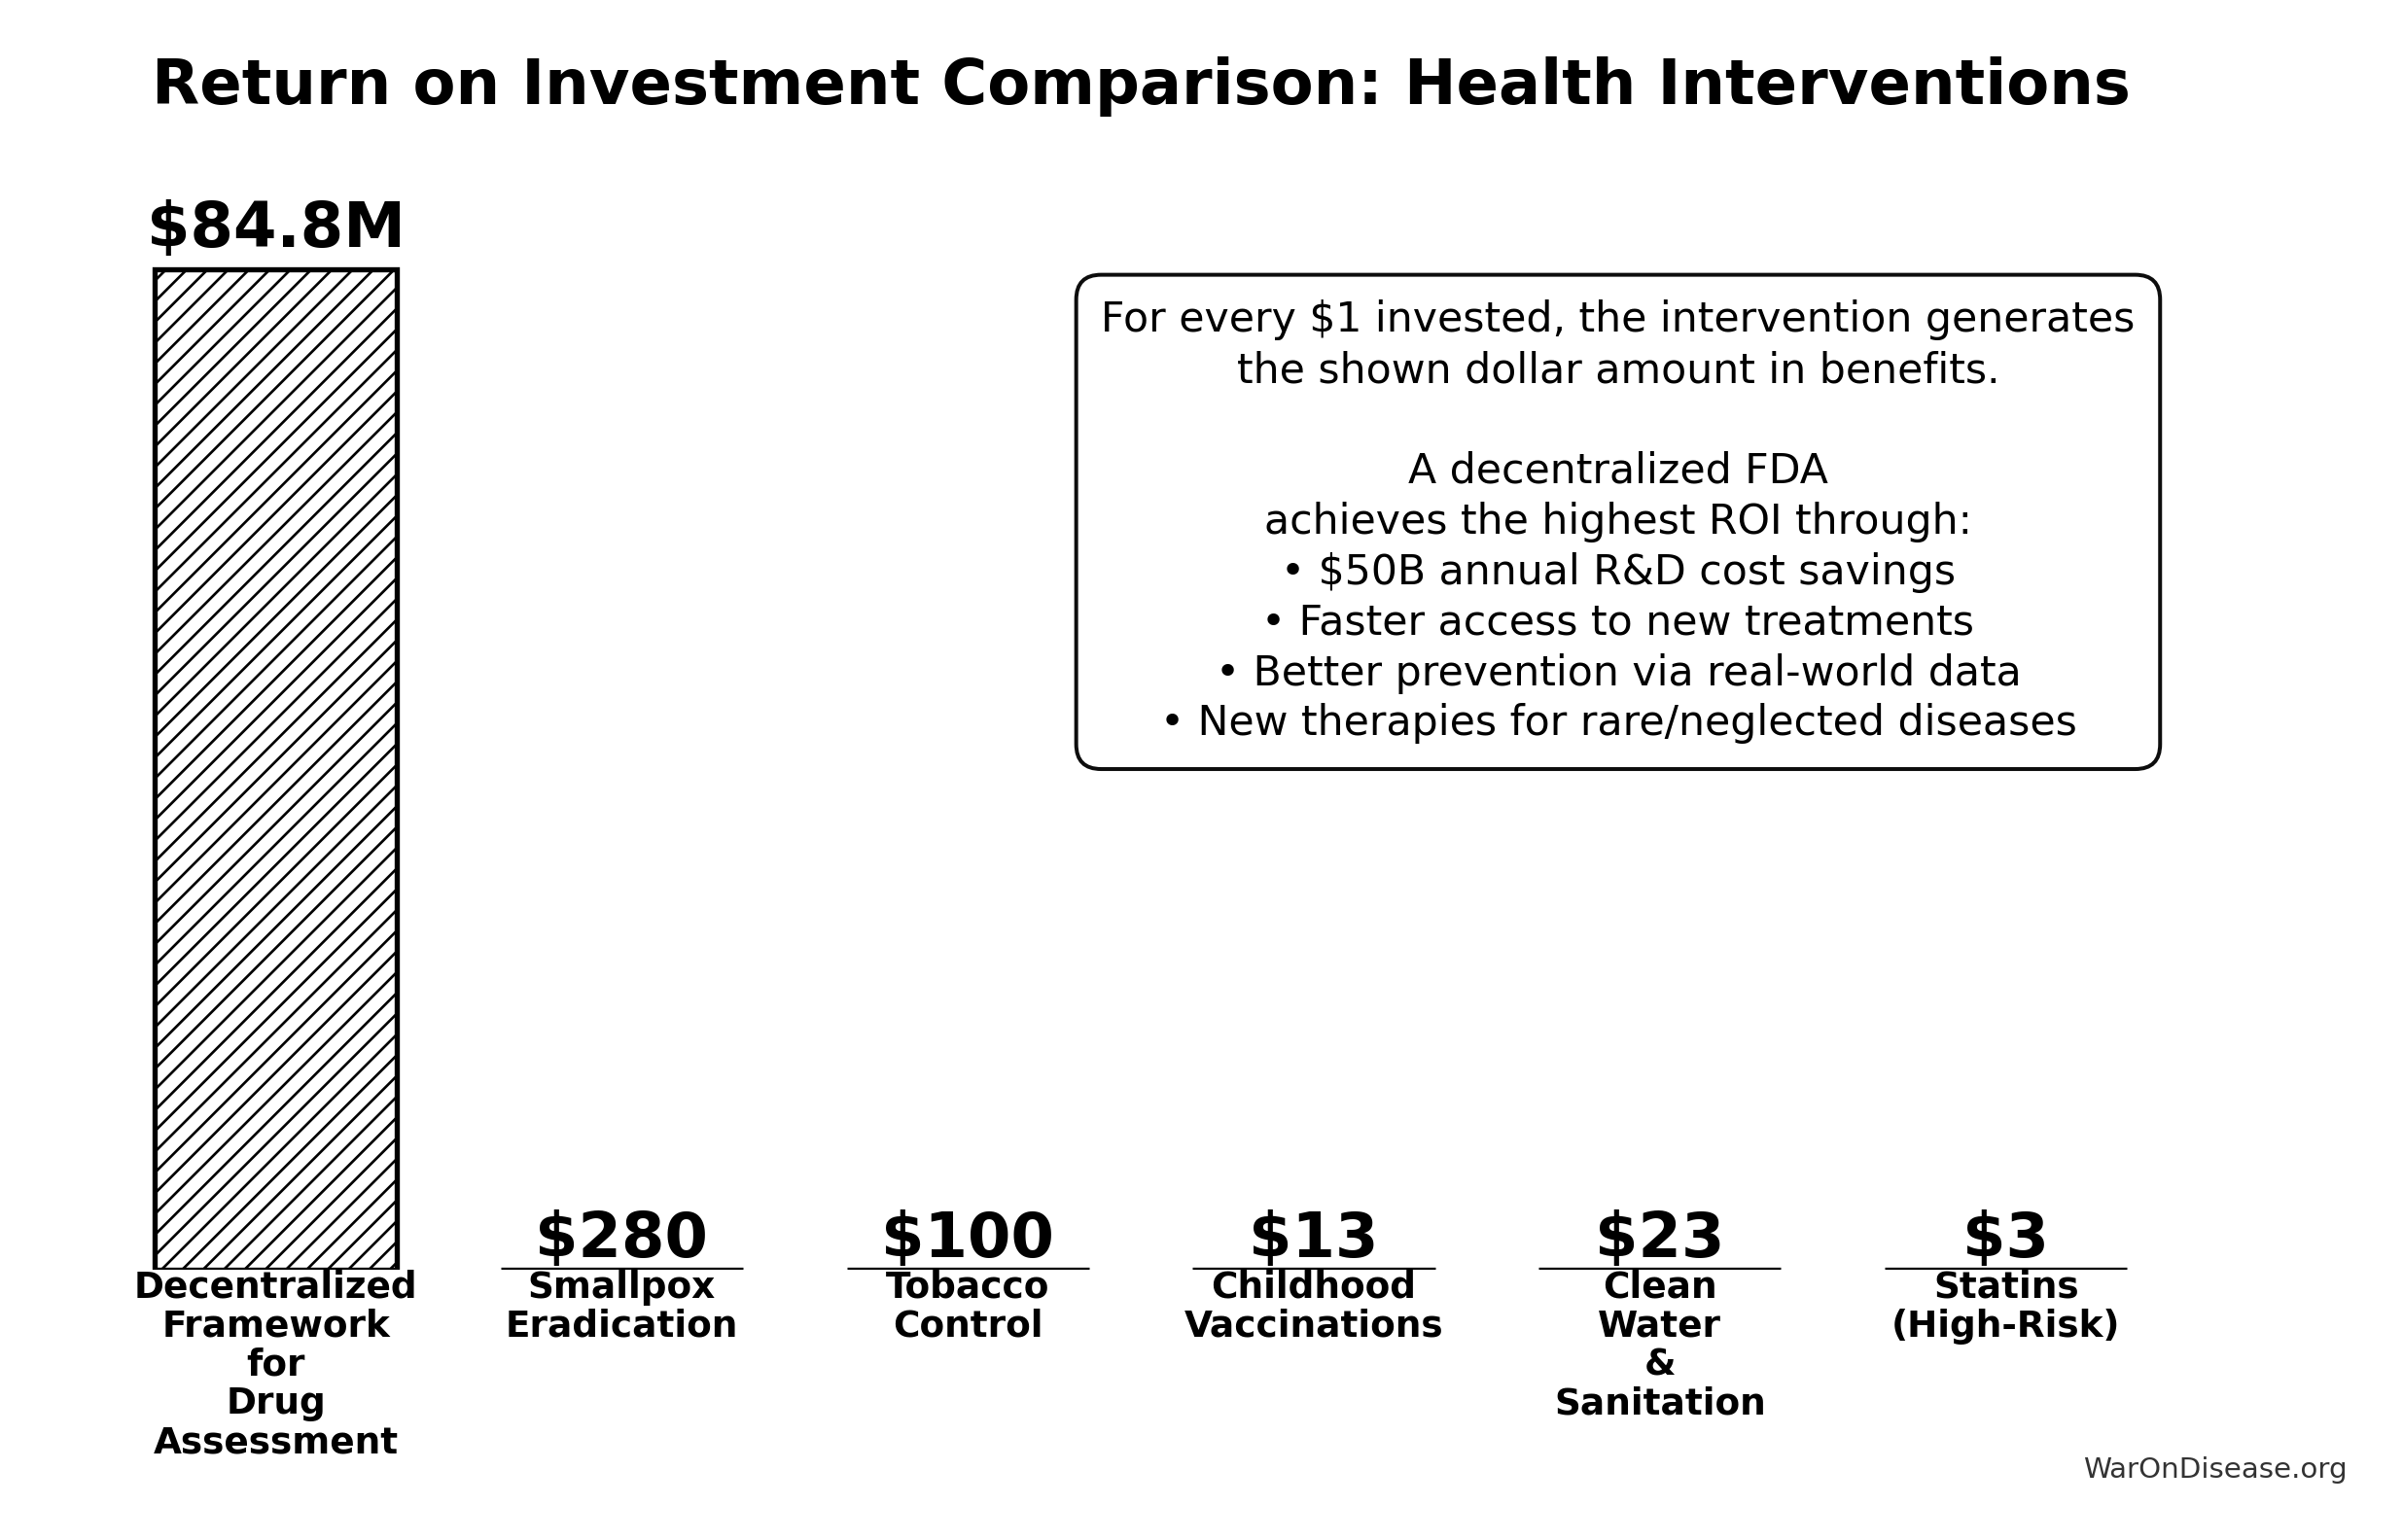
Implications: This intervention corrects a fundamental capital misallocation: military spending creates depreciating assets (weapons become obsolete), while medical research creates appreciating assets (treatments compound in value). Comparable to smallpox eradication (280:1 ROI), it represents the highest-ROI reallocation available to policymakers.
Important limitations: (1) Economic value estimates are cumulative over the ~212 years (90% CI: 124 years-398 years) timeline shift, not annual values. (2) All estimates are conditional on successful treaty implementation. (3) Phase I safety testing remains mandatory. What changes is eliminating post-safety efficacy delays. (4) The “quadrillion dollar” figures represent monetized value of lives saved over centuries of accelerated medical progress, using standard QALY methodology.
Keywords: 1% Treaty, pragmatic clinical trials, regulatory delay, cost-effectiveness analysis, DALY, peace dividend
Primary Findings
The proposal: Redirect 1% of global military spending ($27.2 billion/year) to fund pragmatic clinical trials that allow patient access after Phase I safety verification, rather than waiting 8.2 years (90% CI: 4.84 years-11.5 years) additional years for Phase II/III efficacy confirmation before patient access.
Bottom line: Cost-saving intervention comparable to smallpox eradication (280:1 ROI).
Introduction
Historical Precedents for Grand Challenges
Health economics literature identifies three historical cost-saving interventions:
- Smallpox eradication (1967-1980): 280:1 ROI105, eliminating a disease that killed 300-500 million people in the 20th century alone
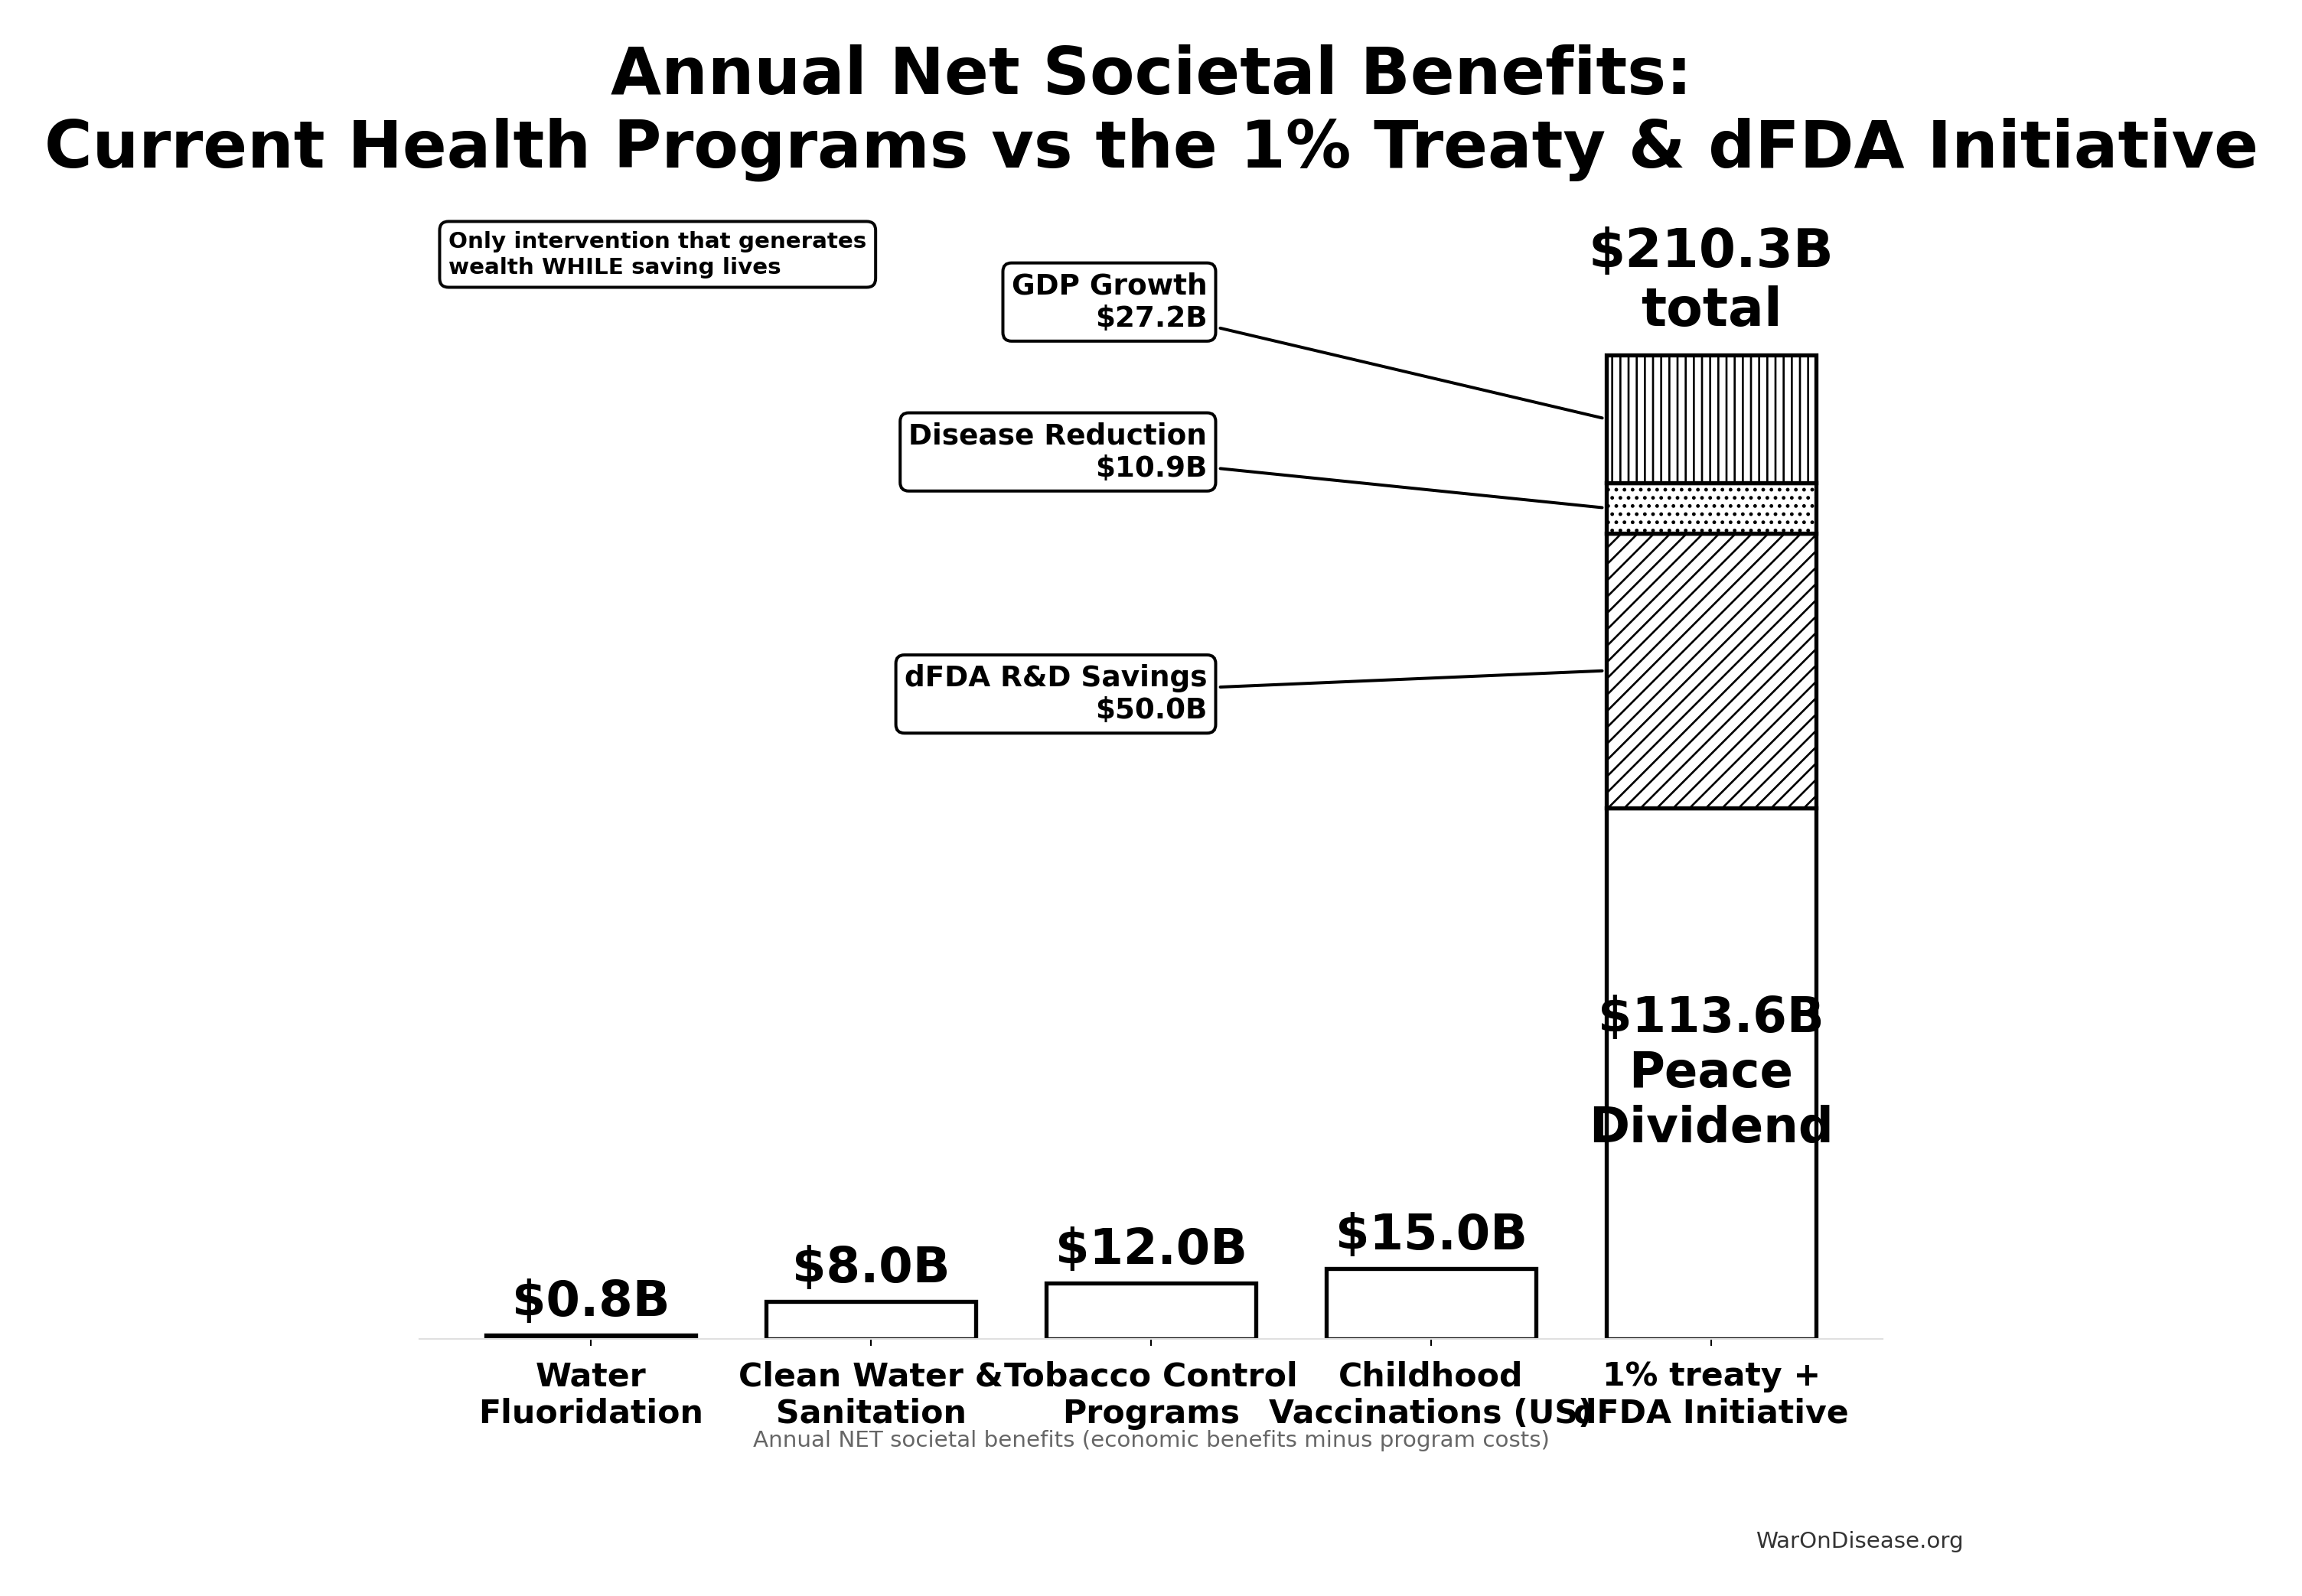
- Childhood vaccination programs: Self-funding interventions generating $15 billion (90% CI: $8.88 billion-$23.1 billion) in annual economic benefits12
- Water fluoridation: 23:1 ROI in dental health improvements133
These successes share common features: systemic interventions that address root causes rather than symptoms, positive externalities that compound over time, and political consensus achieved through demonstrated value. They also share a critical limitation: they targeted specific diseases or conditions. No historical intervention has systematically accelerated the discovery process itself.
The Medical Research Bottleneck
Current medical research faces fundamental capacity constraints that limit our ability to discover which treatments actually work:
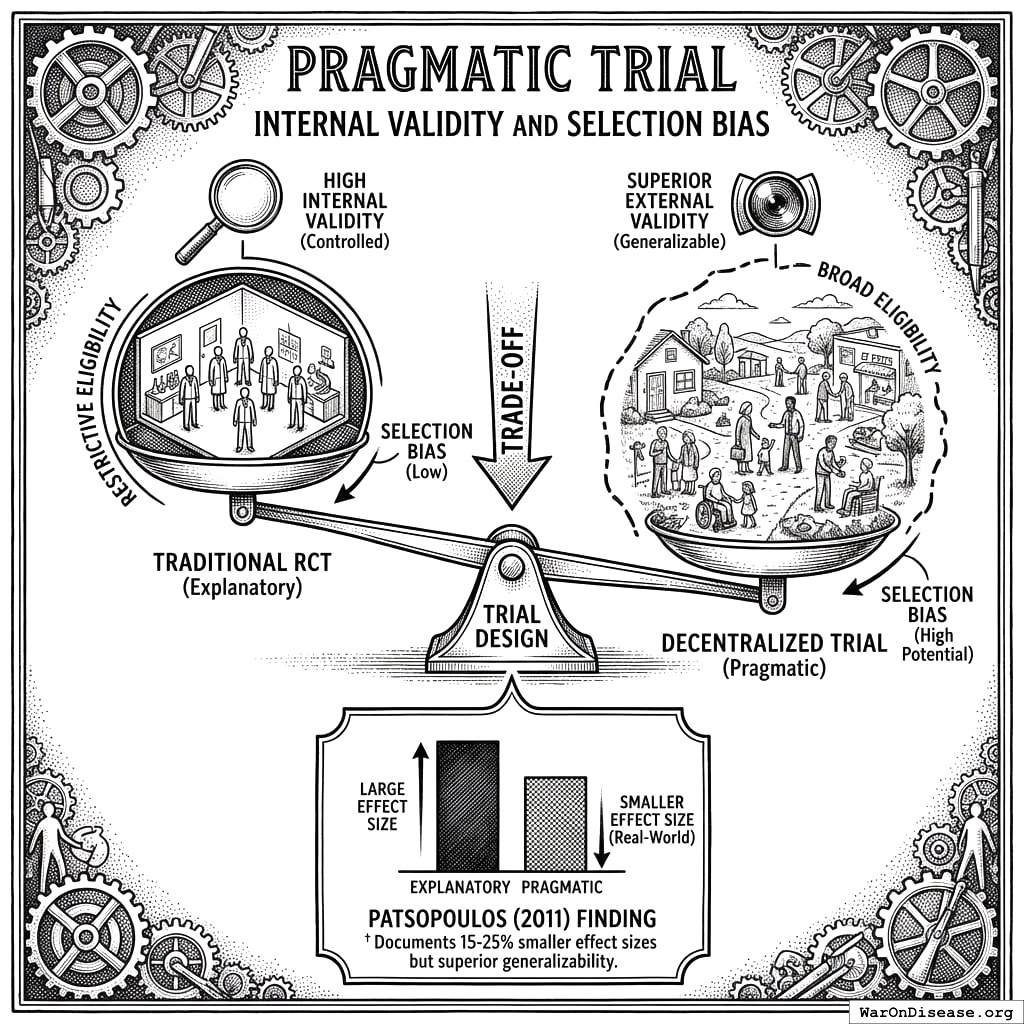
Multiple large-scale pragmatic trials and systematic reviews demonstrate that pragmatic trial design maintains scientific rigor while dramatically reducing costs. A Harvard review of 108 embedded pragmatic trials (64 with cost data) found median costs of $97 (95% CI: $19-$478)/patient135. The Oxford RECOVERY trial achieved $500 (95% CI: $400-$2,500)/patient (under exceptional NHS/COVID conditions), while the PCORnet ADAPTABLE trial achieved $929 (95% CI: $929-$1,400)/patient under normal conditions1. Our system projections use the conservative ADAPTABLE estimate ($929 (95% CI: $97-$3,000)/patient). This 44.1x (90% CI: 12.8x-210x) cost reduction transforms the economics of medical research: what was previously too expensive to test becomes systematically explorable.
Research Hypothesis
Primary Hypothesis: Reallocating 1% of global military spending ($27.2 billion annually) to fund decentralized pragmatic clinical trials generates return on investment between 439 (90% CI: 321-600):1 (conservative estimate, R&D savings only) and 84.8 million (90% CI: 39.6 million-194 million):1 (complete estimate, including peace dividend and all direct benefits), representing a dominant health intervention that simultaneously reduces costs while improving health outcomes.
Null Hypothesis (H₀): The intervention does not generate positive net economic value (ROI ≤ 1:1)
Alternative Hypothesis (H₁): The intervention generates substantial positive returns (ROI > 1:1), comparable to or exceeding history’s most successful public health interventions (smallpox eradication: 280:1105)
Testable Predictions:
Nomenclature and Key Terms
Trial protocol (specified in the companion papers136,137): An open standard that lets existing EHRs, health apps, and trial platforms run pragmatic trials embedded in routine care and publish every outcome. It also automates the compliance work around a trial: IRB submissions, liability insurance, and simultaneous filings with multiple agencies (FDA, EMA, PMDA, etc.). Reduces per-patient costs by 97.7% (90% CI: 92%-100%) compared to traditional trials.
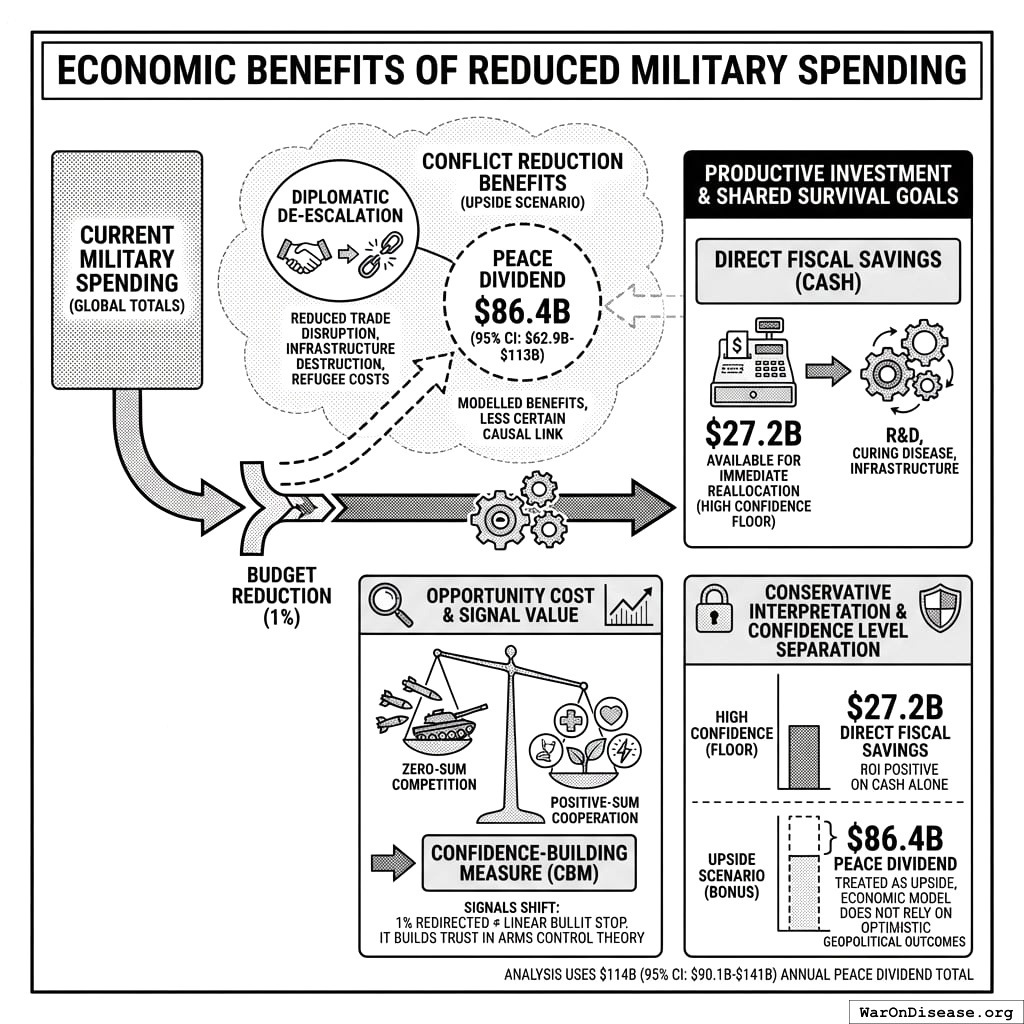
Peace Dividend: Economic benefits from reduced military spending, including fiscal savings, reduced conflict-related economic damage, and favorable economic multiplier effects from reallocating resources to productive sectors.
Cost-Saving Intervention (technical term: “dominant intervention”): Interventions that both reduce costs AND improve health outcomes. Generally recommended regardless of willingness-to-pay thresholds (e.g., vaccination programs, smoking cessation).
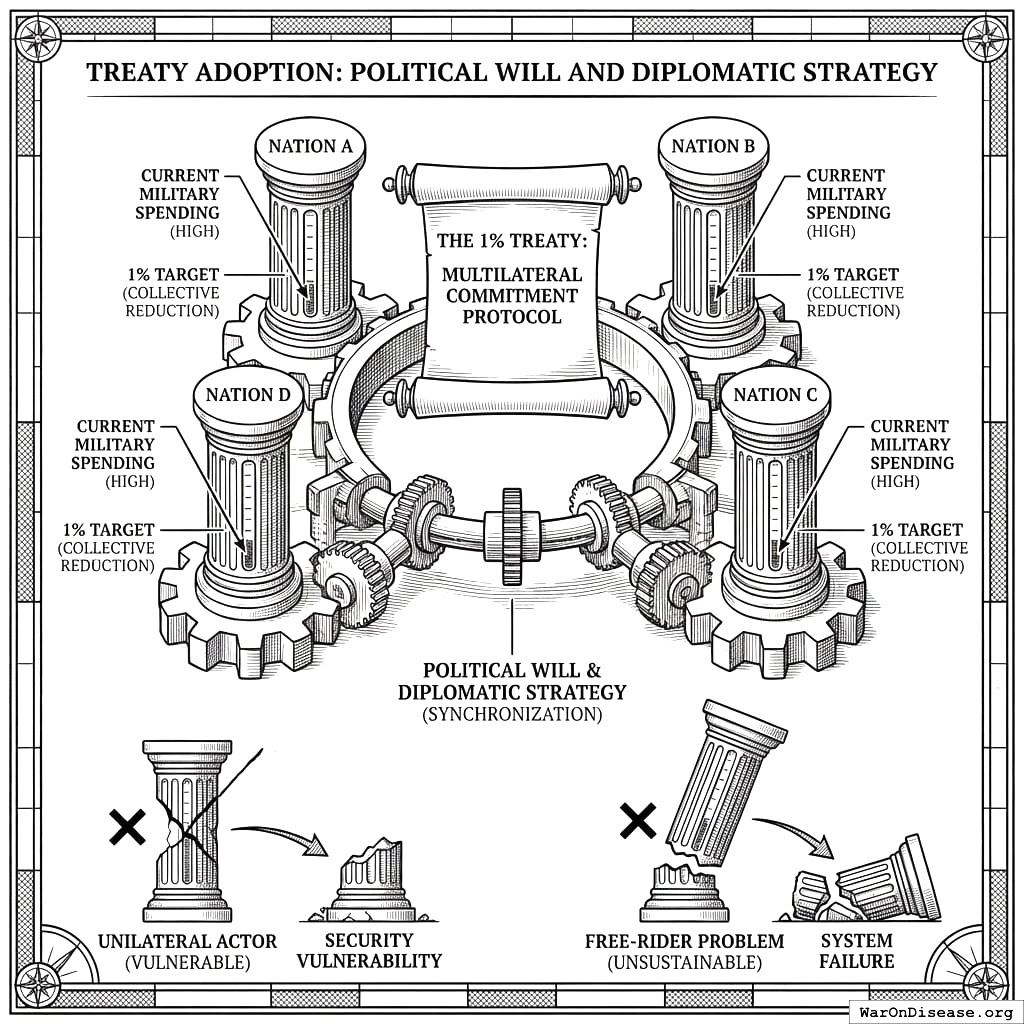
A 1% Treaty138: Proposed international agreement where signatory nations commit to reducing military expenditure by 1% and redirecting those funds ($27.2 billion globally) to pragmatic clinical trials infrastructure.
\[
\begin{gathered}
Funding_{treaty} \\
= Spending_{mil} \times Reduce_{treaty} \\
= \$2.72T \times 1\% \\
= \$27.2B
\end{gathered}
\]
A 1% Treaty Fund: The treasury that receives and allocates the 1% of military spending reallocated by the 1% Treaty. It funds pragmatic clinical trials, which can be implemented through participating providers.
Pragmatic Clinical Trial: Trial design using real-world settings and broad eligibility criteria rather than highly controlled laboratory conditions, improving generalizability and dramatically reducing costs. Examples: Oxford RECOVERY (COVID, 47,000 patients), PCORnet ADAPTABLE (cardiovascular, 15,076 patients), and 108+ trials documented in Harvard meta-analysis135.
Problem Statement
Current Resource Allocation
Humanity’s budget priorities, explained simply:
\[
\begin{gathered}
Ratio_{mil:gov} \\
= \frac{Spending_{mil}}{Spending_{trials,gov}} \\
= \frac{\$2.72T}{\$4.5B} \\
= 604
\end{gathered}
\]
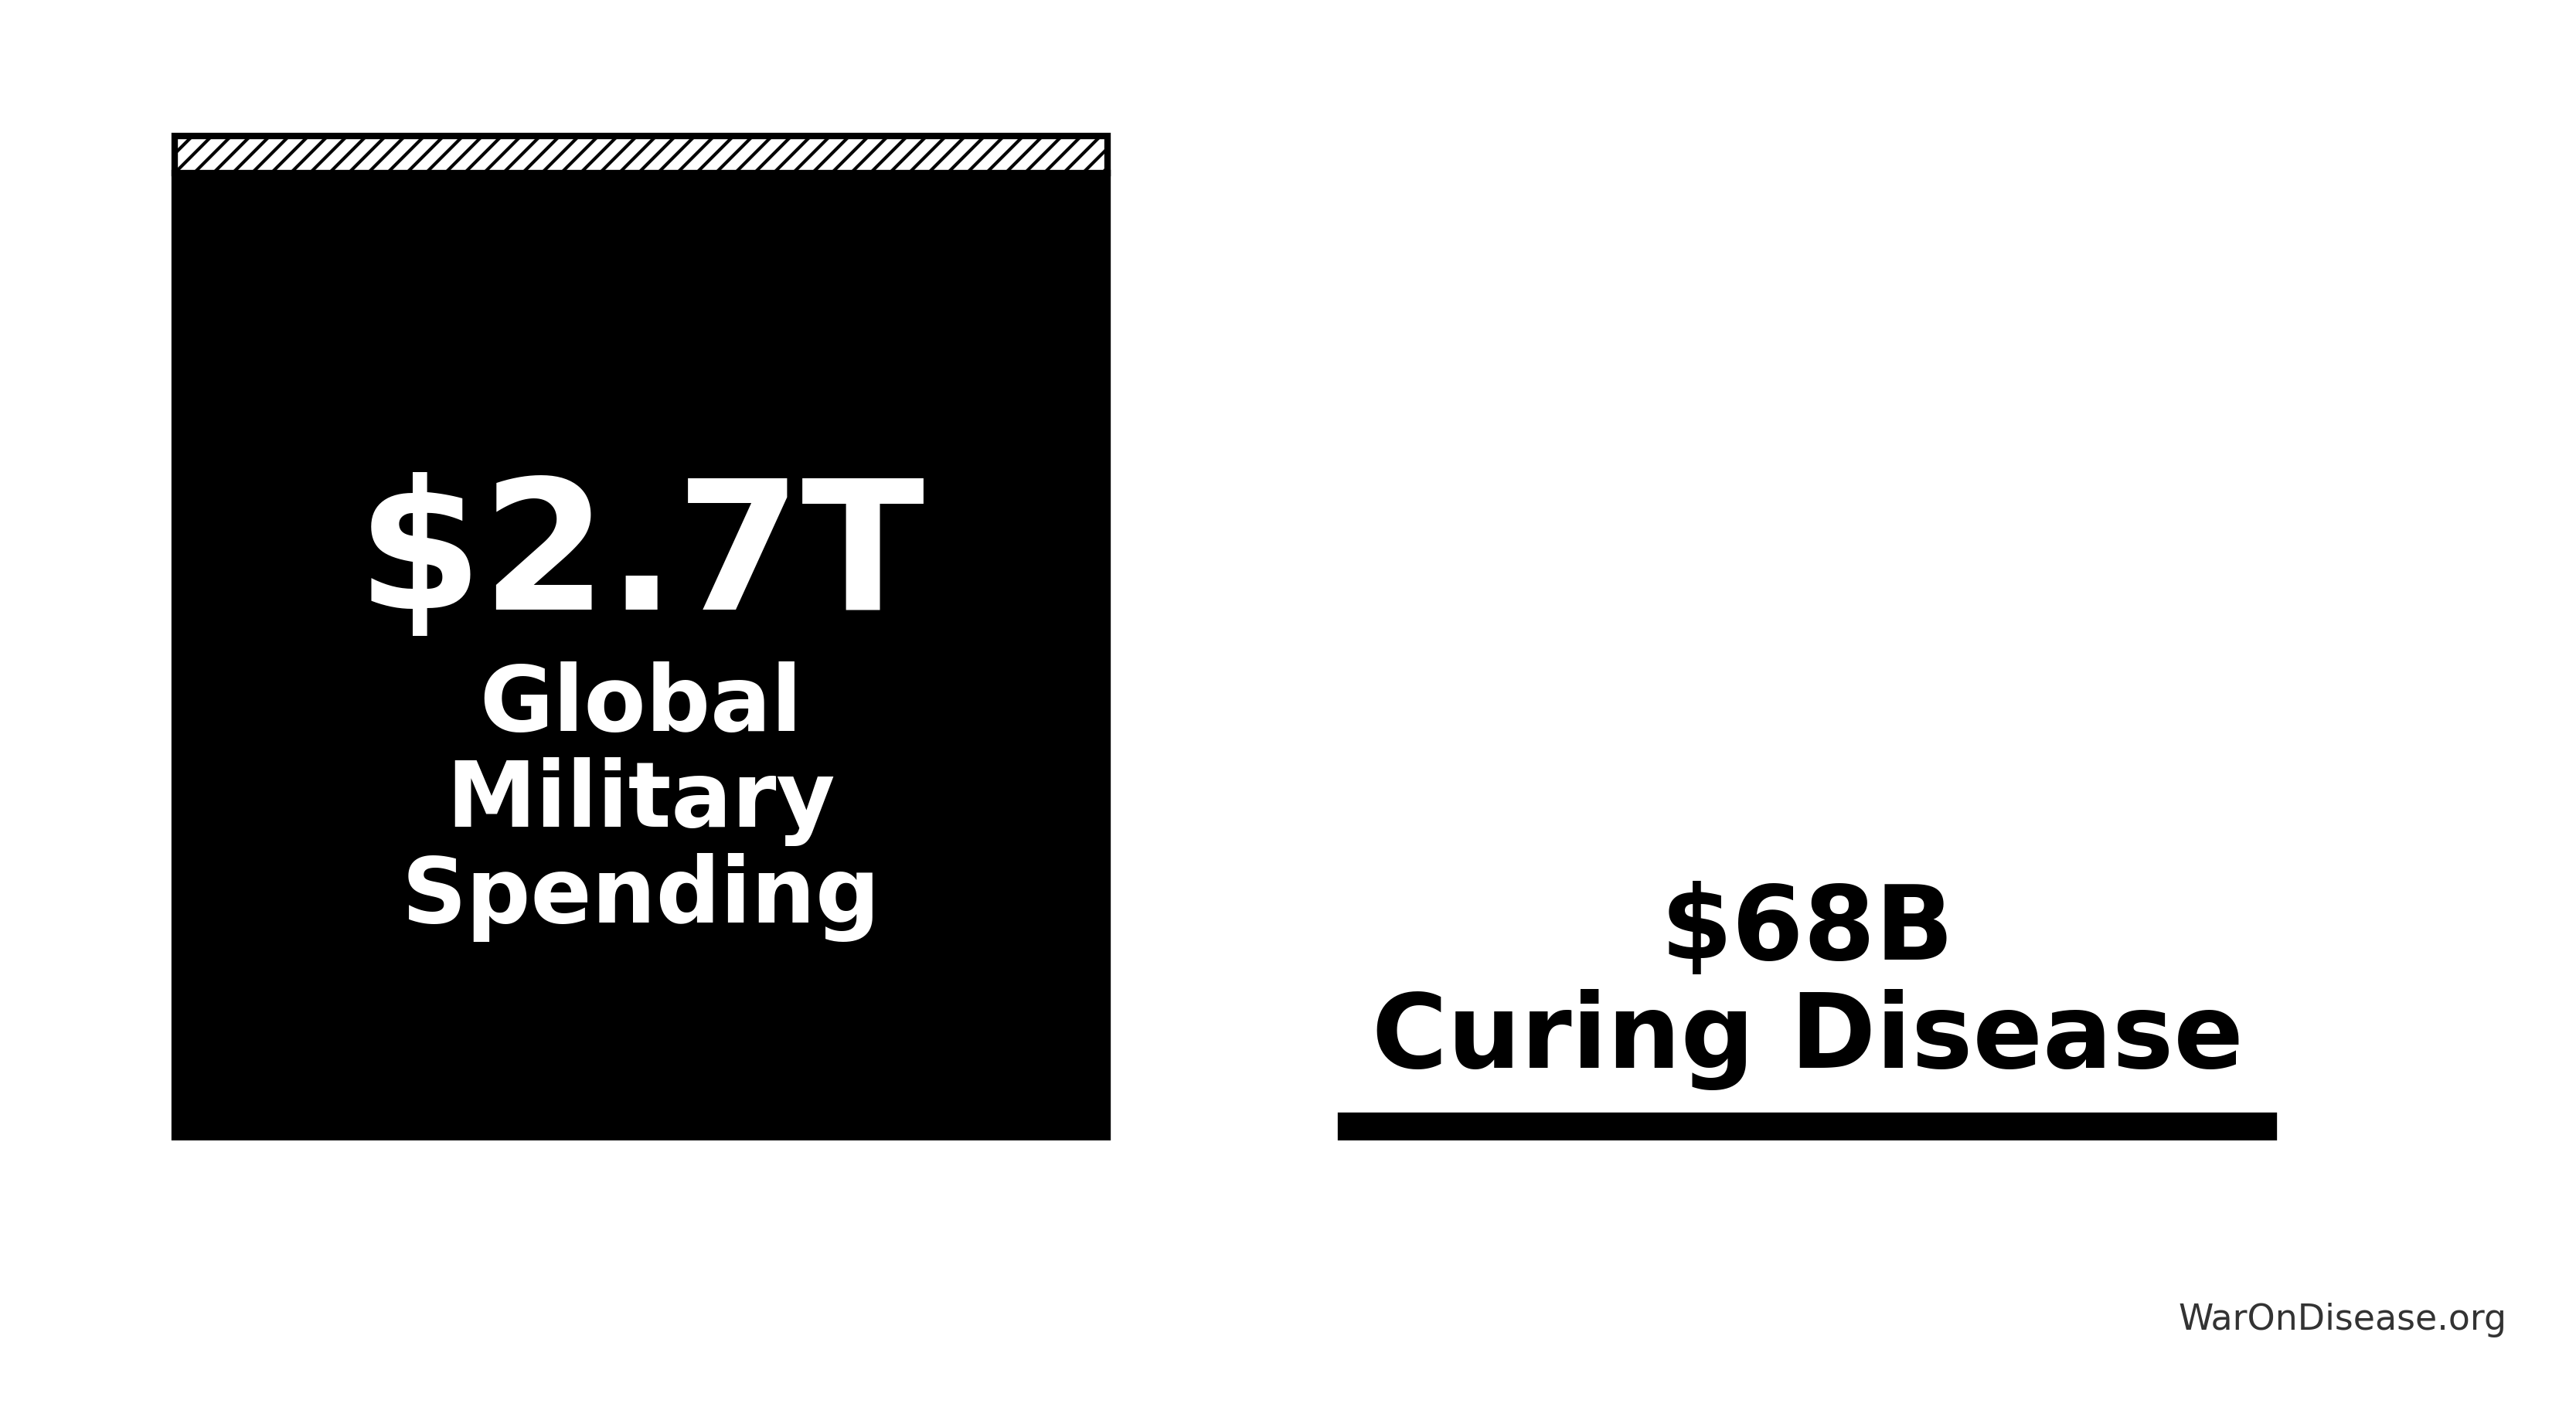
Understanding the comparison: While total government medical research spending is $67.5 billion (95% CI: $54 billion-$81 billion) (including basic research, translational research, and clinical trials), government clinical trial funding is only $4.5 billion (95% CI: $3 billion-$6 billion). The 1% Treaty redirects $27.2 billion to pragmatic clinical trials, increasing government clinical trial funding ~7-fold.
The bottleneck isn’t basic research or laboratory science. It’s clinical trials. We’ve tested 0.342% (90% CI: 0%-1%) of possible drug-disease combinations using existing safe compounds. Not because the science is impossible, but because traditional trials cost $41,000 (95% CI: $20,000-$120,000) while pragmatic trials like Oxford RECOVERY run for $500 (95% CI: $400-$2,500). At current funding levels, testing the remaining 99.7% (90% CI: 99%-100%) of therapeutic space would take millennia. Meanwhile, military budgets dwarf the funding needed to automate ubiquitous clinical trials and systematically explore what actually helps people.
Disease treatment vs. curing disease
\[
\begin{gathered}
Burden_{disease} \\
= DALYs_{global,ann} \times Pct_{avoid,DALY} \times Value_{QALY} \\
= 2.88B \times 92.6\% \times \$150K \\
= \$400T
\end{gathered}
\]
That’s 0.0164% (90% CI: 0.0116%-0.0264%) of the disease burden spent on actually fixing the problem:
\[
\begin{gathered}
Pct_{RD:burden} \\
= \frac{Spending_{RD}}{Cost_{health+war}} \\
= \frac{\$67.5B}{\$412T} \\
= 0.0164\%
\end{gathered}
\]
where:
\[
\begin{gathered}
Cost_{health+war} \\
= Cost_{war,total} + Burden_{disease} \\
= \$11.4T + \$400T \\
= \$412T
\end{gathered}
\]
where:
\[
\begin{gathered}
Cost_{war,total} \\
= Cost_{war,direct} + Cost_{war,indirect} \\
= \$7.66T + \$3.7T \\
= \$11.4T
\end{gathered}
\]
where:
\[
\begin{gathered}
Cost_{war,direct} \\
= Loss_{life,conflict} + Damage_{infra,total} \\
+ Disruption_{trade} + Spending_{mil} \\
= \$2.45T + \$1.88T + \$616B + \$2.72T \\
= \$7.66T
\end{gathered}
\]
where:
\[
\begin{gathered}
Loss_{life,conflict} \\
= Cost_{combat,human} + Cost_{state,human} \\
+ Cost_{terror,human} \\
= \$2.34T + \$27B + \$83B \\
= \$2.45T
\end{gathered}
\]
where:
\[
\begin{gathered}
Cost_{combat,human} \\
= Deaths_{combat} \times VSL \\
= 234{,}000 \times \$10M \\
= \$2.34T
\end{gathered}
\]
where:
\[
\begin{gathered}
Cost_{state,human} \\
= Deaths_{state} \times VSL \\
= 2{,}700 \times \$10M \\
= \$27B
\end{gathered}
\]
where:
\[
\begin{gathered}
Cost_{terror,human} \\
= Deaths_{terror} \times VSL \\
= 8{,}300 \times \$10M \\
= \$83B
\end{gathered}
\]
where:
\[
\begin{gathered}
Damage_{infra,total} \\
= Damage_{comms} + Damage_{edu} + Damage_{energy} \\
+ Damage_{health} + Damage_{transport} + Damage_{water} \\
= \$298B + \$234B + \$422B + \$166B + \$487B + \$268B \\
= \$1.88T
\end{gathered}
\]
where:
\[
\begin{gathered}
Disruption_{trade} \\
= Disruption_{currency} + Disruption_{energy} \\
+ Disruption_{shipping} + Disruption_{supply} \\
= \$57.4B + \$125B + \$247B + \$187B \\
= \$616B
\end{gathered}
\]
where:
\[
\begin{gathered}
Cost_{war,indirect} \\
= Damage_{env} + Loss_{growth,mil} + Loss_{capital,conflict} \\
+ Cost_{psych} + Cost_{refugee} + Cost_{vet} \\
= \$100B + \$2.72T + \$300B + \$232B + \$150B + \$200B \\
= \$3.7T
\end{gathered}
\]
where:
\[
\begin{gathered}
Burden_{disease} \\
= DALYs_{global,ann} \times Pct_{avoid,DALY} \times Value_{QALY} \\
= 2.88B \times 92.6\% \times \$150K \\
= \$400T
\end{gathered}
\]
Mortality and Morbidity Burden
The World Health Organization reports 150,000 daily deaths from disease and aging14. Many of these are eventually avoidable with accelerated biomedical progress (55 million deaths/year (90% CI: 46.6 million deaths/year-63.2 million deaths/year)).
This mortality burden exceeds:
\[
\begin{gathered}
Ratio_{dis:terror} \\
= \frac{Deaths_{curable,ann}}{Deaths_{9/11}} \\
= \frac{55M}{3{,}000} \\
= 18{,}400
\end{gathered}
\]
\[
\begin{gathered}
Ratio_{dis:war} \\
= \frac{Deaths_{curable,ann}}{Deaths_{conflict}} \\
= \frac{55M}{245{,}000} \\
= 225
\end{gathered}
\]
where:
\[
\begin{gathered}
Deaths_{conflict} \\
= Deaths_{combat} + Deaths_{state} + Deaths_{terror} \\
= 234{,}000 + 2{,}700 + 8{,}300 \\
= 245{,}000
\end{gathered}
\]
Despite this disparity in mortality burden, resource allocation heavily favors security spending over medical research and curative interventions.
How It Works
The mechanism is financial, not bureaucratic:
- Patient subsidies: Most treaty funding ($21.7 billion) goes directly to subsidizing patient participation in trials at ~$929 (95% CI: $97-$3,000)1 per patient, similar to how insurance covers medical procedures
- Providers get paid: Treatment providers can charge for patient participation in trials, making trials profitable rather than costly
- Easy enrollment: The trial protocol’s infrastructure (costing $40 million (90% CI: $33.5 million-$47.1 million)/year) makes it easy for anyone to create or join Phase 2/3/4 trials globally
- Patient choice: Patients choose which trials to join; their subsidy follows them. Trials that attract patients get funded.
The mechanism makes trial participation financially attractive for both patients and providers while streamlining evidence collection through existing healthcare delivery infrastructure.
How Embedded Pragmatic Trials Generate Evidence
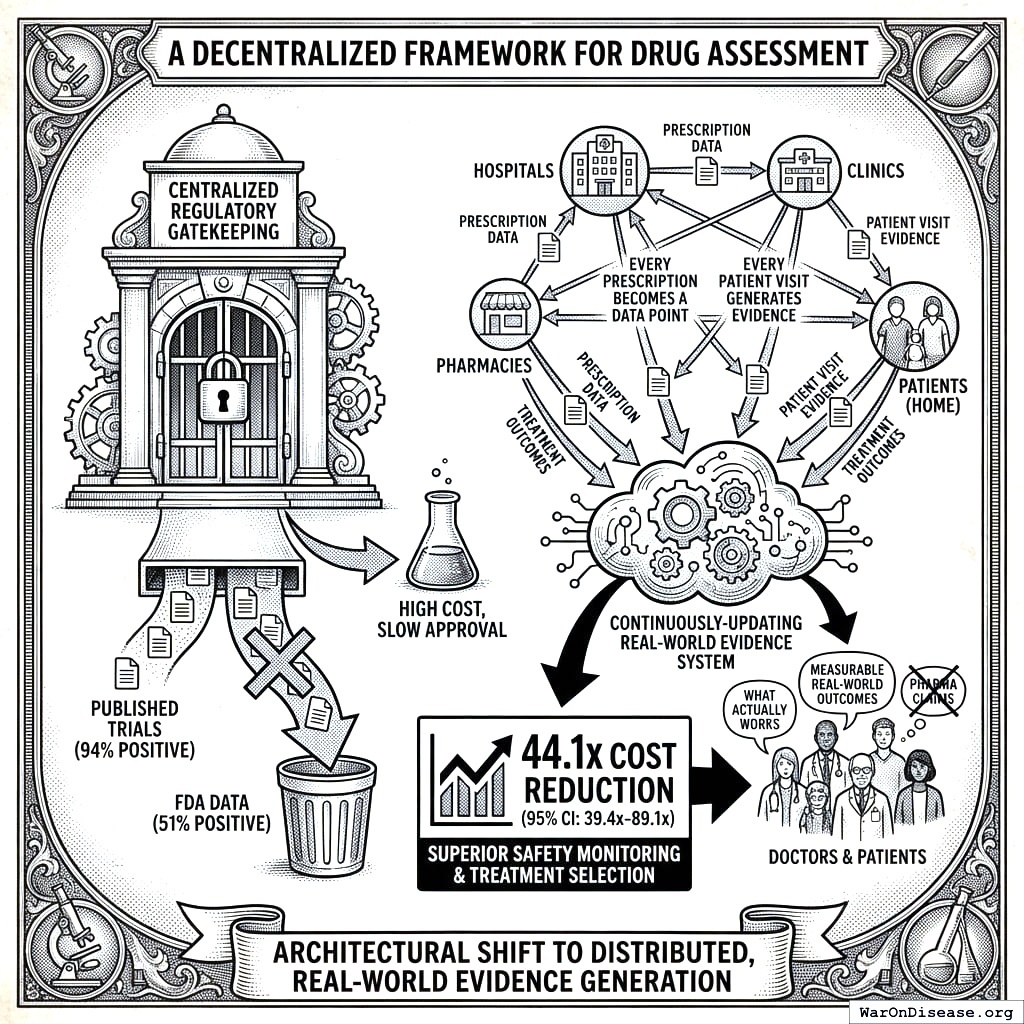
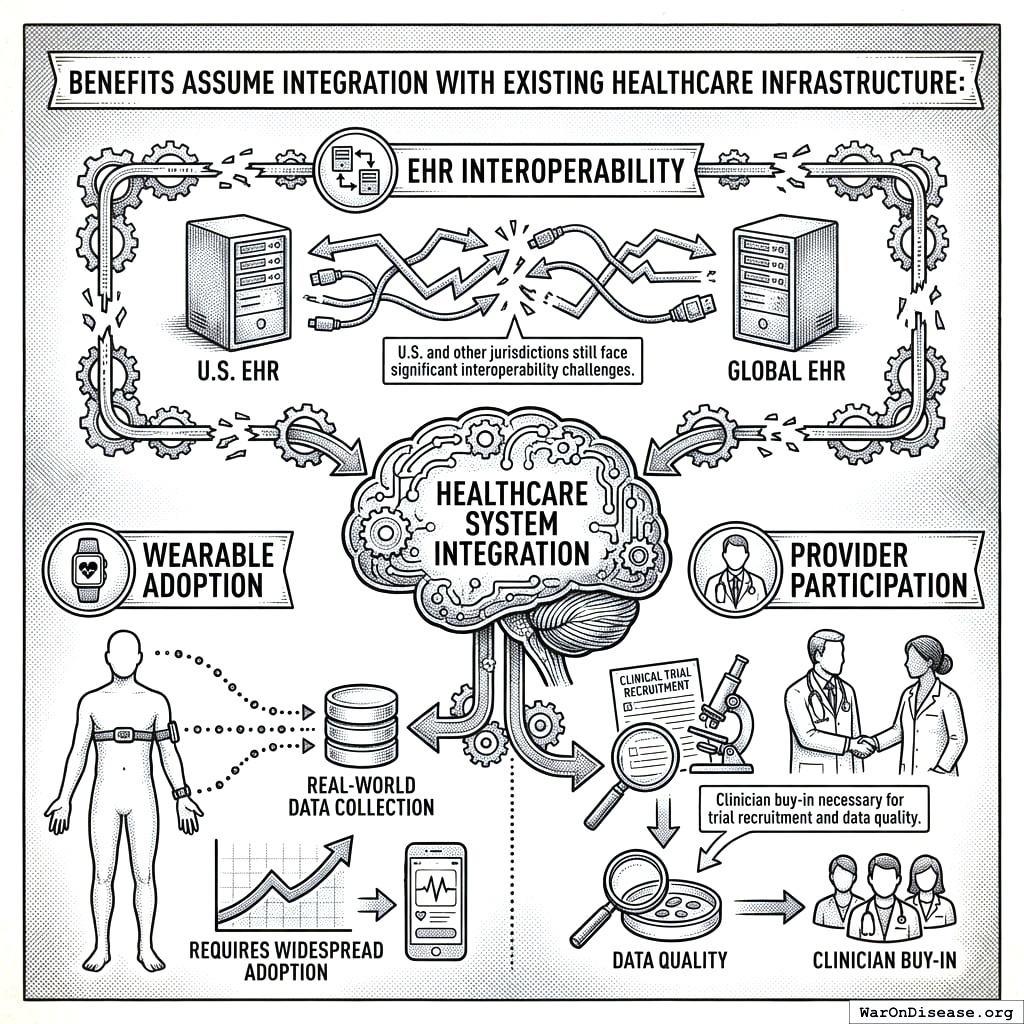
The economic model assumes integration of pragmatic trial infrastructure into standard healthcare delivery. Every prescription becomes a data point. Every patient visit generates evidence. Every treatment outcome feeds into a continuously-updating system that tells doctors and patients what actually works. Not what pharmaceutical companies claim works (published trials show 94% positive results while FDA data shows only 51%140), but what measurably happens to real humans taking real treatments.
This architectural shift from centralized regulatory gatekeeping to distributed, real-world evidence generation achieves a 44.1x (90% CI: 12.8x-210x) cost reduction while providing superior safety monitoring and treatment selection capabilities.
\[
\begin{gathered}
k_{reduce} \\
= \frac{Cost_{P3,pt}}{Cost_{pragmatic,pt}} \\
= \frac{\$41K}{\$929} \\
= 44.1
\end{gathered}
\]
Trial Cost Reduction
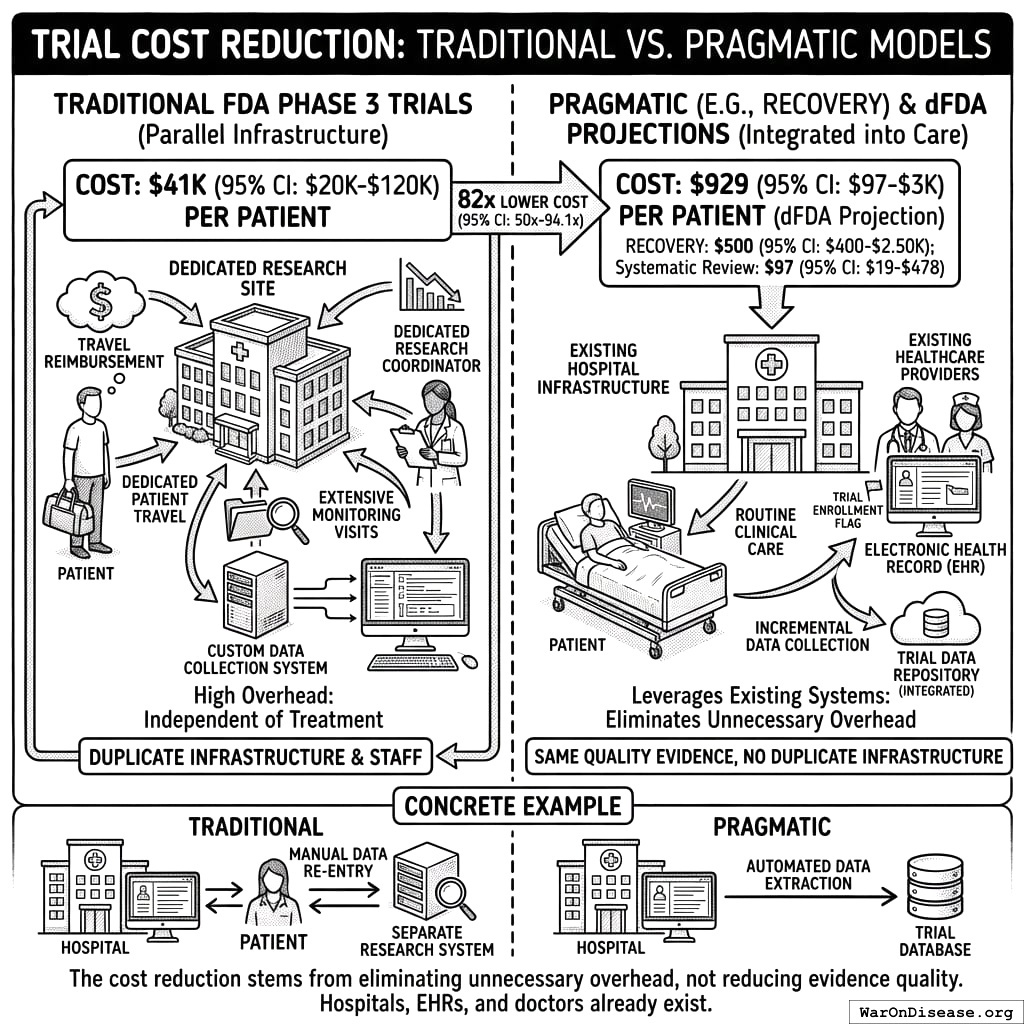
Traditional FDA Phase 3 trials cost $41,000 (95% CI: $20,000-$120,000)110 per patient because they require dedicated infrastructure: specialized research sites, dedicated research coordinators, custom data collection systems, patient travel reimbursement, and extensive monitoring visits. This overhead exists independent of the actual treatment being tested.
The Oxford RECOVERY trial demonstrated an alternative: use existing hospital infrastructure, collect only incremental data beyond standard medical records, and integrate evidence generation into routine clinical care. Cost: $500 (95% CI: $400-$2,500)101 per patient. (Note: RECOVERY benefited from NHS/COVID conditions; however, a systematic review of 64 pragmatic trials found a median cost of $97 (95% CI: $19-$478)/patient94, confirming this efficiency is replicable. Our system projections use a conservative $929 (95% CI: $97-$3,000)/patient based on the ADAPTABLE trial.) Same quality evidence. 82x (90% CI: 21.4x-195x) lower cost.
Concrete example: A hospital already tracks patient lab results, symptoms, and outcomes in electronic health records. Traditional trials build a parallel research infrastructure to collect the same information again. Pragmatic trials simply flag which patients are enrolled and automatically extract relevant data from existing systems. No duplicate infrastructure, no dedicated research staff per trial.
The cost reduction stems from eliminating unnecessary overhead, not reducing evidence quality. Hospitals already exist. Electronic health records already exist. Doctors already see patients. The trial infrastructure simply uses what’s already there rather than building dedicated research facilities.
\[
\begin{gathered}
k_{RECOVERY} \\
= \frac{Cost_{P3,pt}}{Cost_{RECOVERY,pt}} \\
= \frac{\$41K}{\$500} \\
= 82
\end{gathered}
\]
Enhanced Safety Monitoring
Current system limitations: If a drug causes liver damage in 1% of patients, this pattern often goes undetected until 100,000+ prescriptions have been written, because adverse event reporting is voluntary. Doctors must notice the problem, remember to file a report, and complete the paperwork. Average reporting rate approximately 6%141, meaning ~94% of adverse events go unreported.
Concrete failure case: Rofecoxib (Vioxx)142, approved in 1999 for arthritis pain, increased cardiovascular event risk (heart attacks and strokes) through COX-2 enzyme inhibition. The cardiovascular signal went undetected for 5 years despite 92.8 million U.S. prescriptions (1999-2003)142. Voluntary adverse event reporting failed to identify the pattern until dedicated post-market studies confirmed the association in 2004, leading to withdrawal. Estimates of deaths from the delay range from 38,000 (Lancet) to 55,000 (FDA testimony)142. Integrated surveillance alternative: Every prescription automatically becomes a tracked data point. When patients experience cardiovascular events, get lab tests, or visit emergency rooms, the system captures these outcomes via existing EHR infrastructure. No extra paperwork required. Like credit card fraud detection systems that identify suspicious patterns across millions of transactions in real-time, integrated health systems can detect treatment-associated adverse events across millions of patients automatically.
The system automatically aggregates outcomes:
- 10,000 patients prescribed Drug X → System tracks all subsequent cardiovascular events, ER visits, lab results, and hospitalizations via existing EHR infrastructure
- 120 patients (1.2%) show elevated cardiovascular event rates within 90 days → Automated statistical flag triggers when pattern exceeds expected background rate for matched controls
- Pattern detected after 5,000 prescriptions → Public alert issued to all prescribing physicians and patients, rather than waiting for years and dedicated post-market studies
- Mass notification system → All patients currently taking the drug receive automated alerts through patient portals, enabling immediate clinical review and alternative treatment consideration
This infrastructure is not hypothetical. FDA’s Sentinel System143 already answers drug safety questions using claims and dispensing data from more than 100 million people144, with similar distributed data methodology. The proposed system makes this the default infrastructure for all treatments from day one, rather than a separate monitoring program activated only after problems are suspected. This represents a fundamental safety improvement: continuous, automated, population-scale adverse event detection with immediate mass notification capability, rather than relying on voluntary physician reporting (which captures only ~6% of actual adverse events)141 and slow manual review processes.
Comparative Effectiveness Rankings
Current decision-making: Doctor prescribes treatments based on pharmaceutical marketing, medical school training from years ago, and whatever clinical experiences they happen to remember. Patient has no access to comparative effectiveness data.
Evidence-based alternative: Doctor searches “rheumatoid arthritis treatment” in the integrated evidence system, sees treatments ranked by measured effectiveness in real-world patients:
Rankings show frequency and magnitude of outcome changes across actual patient populations. Filters allow stratification: “Show me effectiveness in women over 50 with my patient’s genetic markers and comorbidities.” This precision medicine approach shows what works for patients like yours, not what works on average across everyone.
Like Amazon rankings based on verified purchase reviews, except based on measured clinical outcomes rather than subjective opinions, and stratified by patient characteristics rather than averaged across all users.
Implementation: The system already has prescription records and outcome data from routine care. Ranking is just aggregation and sorting. No new data collection needed, just making existing data actually useful for treatment decisions.
How Comparative Effectiveness Data Is Collected
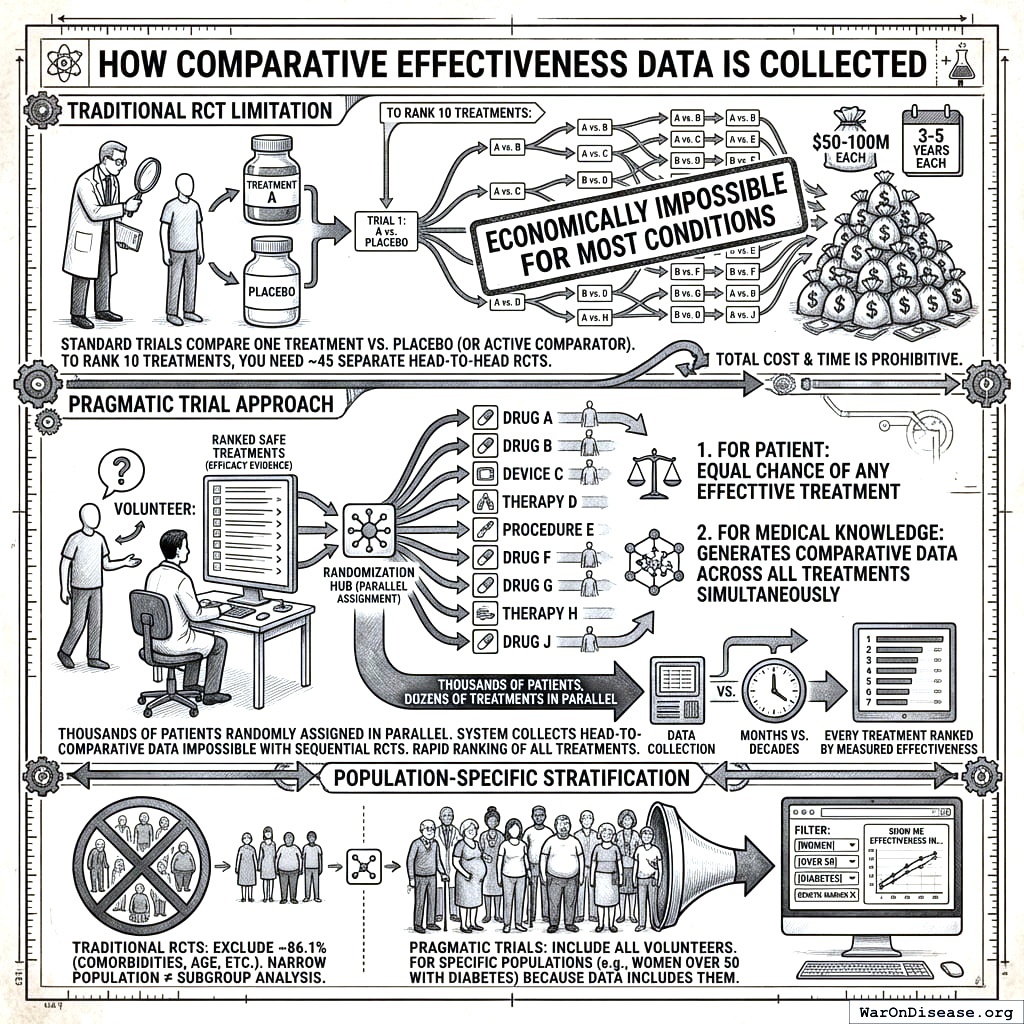
Traditional RCT limitation: Standard trials compare one treatment vs. placebo (or occasionally one active comparator). To rank 10 treatments for a condition, you would need ~45 separate head-to-head RCTs, each costing $50-100M and taking 3-5 years. This is economically impossible for most conditions.
Pragmatic trial approach: When a patient volunteers for treatment of their condition, physicians access a ranked list of all safe treatments with demonstrated or theoretical efficacy based on existing evidence. The patient is then randomly assigned to one of these treatment options. This randomization serves dual purposes:
- For the patient: Equal chance of receiving any potentially effective treatment
- For medical knowledge: Generates comparative effectiveness data across all treatments simultaneously
Because thousands of patients are randomly assigned across dozens of treatments in parallel, the system collects head-to-head comparative data that would be impossible to generate through sequential RCTs. Within months rather than decades, every treatment can be ranked by measured effectiveness.
Population-specific stratification: RCTs typically exclude 86.1% of patients due to comorbidities, age, or concurrent medications. The narrow populations that qualify cannot support subgroup analysis. Pragmatic trials include all volunteers, generating data on “women over 50 with diabetes” or “patients with genetic marker X.” The filter capability shown above (“Show me effectiveness in women over 50 with my patient’s genetic markers”) is only possible because the underlying data includes those populations.
Outcome Labels
Current drug information: 40-page package inserts written by lawyers, listing every possible side effect without quantifying frequencies. Patients have no idea whether “may cause headaches” means 0.1% or 50% of users.
Standardized outcome labels: Quantified summaries of what actually happens to patients taking each treatment, displayed like nutrition labels:
Based on systematic outcome collection across thousands of patients, labels show:
- Quantified benefits: “Memory improved 35%, Executive Function improved 22%”
- Adverse effect frequencies: “Headache: 9% (8% mild, 1% severe); Fatigue: 7%”
- Treatment persistence: “2.3% discontinued due to side effects”
- Sample size and confidence: “Based on 4,200 patients, 95% CI”
This is measured data from actual patient outcomes, not marketing claims or lawyer-drafted disclaimers.
Implementation workflow: 1. Patient prescribed new treatment → Automatically enrolled in outcome tracking 2. Patient reports symptoms at routine visits → Data flows into aggregation system 3. Lab results, ER visits, prescription refills → Automatically captured from electronic health records 4. System aggregates outcomes across all patients taking that treatment → Updates outcome label in real-time 5. Next doctor/patient looking at that treatment sees current evidence, not 5-year-old clinical trial results
No extra paperwork. No dedicated research staff. Just making routine clinical data actually useful for evidence generation.
Summary of Results
439 (90% CI: 321-600):1 to 84.8 million (90% CI: 39.6 million-194 million):1 ROI
Total Economic Value
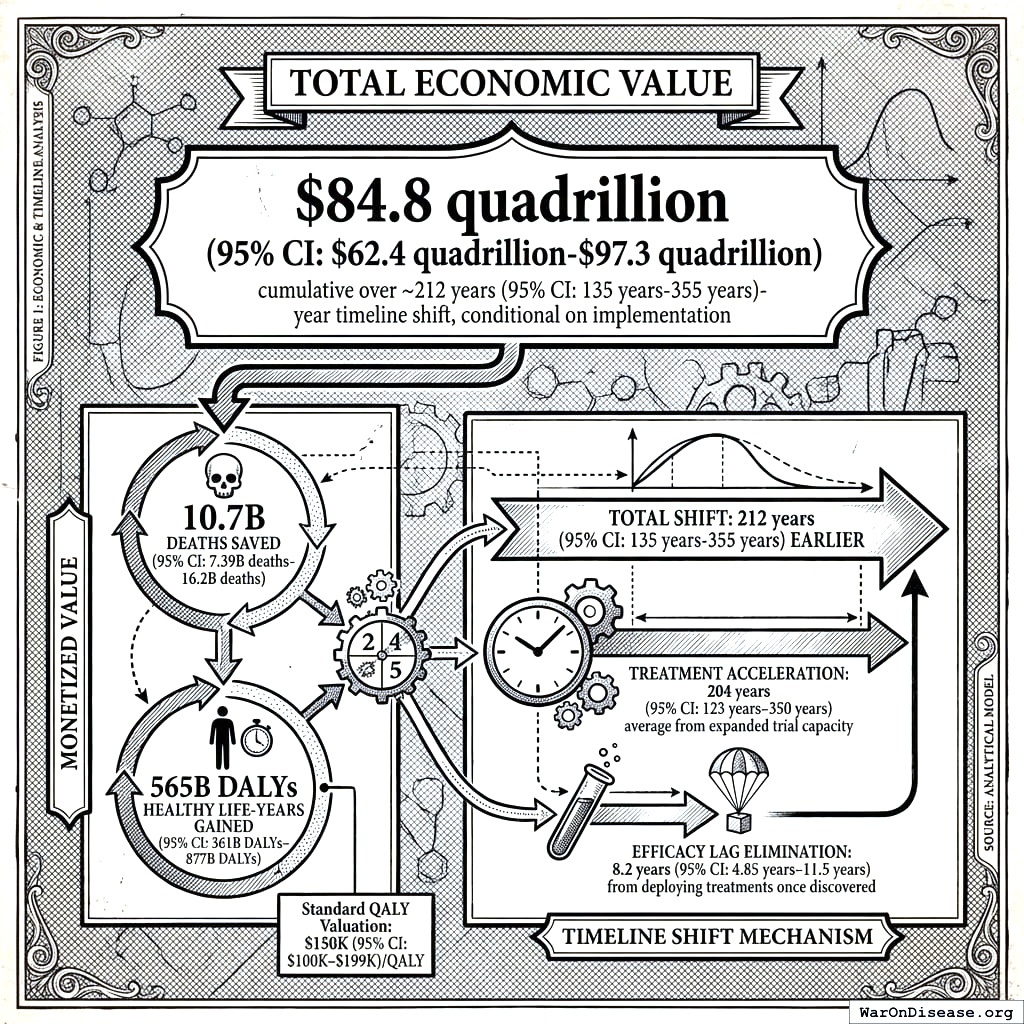
$84.8 quadrillion (90% CI: $42.9 quadrillion-$172 quadrillion) in total economic value (cumulative over ~212 years (90% CI: 124 years-398 years) timeline shift, conditional on implementation).
This is the monetized value of 10.7 billion deaths (90% CI: 6.24 billion deaths-20.3 billion deaths) saved and 565 billion healthy life-years gained, using standard QALY valuation ($150,000 (90% CI: $100,384-$198,679)/QALY). On average, first treatments become available 212 years (90% CI: 124 years-398 years) earlier - combining treatment acceleration (204 years (90% CI: 116 years-390 years) average from expanded trial capacity) and efficacy lag elimination (8.2 years (90% CI: 4.84 years-11.5 years) from deploying treatments once discovered).
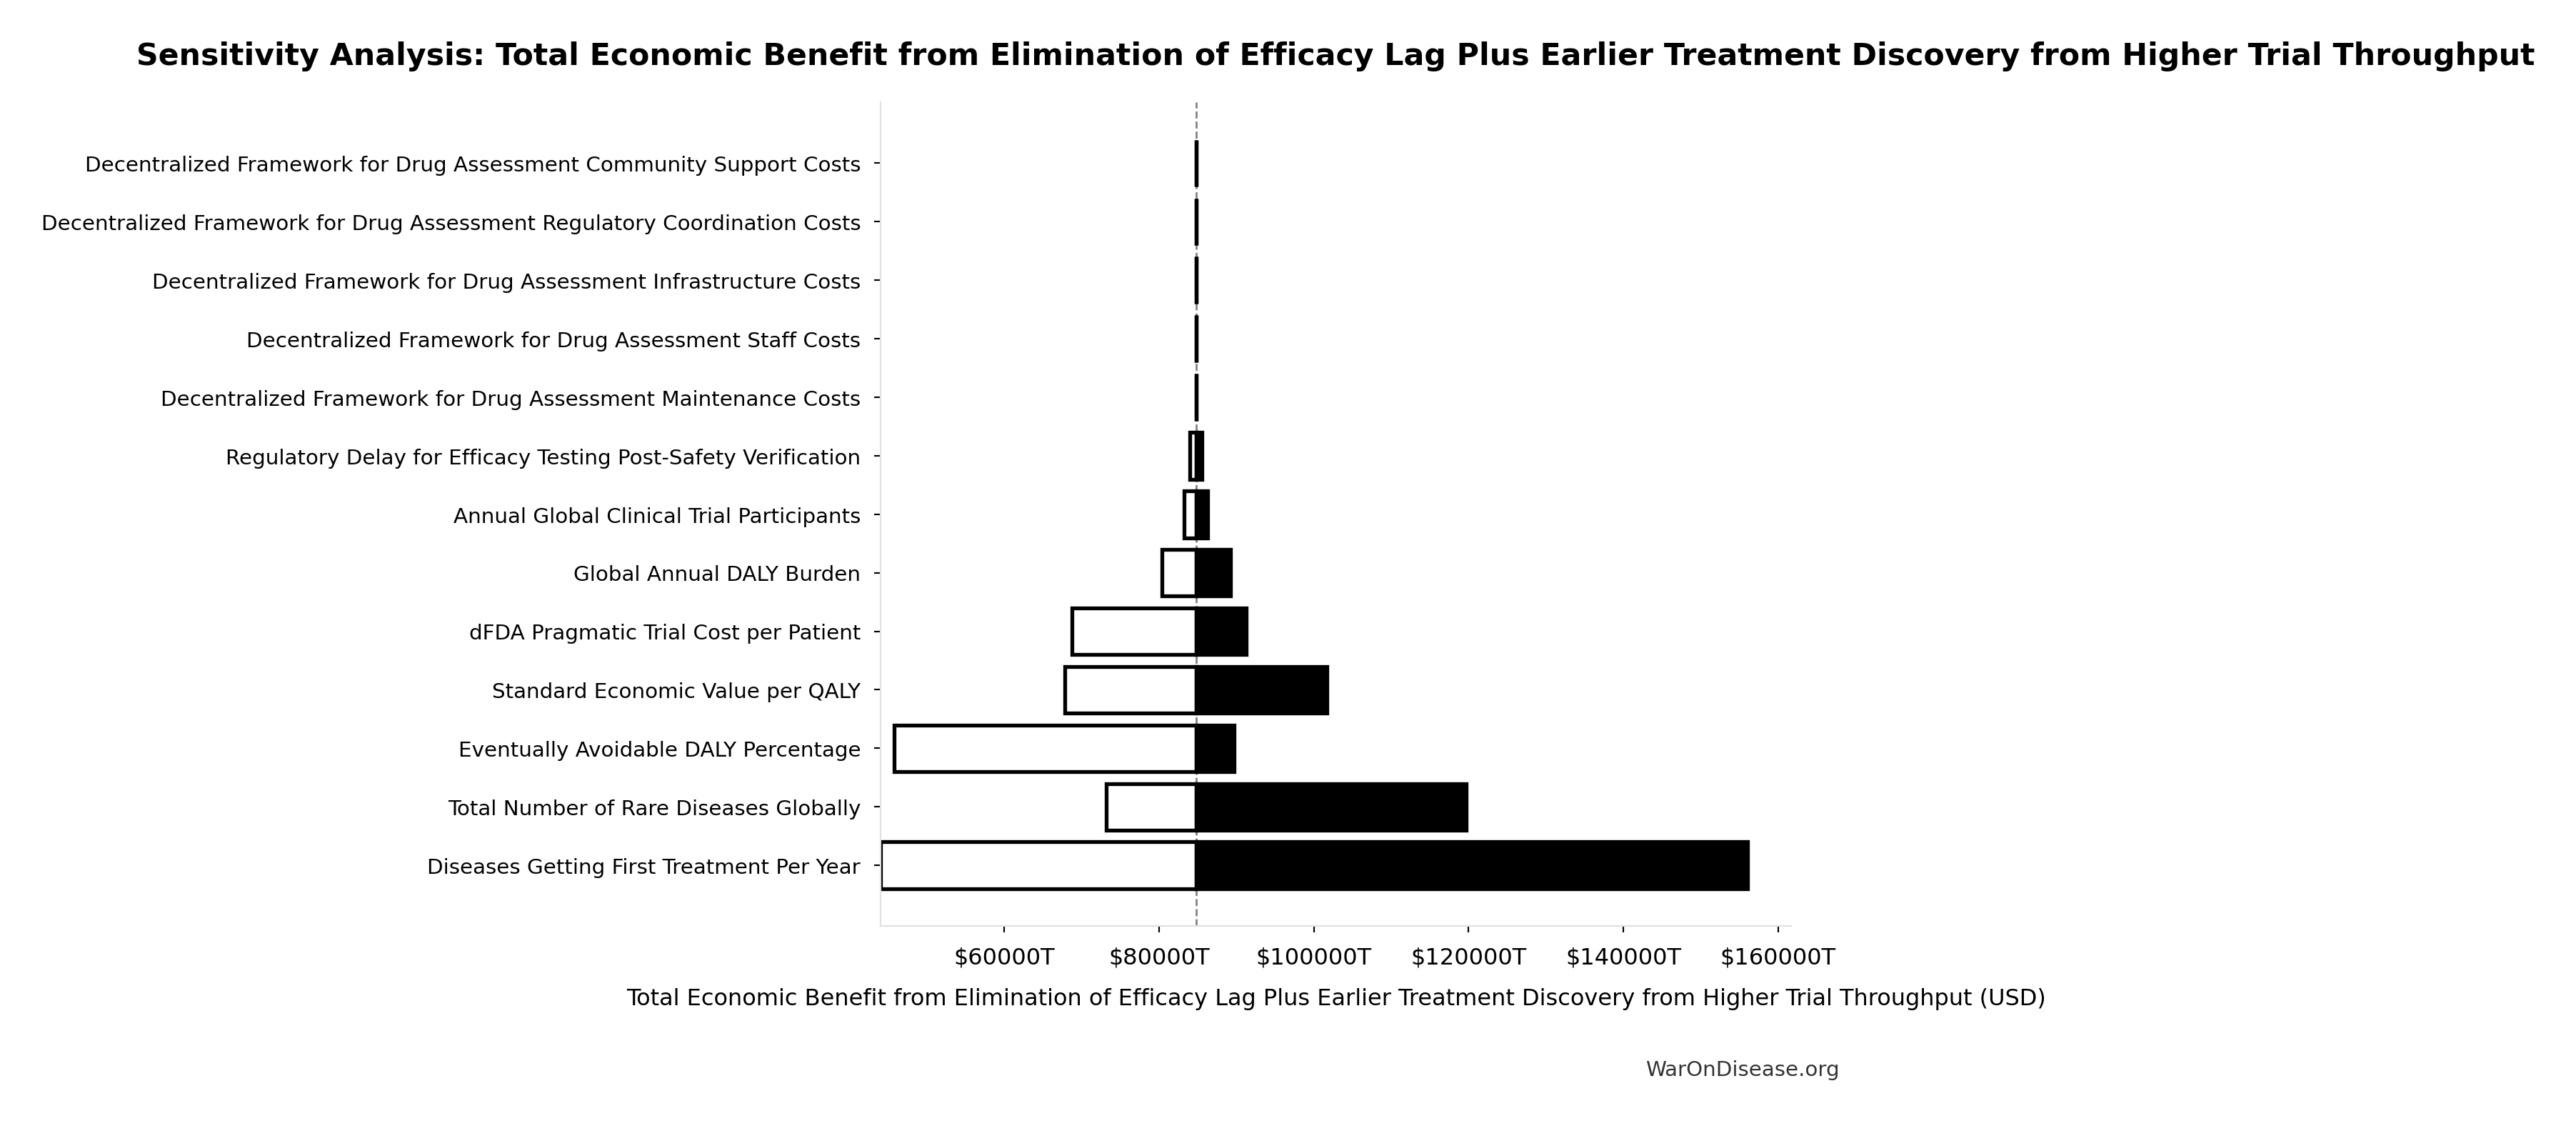
Uncertainty Analysis: Total Economic Value
The tornado diagram shows that timeline shift duration and QALY valuation dominate the uncertainty in total economic value. Even under conservative parameter assumptions, the intervention generates quadrillions in cumulative economic value over the timeline shift period (not annually).
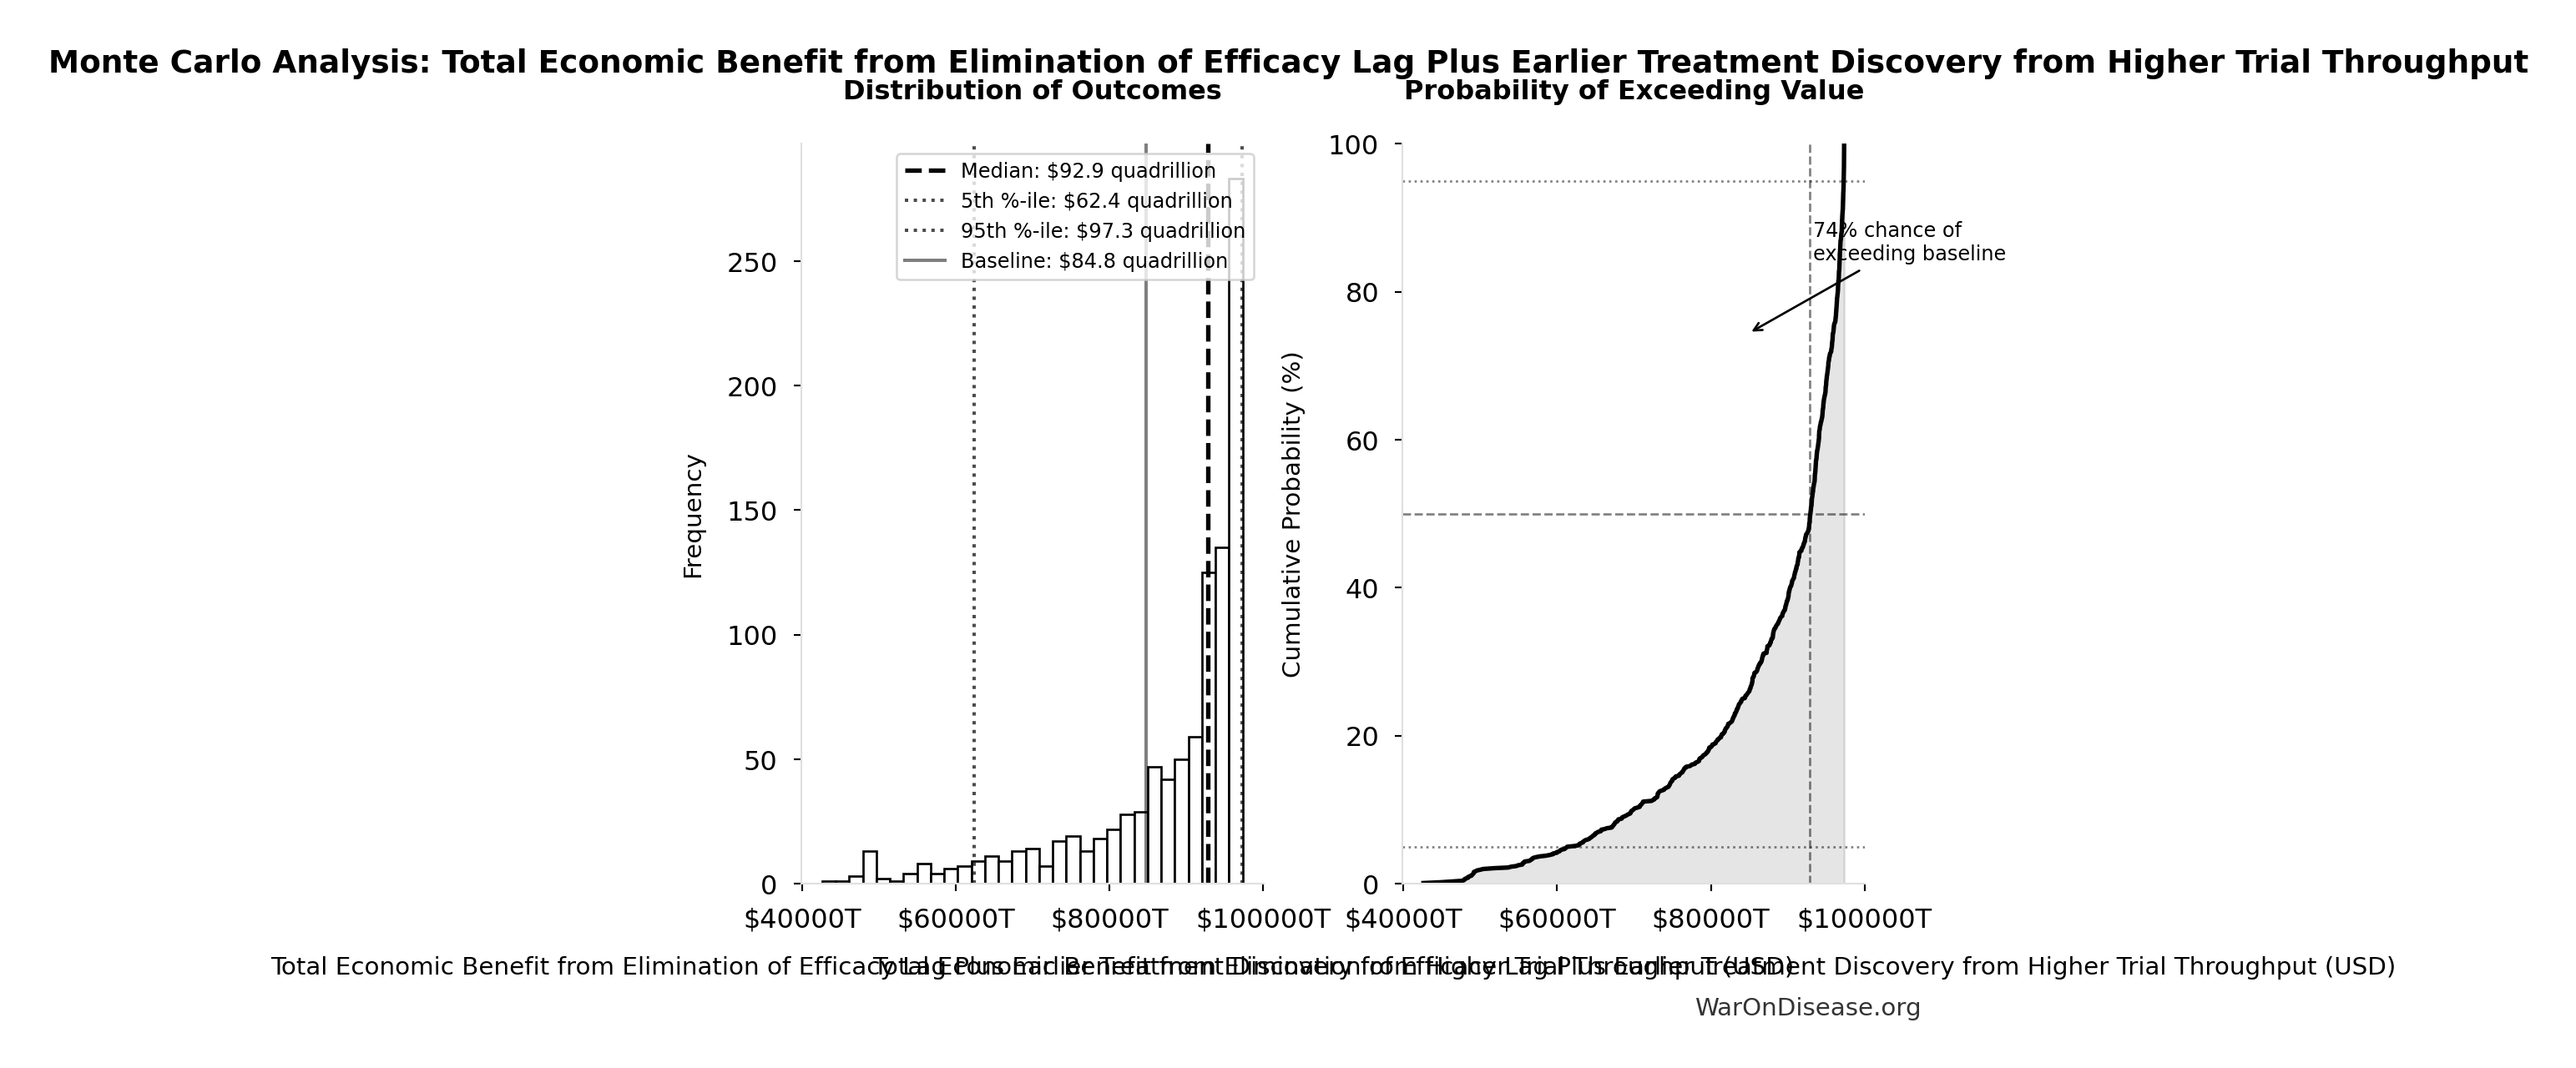
Simulation Results Summary: Total Economic Benefit from Elimination of Efficacy Lag Plus Earlier Treatment Discovery from Higher Trial Throughput
| Baseline (deterministic) |
$84.8 quadrillion |
| Mean (expected value) |
$95 quadrillion |
| Median (50th percentile) |
$88 quadrillion |
| Standard Deviation |
$40.2 quadrillion |
| 90% Range (5th-95th percentile) |
[$42.9 quadrillion, $172 quadrillion] |
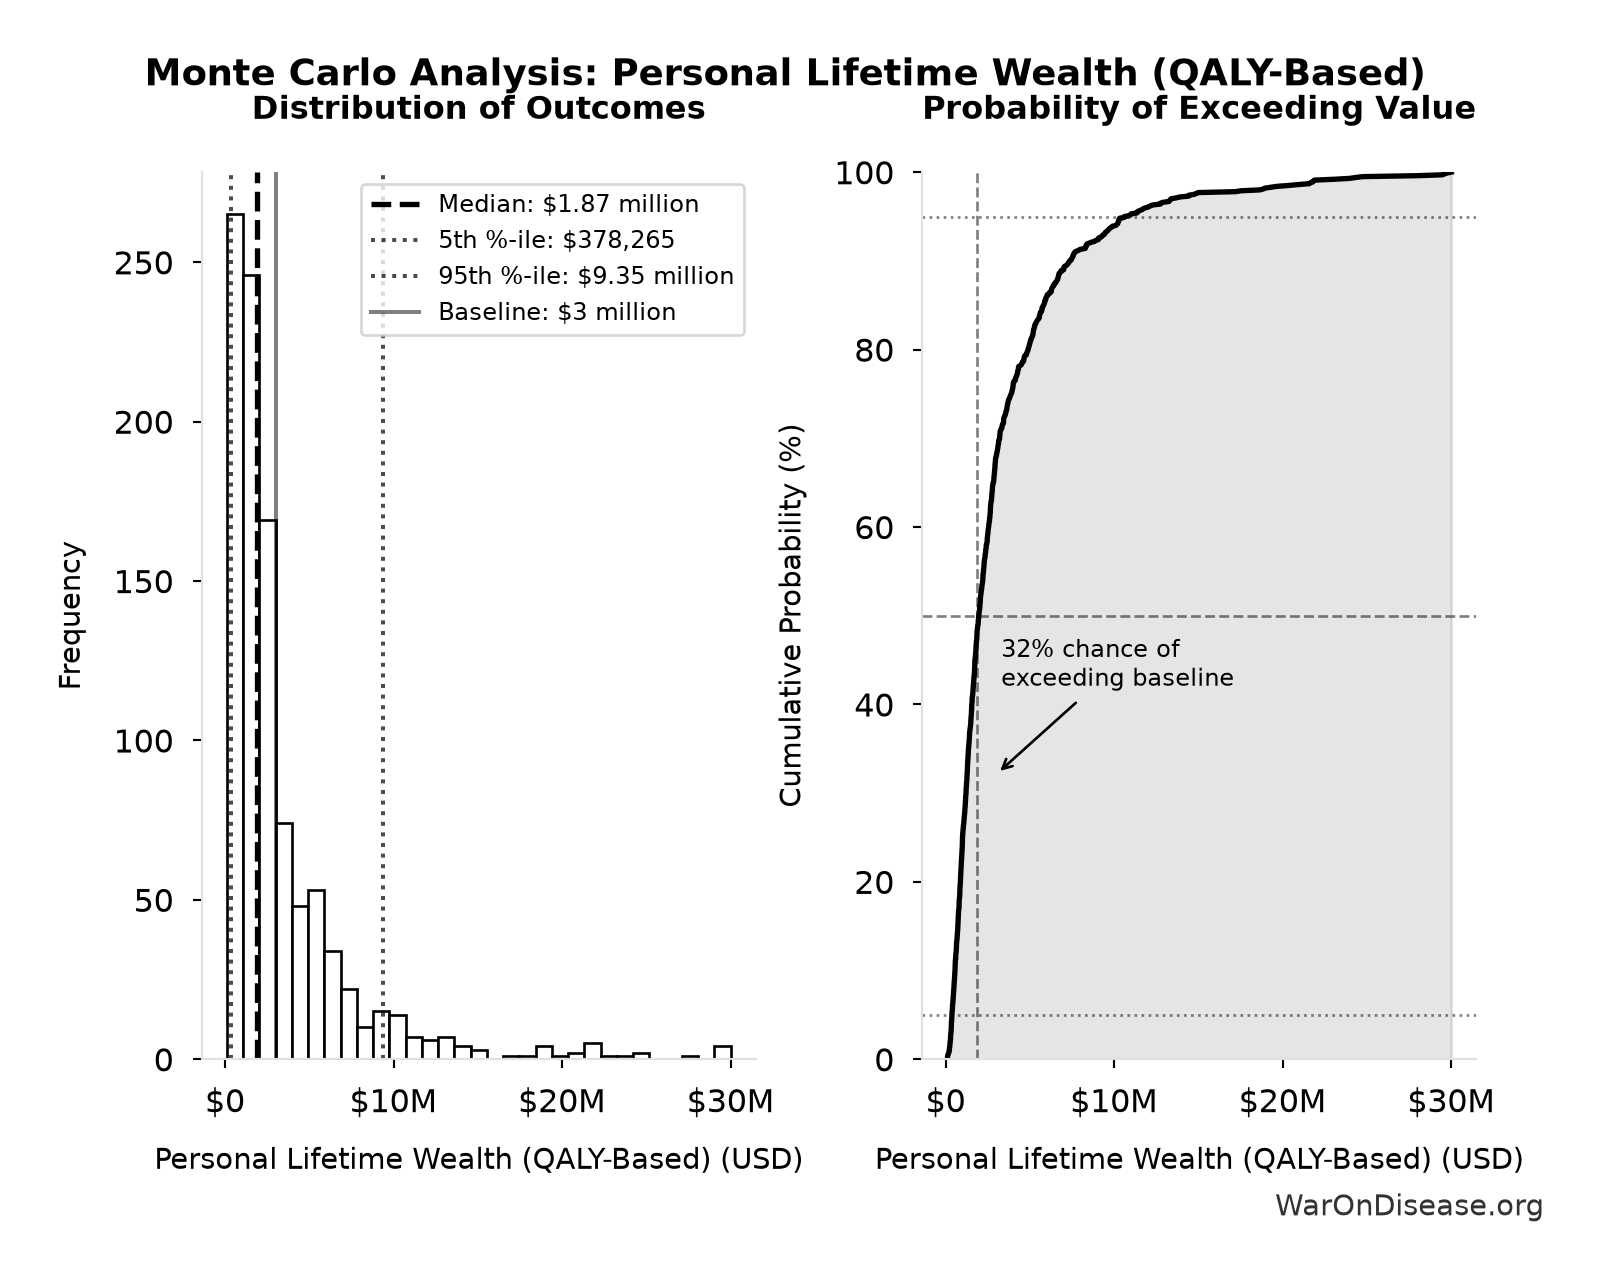
The histogram shows 1,000 of the 10,000 Monte Carlo draws for Total Economic Benefit from Elimination of Efficacy Lag Plus Earlier Treatment Discovery from Higher Trial Throughput; the summary statistics use all 10,000. The exceedance curve (right) shows the probability of the outcome exceeding any given value.
Monte Carlo analysis confirms the 95% confidence interval for total economic value remains in the quadrillions across all plausible scenarios. These are cumulative values representing accelerated access to treatments over ~212 years (90% CI: 124 years-398 years), not annual benefits.
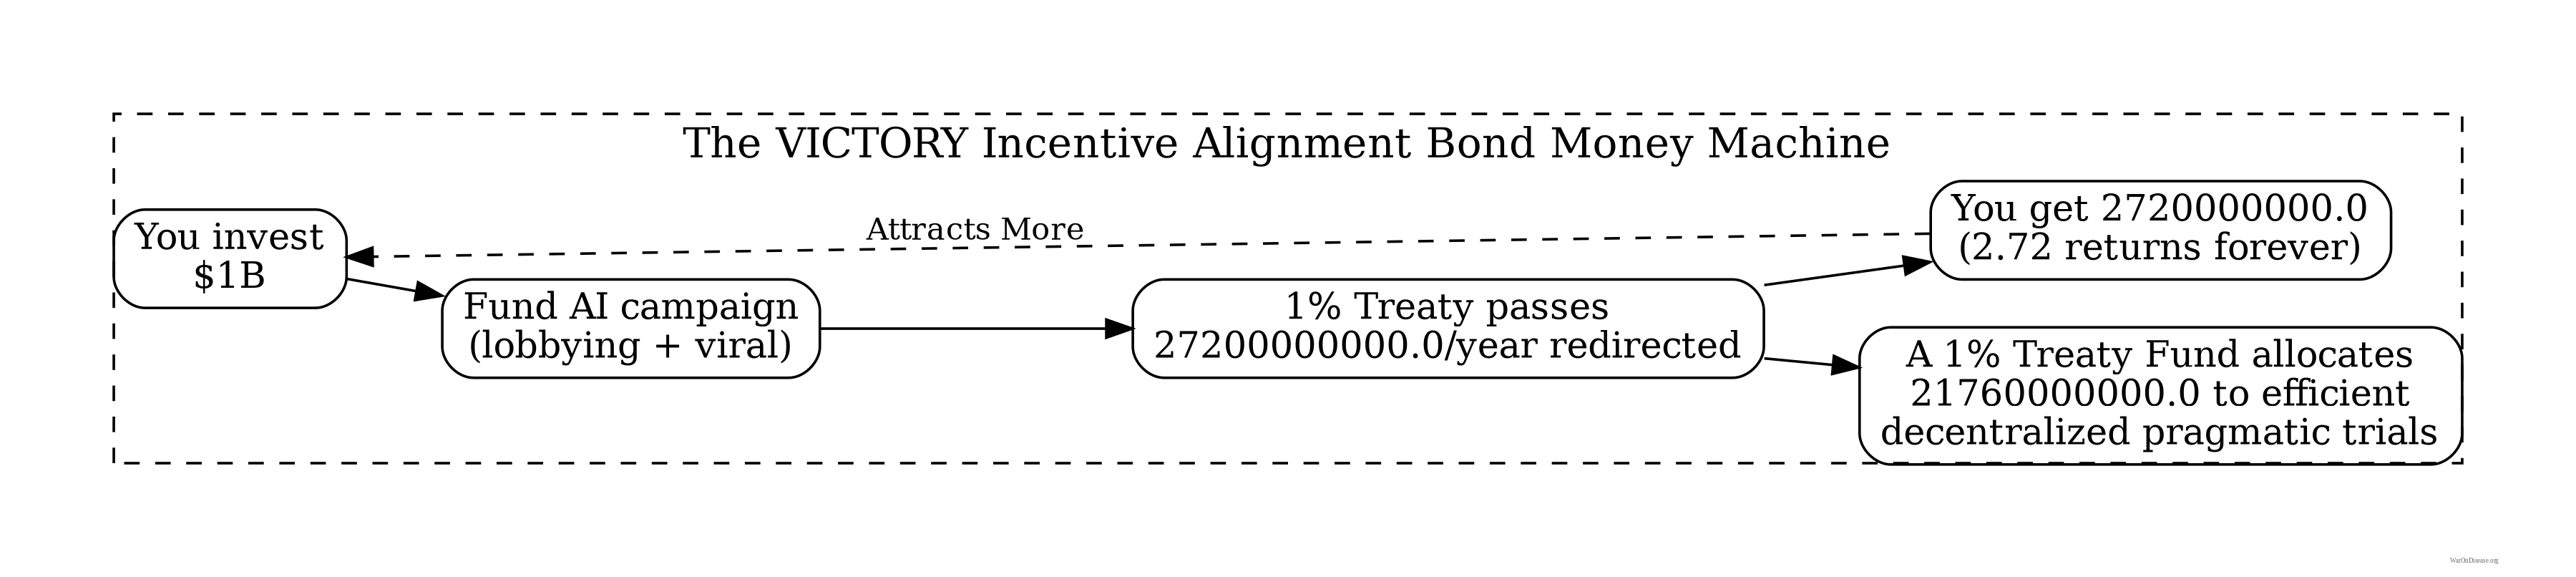
Investment required: $1 billion
Lives Saved
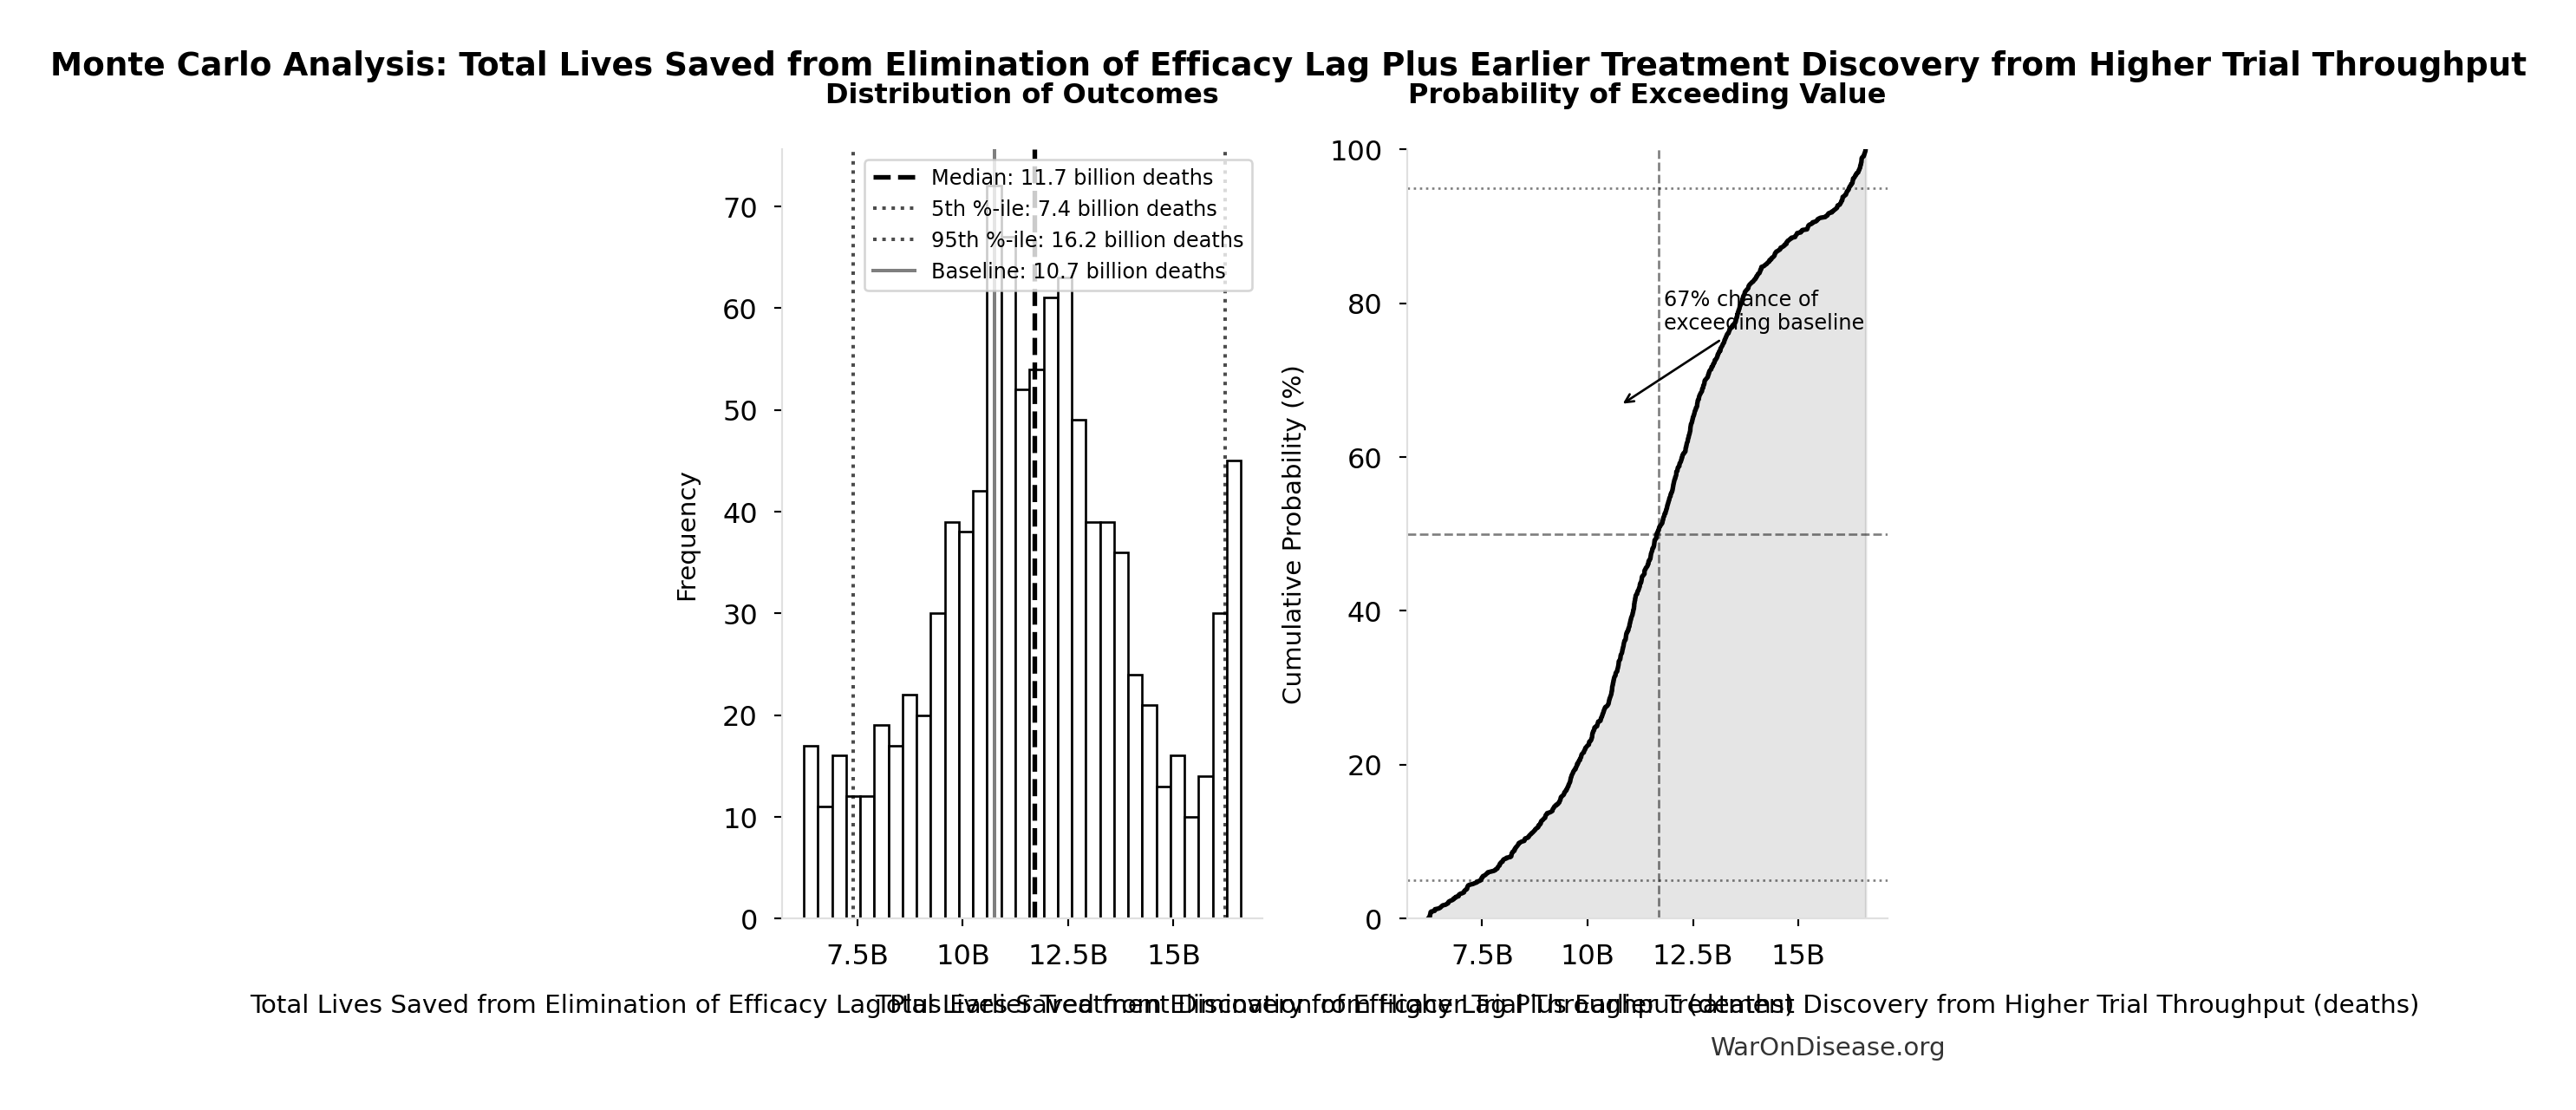
10.7 billion deaths (90% CI: 6.24 billion deaths-20.3 billion deaths) from 212 years (90% CI: 124 years-398 years) average timeline shift
This total combines two effects:
For context: 150,000 people die every day under the current system.
The Monte Carlo distribution below shows the range of lives saved estimates across 10,000 simulations, accounting for uncertainty in timeline shift, daily mortality rates, and avoidable death percentages:
Simulation Results Summary: Total Lives Saved from Elimination of Efficacy Lag Plus Earlier Treatment Discovery from Higher Trial Throughput
| Baseline (deterministic) |
10.7 billion |
| Mean (expected value) |
12.1 billion |
| Median (50th percentile) |
11.5 billion |
| Standard Deviation |
4.28 billion |
| 90% Range (5th-95th percentile) |
[6.24 billion, 20.3 billion] |
The histogram shows 1,000 of the 10,000 Monte Carlo draws for Total Lives Saved from Elimination of Efficacy Lag Plus Earlier Treatment Discovery from Higher Trial Throughput; the summary statistics use all 10,000. The exceedance curve (right) shows the probability of the outcome exceeding any given value.
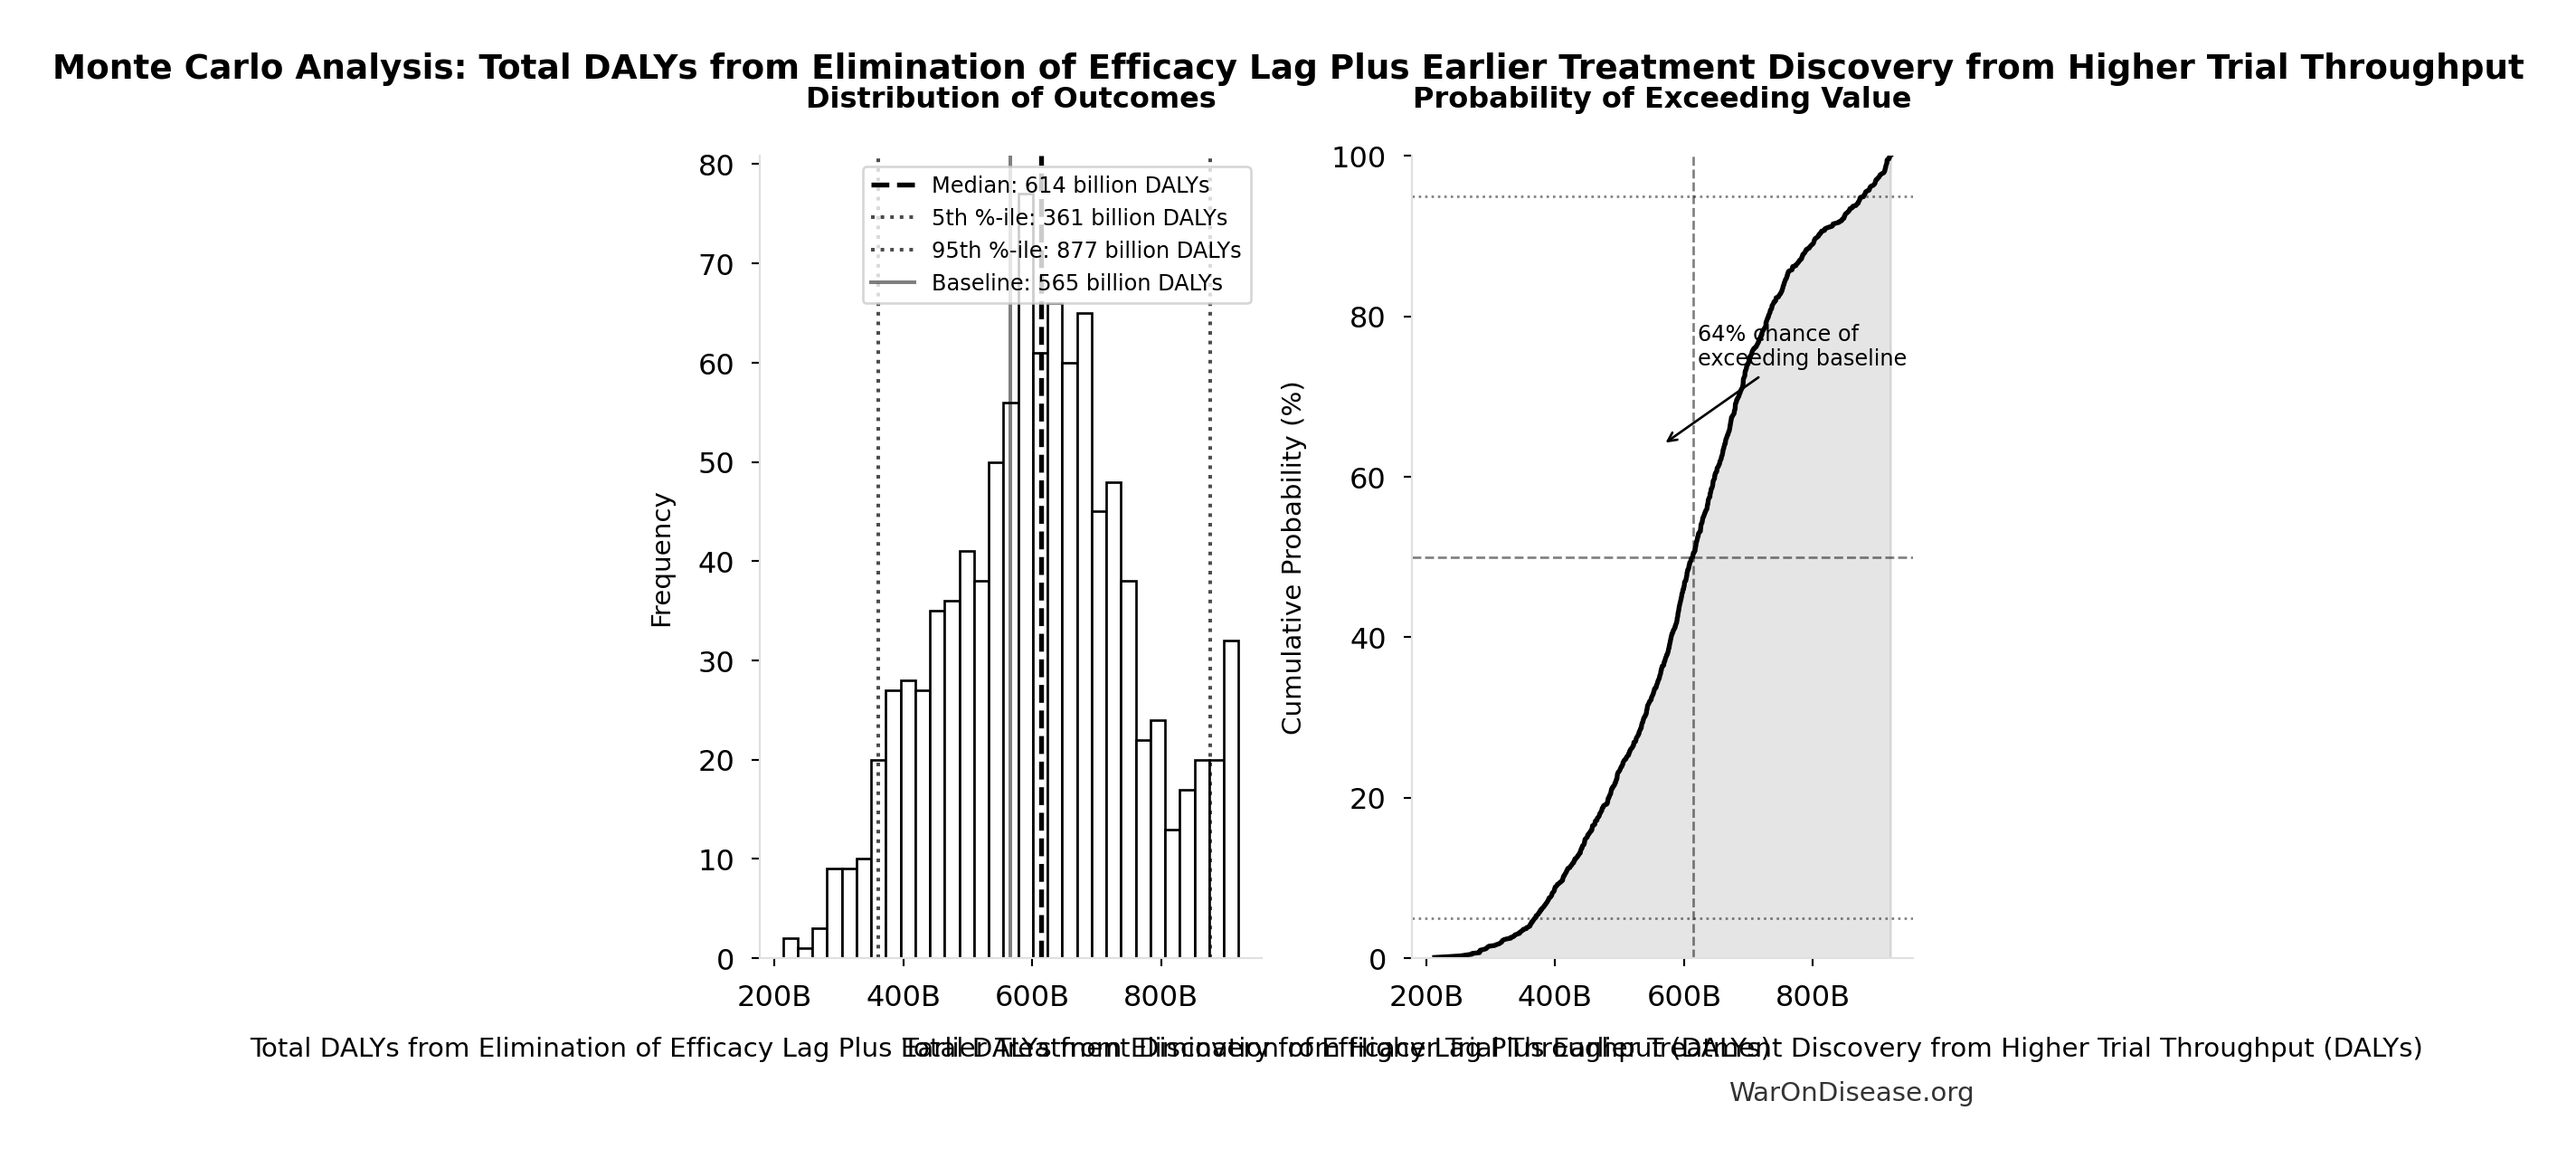
DALYs Averted
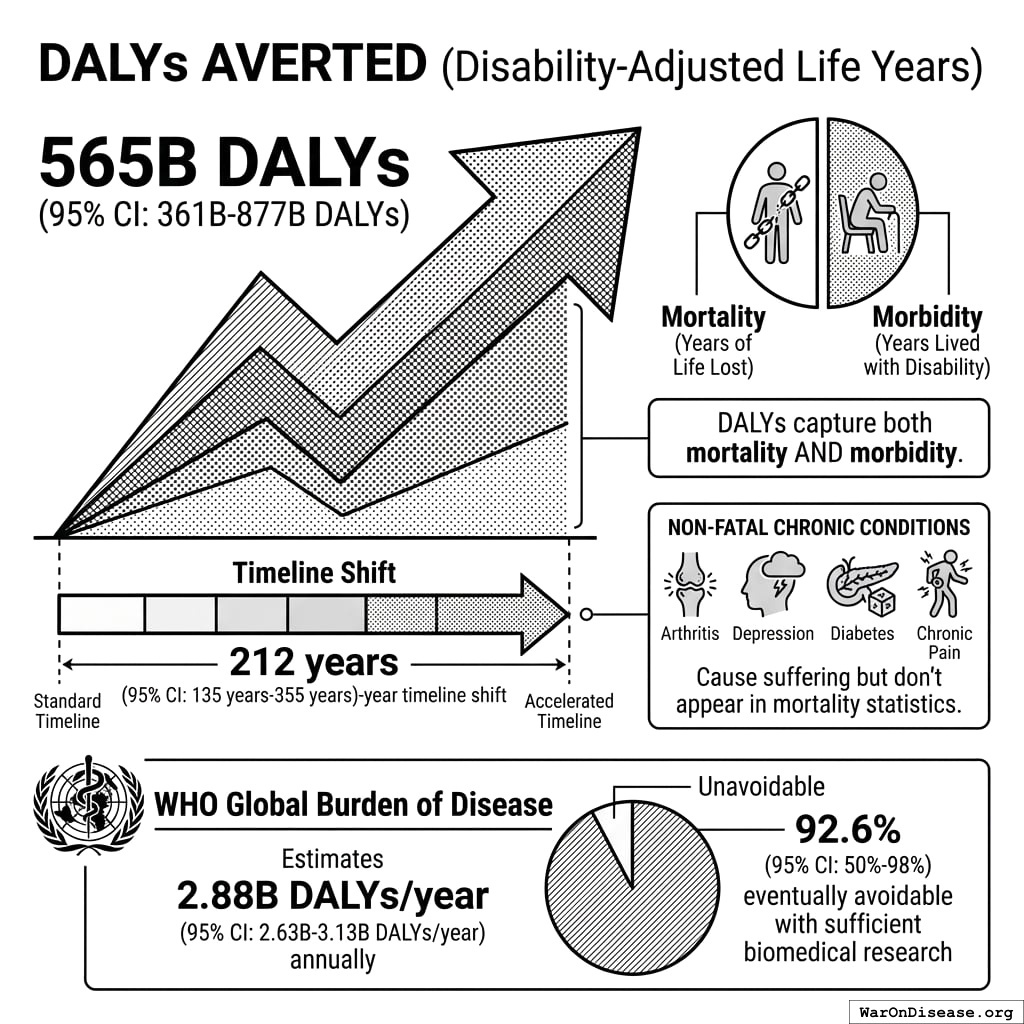
565 billion (Disability-Adjusted Life Years) averted from the 212 years (90% CI: 124 years-398 years) timeline shift.
DALYs capture both mortality (years of life lost) AND morbidity (years lived with disability). This includes non-fatal chronic conditions like arthritis, depression, diabetes, and chronic pain that cause suffering but don’t appear in mortality statistics. The WHO Global Burden of Disease estimates 2.88 billion DALYs/year (90% CI: 2.63 billion DALYs/year-3.12 billion DALYs/year), of which 92.6% (95% CI: 50%-98%) are eventually avoidable with sufficient biomedical research.
Simulation Results Summary: Total DALYs from Elimination of Efficacy Lag Plus Earlier Treatment Discovery from Higher Trial Throughput
| Baseline (deterministic) |
565 billion |
| Mean (expected value) |
635 billion |
| Median (50th percentile) |
600 billion |
| Standard Deviation |
237 billion |
| 90% Range (5th-95th percentile) |
[309 billion, 1.08 trillion] |
The histogram shows 1,000 of the 10,000 Monte Carlo draws for Total DALYs from Elimination of Efficacy Lag Plus Earlier Treatment Discovery from Higher Trial Throughput; the summary statistics use all 10,000. The exceedance curve (right) shows the probability of the outcome exceeding any given value.
Why “Eventually Avoidable” Matters
Of those 150,000 daily deaths:
- 92.6% (95% CI: 50%-98%) eventually avoidable with sufficient biomedical research (gene therapy, AI drug discovery, cellular reprogramming, etc.)
- 7.37% fundamentally unavoidable (primarily accidents, even with advanced prevention)
This differs from “currently preventable” deaths (20-30M annually via vaccines, sanitation, behavior change). The 92.6% (95% CI: 50%-98%) figure represents maximum achievable with advanced biotechnology over decades, not current interventions.
The lives saved calculation measures timeline acceleration, not current curability. With the framework’s 12.3x (90% CI: 4.92x-50.8x) trial capacity increase, the average disease receives first treatment ~204 years (90% CI: 116 years-390 years) earlier. Additionally, eliminating the 8.2 years (90% CI: 4.84 years-11.5 years) efficacy lag means proven treatments reach patients immediately. This logic applies on average across diseases: some first treatments arrive much sooner (early in the therapeutic search space), others somewhat later (later in exploration), with 204 years (90% CI: 116 years-390 years) being the average acceleration.
The Leverage Mechanism: Why 1% Is Enough
The protocol exploits two structural inefficiencies in global capital allocation:
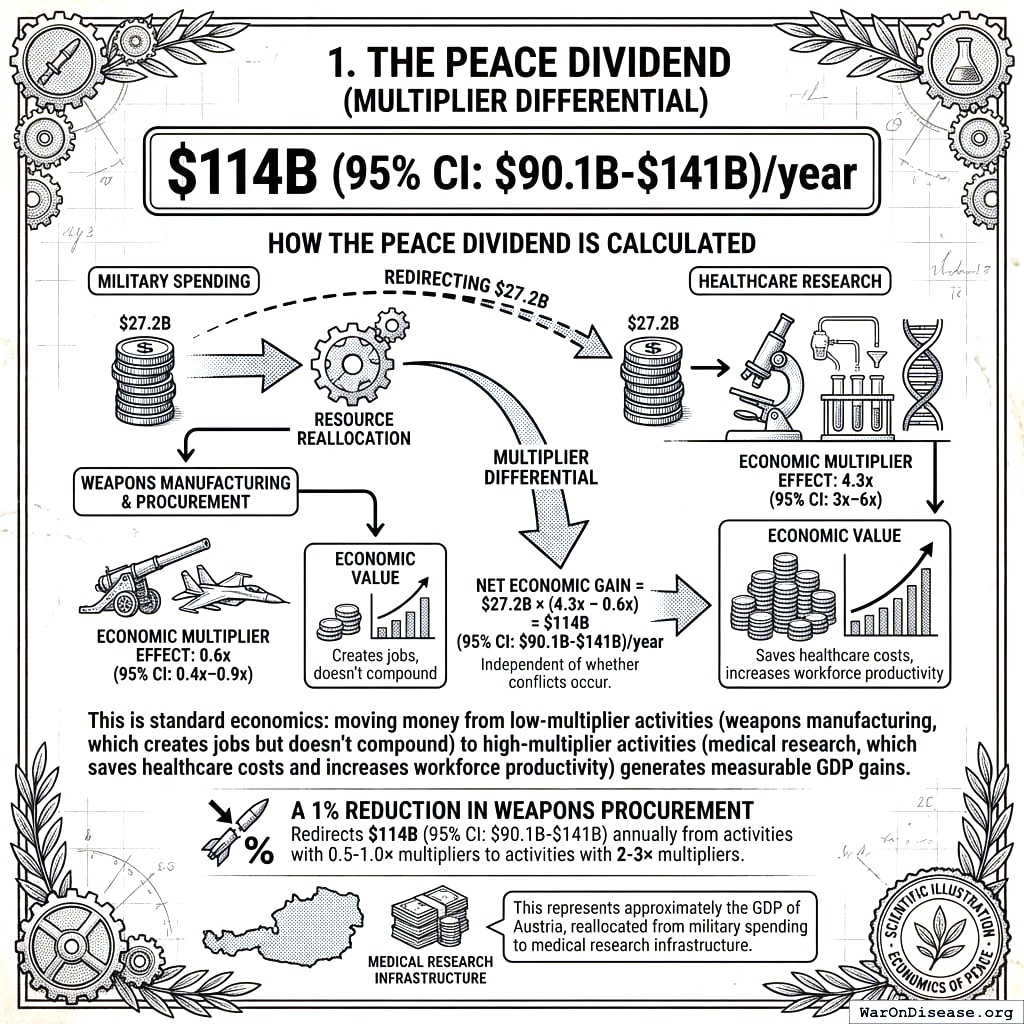
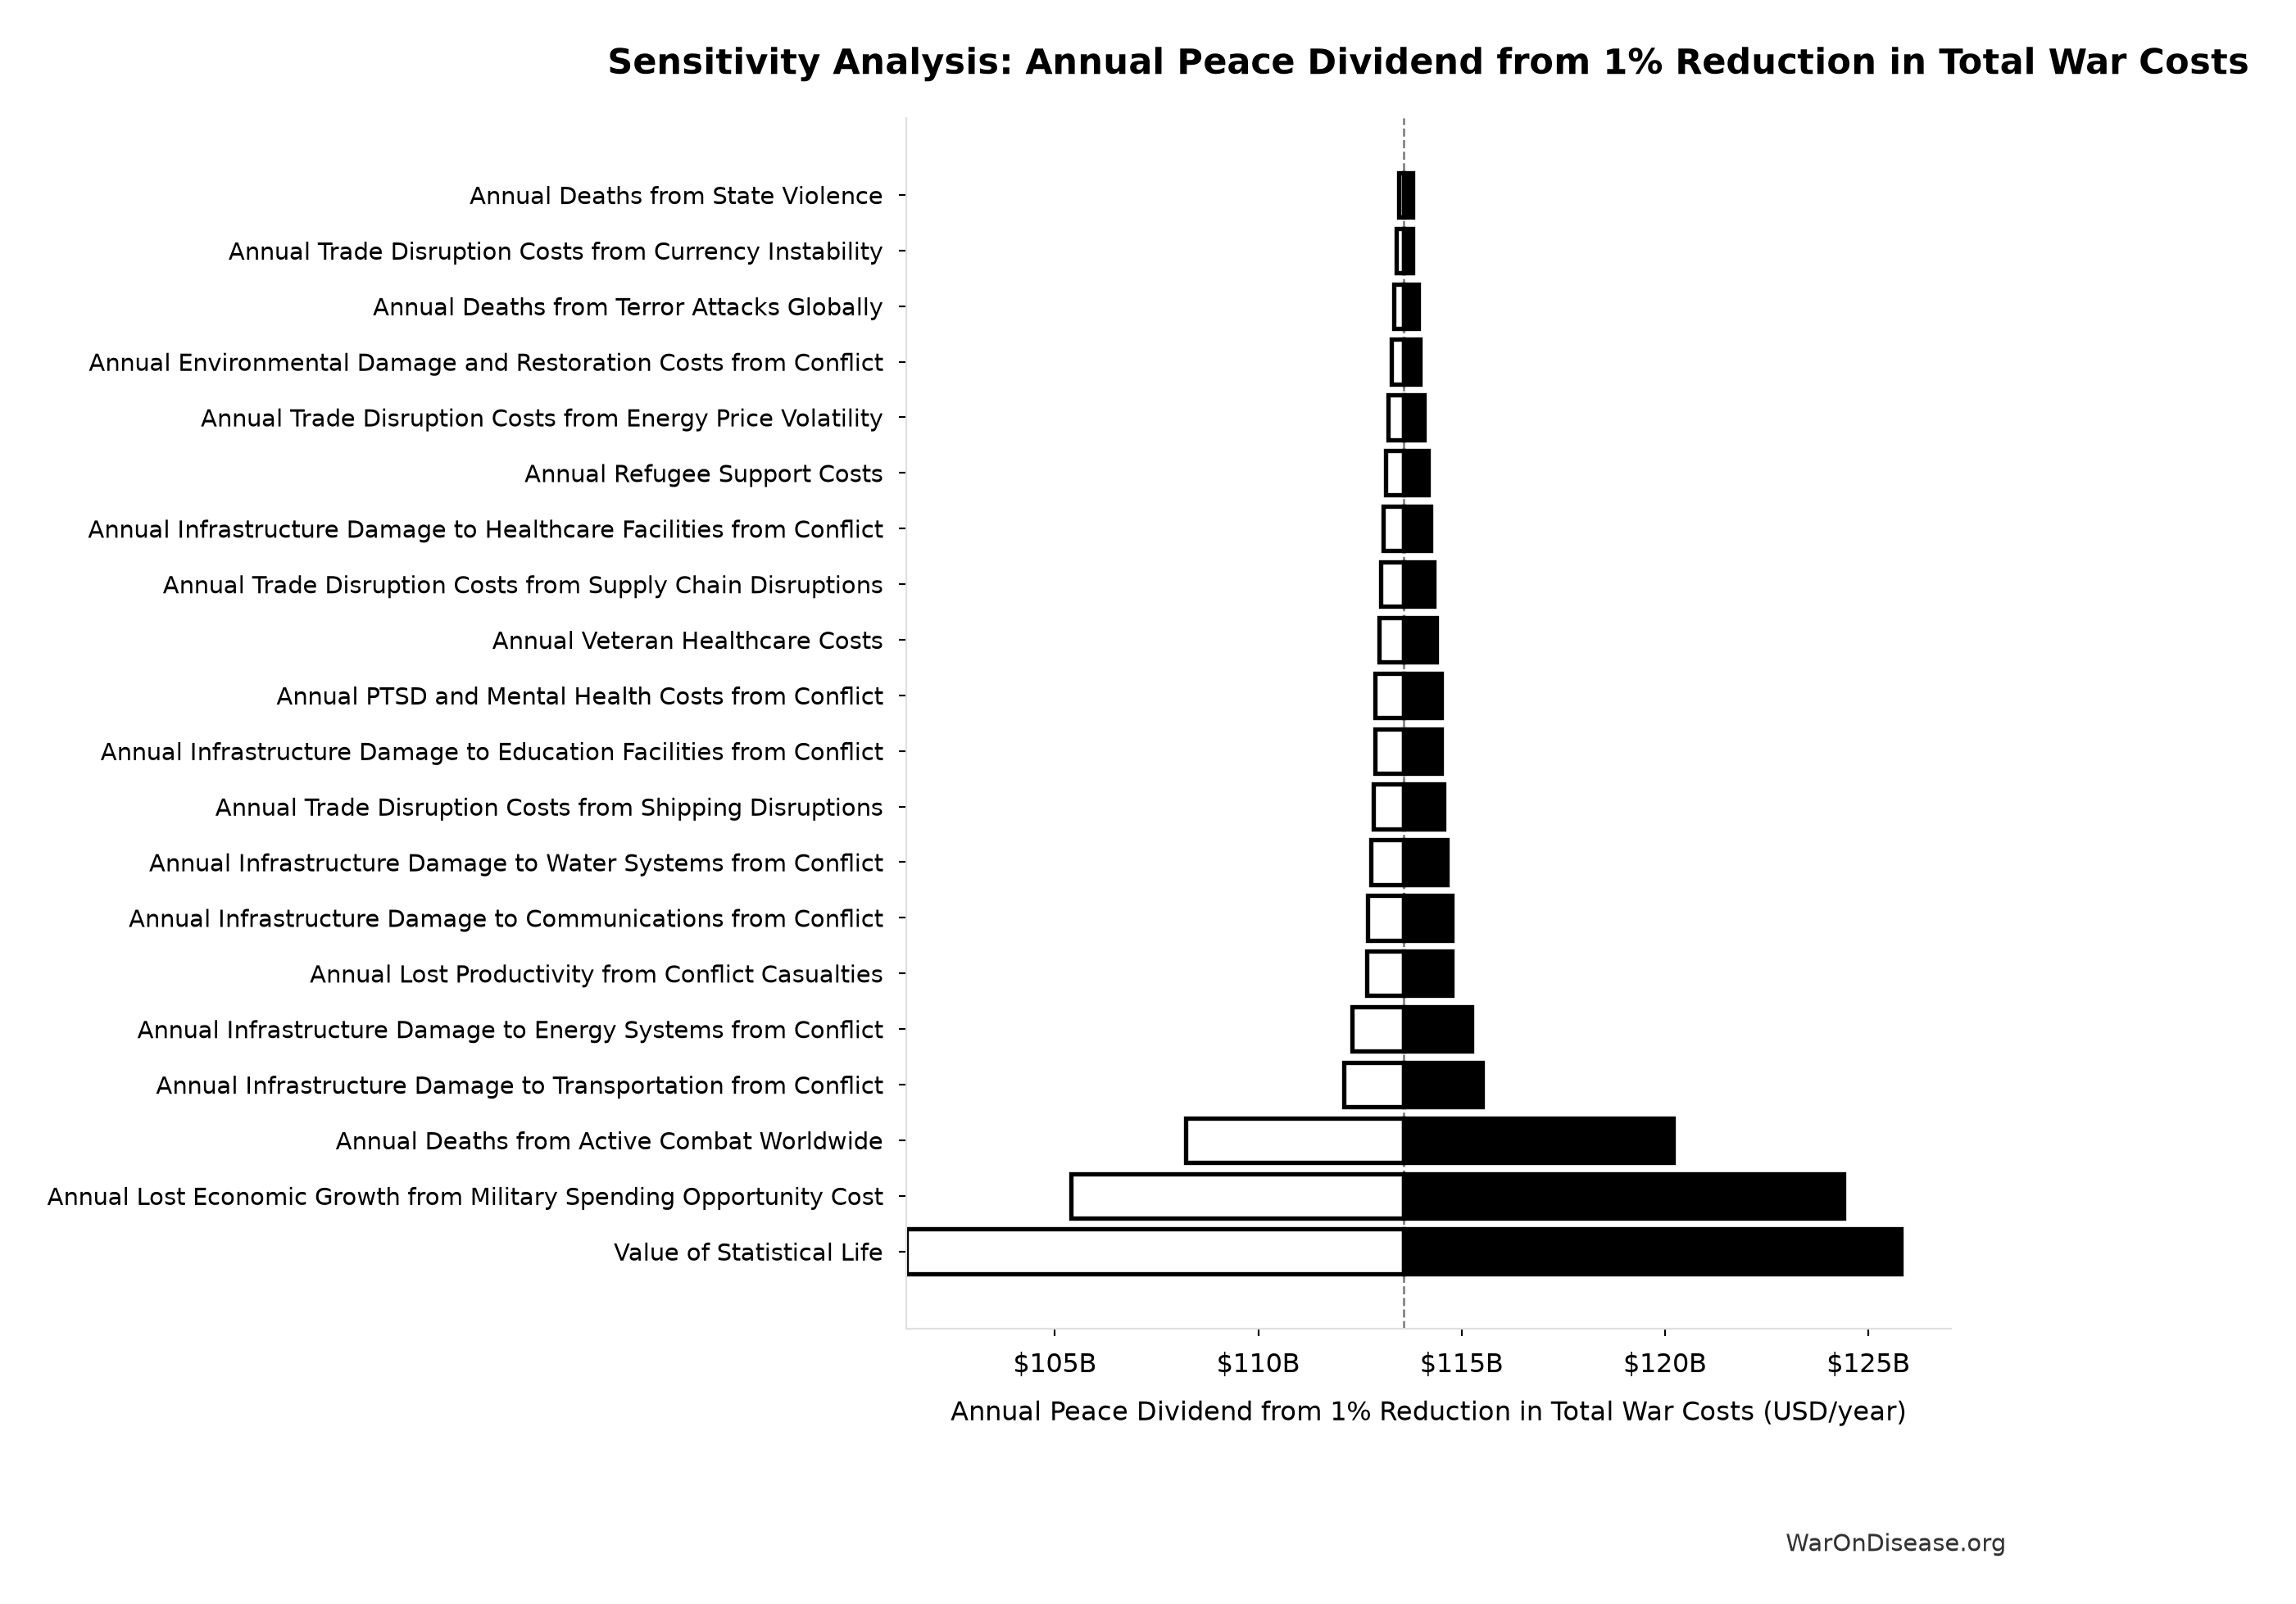
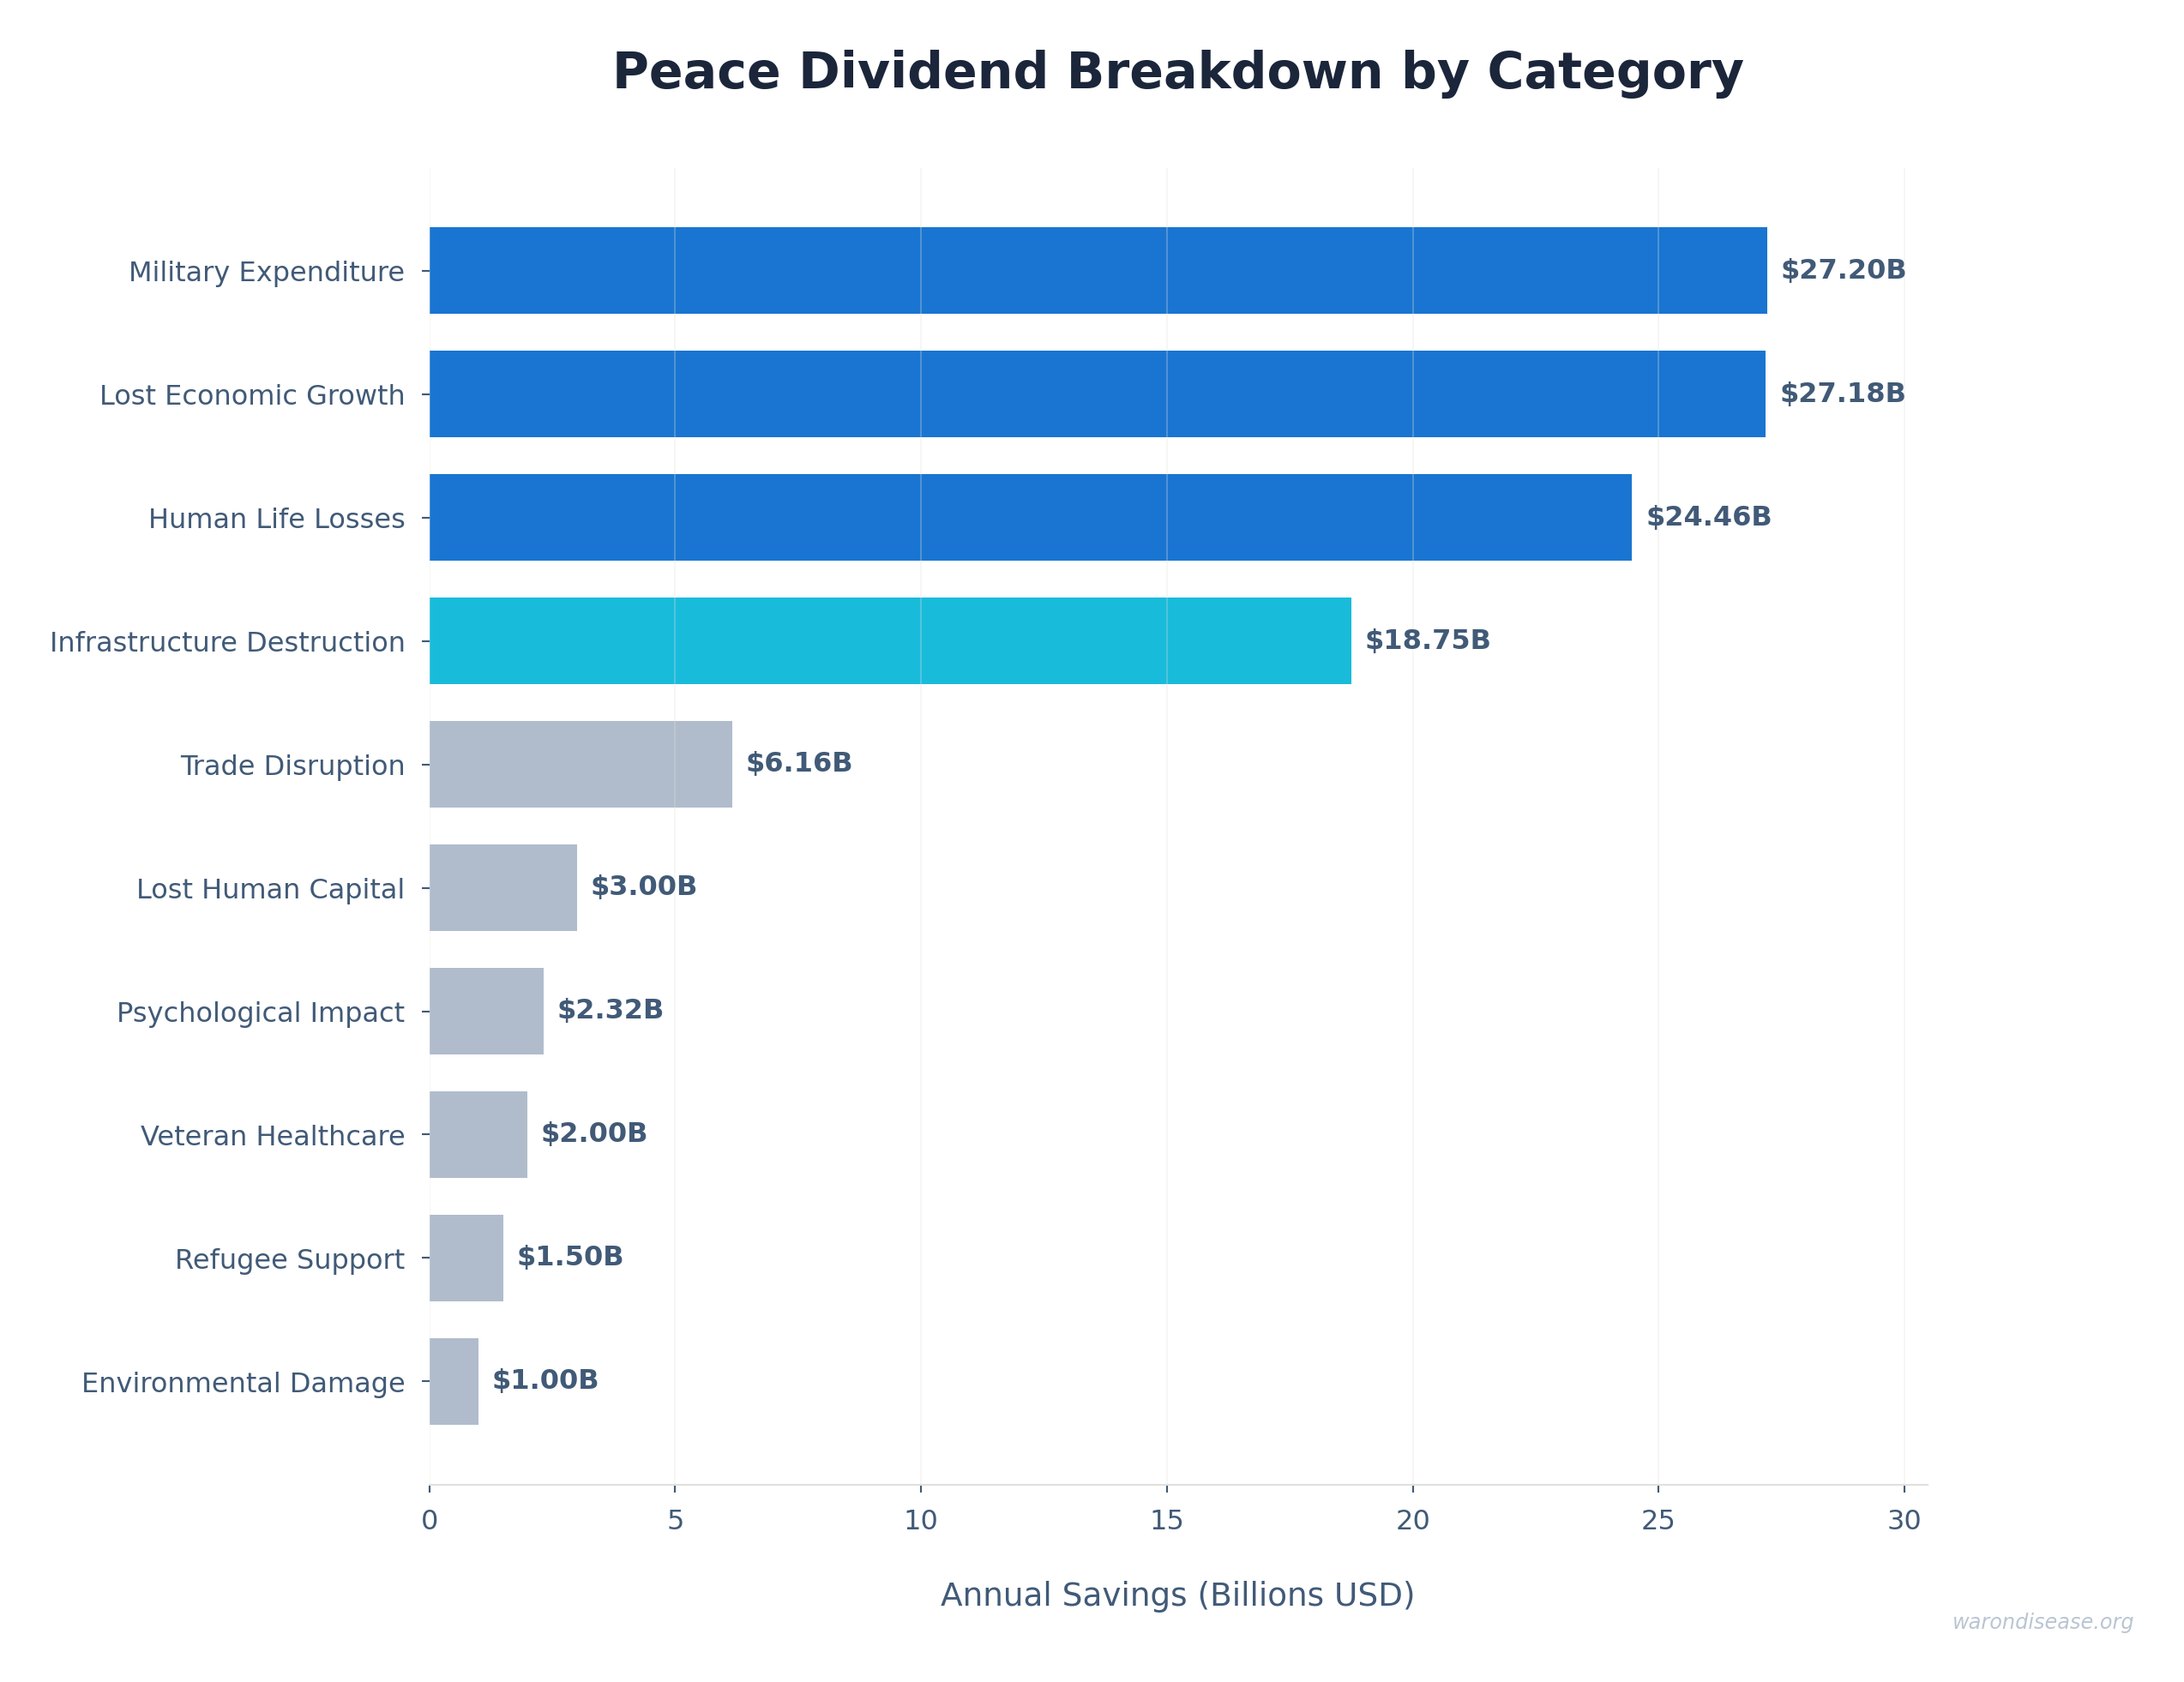
The Peace Dividend (Multiplier Differential)
$114 billion (90% CI: $99.6 billion-$129 billion)/year
How the peace dividend is calculated:
The peace dividend doesn’t assume the treaty prevents wars. It’s based on the economic multiplier effect of resource reallocation: military spending generates 0.6x (95% CI: 0.4x-0.9x) in economic value per dollar spent, while healthcare research generates 4.3x (95% CI: 3x-6x) per dollar. Redirecting $27.2 billion from military to medical research produces a net economic gain of $114 billion (90% CI: $99.6 billion-$129 billion)/year simply from the multiplier differential, independent of whether conflicts occur.
This is standard economics: moving money from low-multiplier activities (weapons manufacturing, which creates jobs but doesn’t compound) to high-multiplier activities (medical research, which saves healthcare costs and increases workforce productivity) generates measurable GDP gains.
A 1% reduction in weapons procurement redirects $114 billion (90% CI: $99.6 billion-$129 billion) annually from activities with 0.5-1.0× multipliers to activities with 2-3× multipliers. This represents approximately the GDP of Austria, reallocated from military spending to medical research infrastructure.
Research Efficiency Dividend (Infrastructure Leverage)
$40.5 billion (90% CI: $31.4 billion-$51.5 billion)–$60 billion (95% CI: $50 billion-$75 billion)52 (all sectors; government share: $4.5 billion (95% CI: $3 billion-$6 billion))
Traditional trials require:
- Dedicated trial sites with custom infrastructure (pragmatic trials use existing hospitals)
- Extensive source data verification and monitoring visits (pragmatic trials use routine medical records)
- Complex eligibility criteria excluding most patients (pragmatic trials enroll broadly)
- Detailed case report forms capturing hundreds of data points (pragmatic trials collect <10 core outcomes)
- Years of site activation and regulatory approval per country (pragmatic trials activate sites in weeks)
Pragmatic trials eliminate these duplicative overhead costs by leveraging existing infrastructure. The Harvard meta-analysis of 108 embedded trials135 confirms this efficiency is reproducible: median cost $97 (95% CI: $19-$478)/patient across diverse therapeutic areas. This structural difference explains why costs drop 44.1x (90% CI: 12.8x-210x) instead of 2× or 5×.
How It Increases National Security
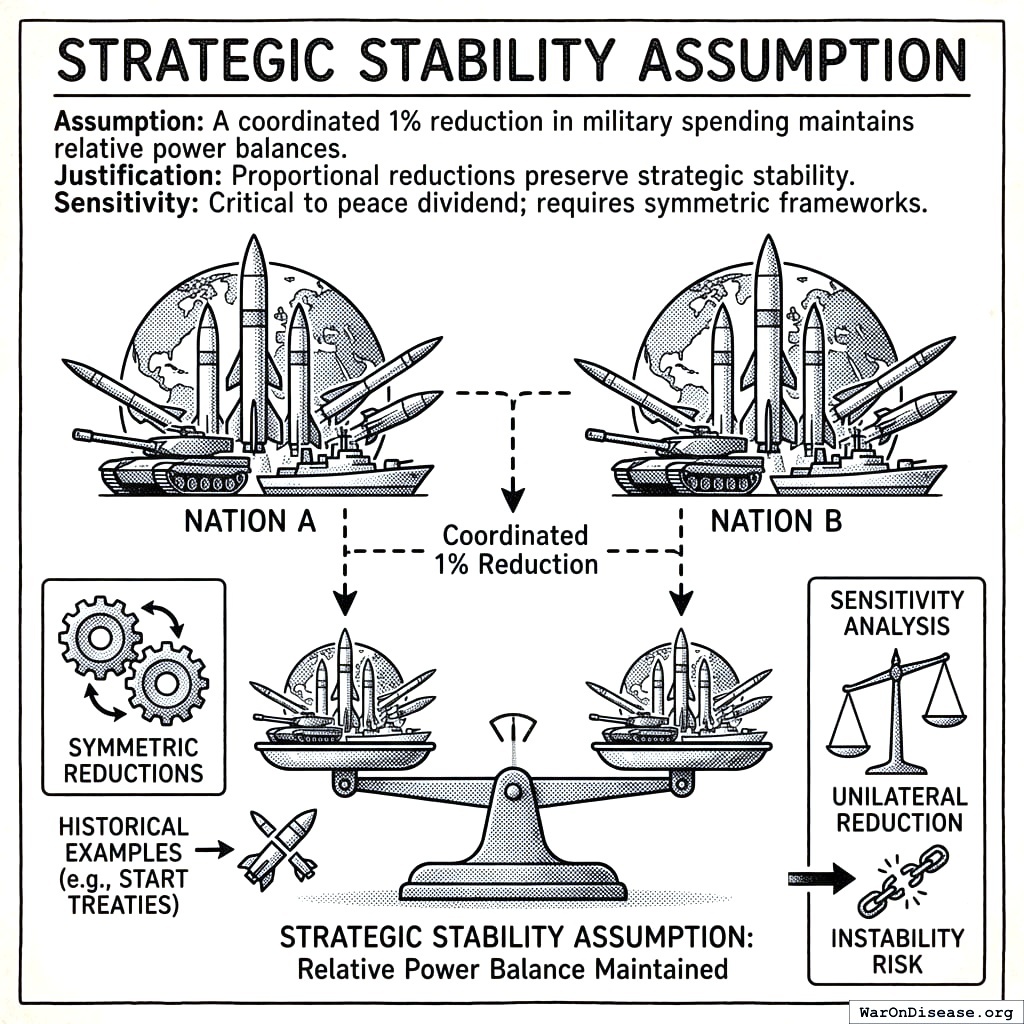
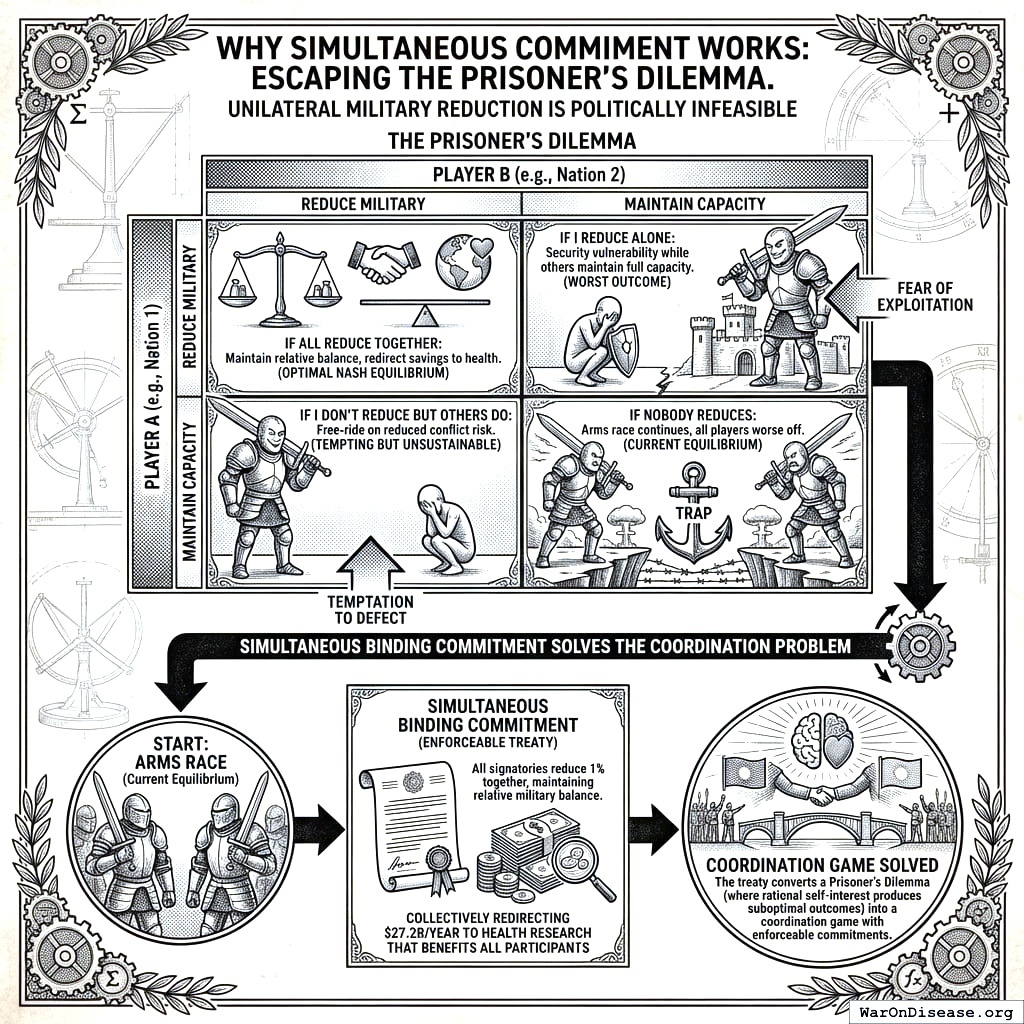
All signatories reduce by 1% simultaneously.
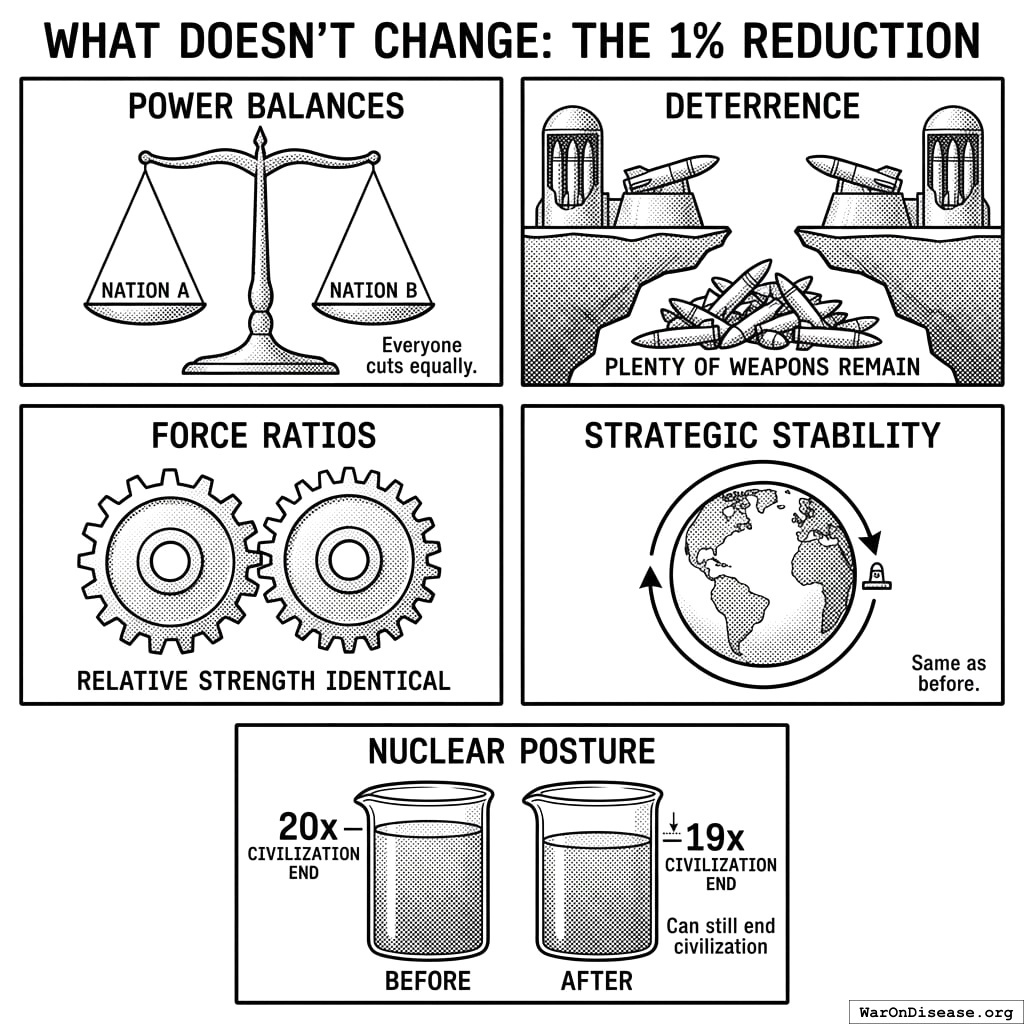
What doesn’t change
- Power balances (everyone cuts equally)
- Deterrence (still plenty of weapons)
- Force ratios (relative strength identical)
- Strategic stability (same as before, just 1% less apocalyptic)
- Nuclear posture (can still end civilization 19 times instead of 20)
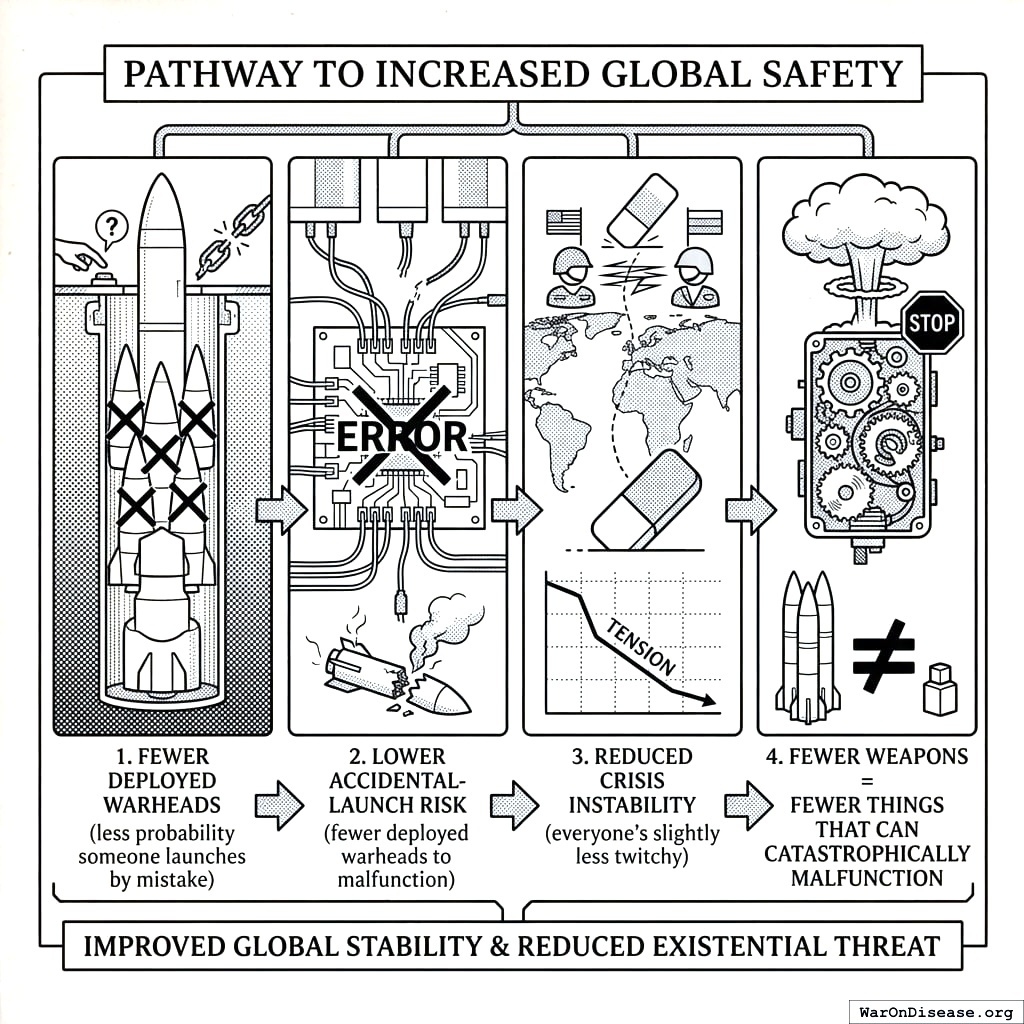
What improves
- Fewer deployed warheads (less probability someone launches by mistake)
- Lower accidental-launch risk (fewer deployed warheads to malfunction)
- Reduced crisis instability (everyone’s slightly less twitchy)
- Fewer weapons = fewer things that can catastrophically malfunction
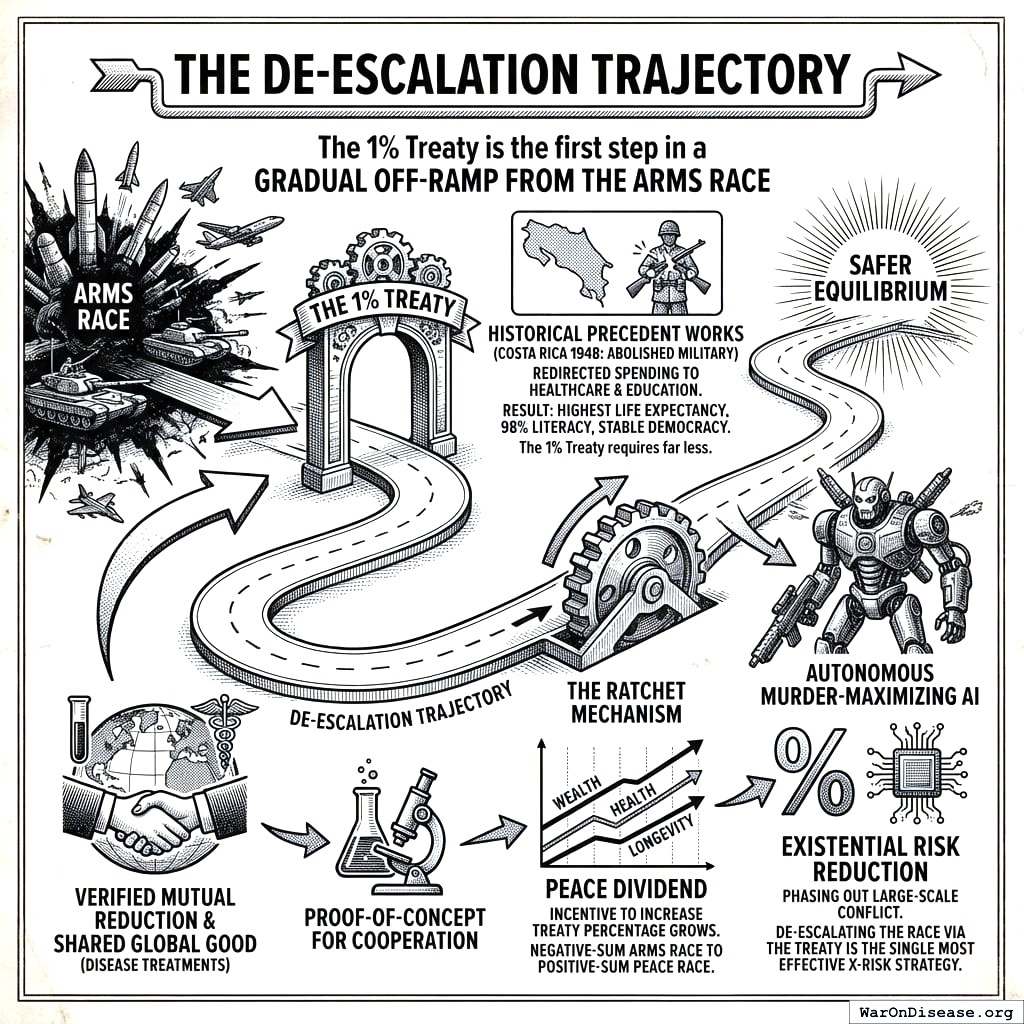
The De-escalation Trajectory
The 1% Treaty is the first step in a gradual off-ramp from the arms race.
By successfully executing a verified, mutual reduction in military spending to fund a shared global good (developing disease treatments), humanity establishes a proof-of-concept for cooperation.
- Historical precedent works: Costa Rica abolished its military entirely in 1948, redirecting defense spending to universal healthcare and education. Result: highest life expectancy in Central America (80 years), 98% literacy, and stable democracy for 75+ years. The 1% Treaty requires far less. It maintains virtually all military capacity while redirecting just 1% to health research.
- The Ratchet Mechanism: Once the economic benefits of the “Peace Dividend” (wealth, health, longevity) materialize, the incentive to increase the treaty percentage grows. We move from a negative-sum arms race to a positive-sum “peace race.”
This gradual approach steers nations toward a safer equilibrium, one percentage point at a time.
Why The Ratchet Holds: A Funded Defense Constituency
Economic gravity alone does not protect a budget line. Treaties get renegotiated, and a reallocation with no organized defenders is reversed by the interests it displaced.
The treaty therefore hard-codes a non-medical allocation on all inflows: 10% to returns on whatever capital financed adoption, and 10% to a standing political layer whose function is to defend the treaty against repeal. This is a deliberate cost, not an oversight. It buys a permanent constituency with a financial interest in the treaty surviving each budget cycle. The remaining 80% funds trials.
Every benefit figure in this analysis is computed on the 80% share, not on gross treaty inflows. Readers who consider the defense layer unnecessary should read the results as conservative by roughly a quarter.
Who receives the non-medical allocation, and on what terms, depends on which adoption pathway is used. Those pathways are specified and costed in Adoption Pathways and Cost Sensitivity.
Adoption Pathways and Cost Sensitivity
The benefit estimates in this analysis are conditional on treaty adoption and independent of how adoption is achieved. The cost estimates are not. Cost per DALY is adoption cost divided by DALYs averted, so the numerator moves with the pathway while the denominator stays fixed. This section specifies the costed pathways and tests whether the cost-effectiveness conclusion survives substituting each one.
Why the Pathway Is a Separate Question
Politicians face career penalties for supporting policies that threaten incumbent industries. That is a problem in mechanism design, not in health economics, and it has more than one solution. Each pathway below has been specified elsewhere in enough detail to cost, each is sufficient for adoption on its own, and only one has to work.
They divide into two cost structures, and the distinction matters for interpreting the cost figure:
- Expenditure pathways spend money that is gone once spent (advocacy campaigns, referenda, litigation, platform construction).
- Capital deployment pathways buy assets the deployer retains (bonds repaid from treaty inflows, equity in the firms whose lobbying sets the budget). The economically relevant cost is the opportunity cost of the capital, not the principal, because the principal is recovered.
Treating the two as equivalent produces a metric that penalizes capital deployment and rewards cheap long shots, which is backwards.
Costed Pathways
Expected annual social value is P(adoption) multiplied by the annual peace dividend. It is deliberately not divided by cost, for the reason given above.
These probabilities are conditional on the pathway being funded, and they are not independent of one another. All six draw on the same pool of capital and the same coordination capacity, so they cannot be combined as independent trials to produce an aggregate probability of adoption. What the table supports is narrower and sufficient: the highest-probability pathway does not depend on persuading legislators to act against their donors, and no pathway’s cost is large enough to overturn the cost-effectiveness result.
Sensitivity of Cost per DALY to Pathway
The base case uses the advocacy campaign budget ($1 billion) as the adoption cost. It is the most conservative fully specified expenditure pathway and the least favorable common assumption, so it is the reasonable default.
Substituting the alternatives moves the adoption cost in both directions:
The upper bound is the binding test. Replacing the campaign budget with the shareholder-control opportunity cost raises cost per DALY proportionally, and the result remains far below the $89 (95% CI: $78-$100)/DALY benchmark for the best available consumable intervention. The conclusion is therefore not an artifact of the pathway assumed: it holds across an adoption-cost range spanning more than two orders of magnitude.
The residual risk is not cost. It is P(adoption), which is treated directly in Expected Value Under Political Uncertainty.
Dominance Analysis
For objectives including:
- Quality-adjusted life years (QALYs)
- Lifespan
- Productivity
- Economic growth
- National security
- Existential safety
- Not suffering unnecessarily
Redirection of 1% of military spending to pragmatic trials delivers exceptional returns.
Quantitative Comparison
With $1 billion allocated toward saving lives, here’s what each option delivers:
Conservative benefits ($154 billion (90% CI: $137 billion-$172 billion) annually) exceed childhood vaccinations by 10.3x (90% CI: 6.54x-17.3x).
\[
\begin{gathered}
k_{treaty:vax} \\
= \frac{Benefit_{peace+RD}}{Benefit_{vax,ann}} \\
= \frac{\$154B}{\$15B} \\
= 10.3
\end{gathered}
\]
where:
\[
\begin{gathered}
Benefit_{peace+RD} \\
= Benefit_{peace,soc} + Benefit_{RD,ann} \\
= \$114B + \$40.5B \\
= \$154B
\end{gathered}
\]
where:
\[
\begin{gathered}
Benefit_{peace,soc} \\
= Cost_{war,total} \times Reduce_{treaty} \\
= \$11.4T \times 1\% \\
= \$114B
\end{gathered}
\]
where:
\[
\begin{gathered}
Cost_{war,total} \\
= Cost_{war,direct} + Cost_{war,indirect} \\
= \$7.66T + \$3.7T \\
= \$11.4T
\end{gathered}
\]
where:
\[
\begin{gathered}
Cost_{war,direct} \\
= Loss_{life,conflict} + Damage_{infra,total} \\
+ Disruption_{trade} + Spending_{mil} \\
= \$2.45T + \$1.88T + \$616B + \$2.72T \\
= \$7.66T
\end{gathered}
\]
where:
\[
\begin{gathered}
Loss_{life,conflict} \\
= Cost_{combat,human} + Cost_{state,human} \\
+ Cost_{terror,human} \\
= \$2.34T + \$27B + \$83B \\
= \$2.45T
\end{gathered}
\]
where:
\[
\begin{gathered}
Cost_{combat,human} \\
= Deaths_{combat} \times VSL \\
= 234{,}000 \times \$10M \\
= \$2.34T
\end{gathered}
\]
where:
\[
\begin{gathered}
Cost_{state,human} \\
= Deaths_{state} \times VSL \\
= 2{,}700 \times \$10M \\
= \$27B
\end{gathered}
\]
where:
\[
\begin{gathered}
Cost_{terror,human} \\
= Deaths_{terror} \times VSL \\
= 8{,}300 \times \$10M \\
= \$83B
\end{gathered}
\]
where:
\[
\begin{gathered}
Damage_{infra,total} \\
= Damage_{comms} + Damage_{edu} + Damage_{energy} \\
+ Damage_{health} + Damage_{transport} + Damage_{water} \\
= \$298B + \$234B + \$422B + \$166B + \$487B + \$268B \\
= \$1.88T
\end{gathered}
\]
where:
\[
\begin{gathered}
Disruption_{trade} \\
= Disruption_{currency} + Disruption_{energy} \\
+ Disruption_{shipping} + Disruption_{supply} \\
= \$57.4B + \$125B + \$247B + \$187B \\
= \$616B
\end{gathered}
\]
where:
\[
\begin{gathered}
Cost_{war,indirect} \\
= Damage_{env} + Loss_{growth,mil} + Loss_{capital,conflict} \\
+ Cost_{psych} + Cost_{refugee} + Cost_{vet} \\
= \$100B + \$2.72T + \$300B + \$232B + \$150B + \$200B \\
= \$3.7T
\end{gathered}
\]
where:
\[
\begin{gathered}
Benefit_{RD,ann} \\
= Spending_{trials} \times Pct_{P2+P3} \times Reduce_{pct} \\
= \$60B \times 69\% \times 97.7\% \\
= \$40.5B
\end{gathered}
\]
where:
\[
\begin{gathered}
Reduce_{pct} \\
= 1 - \frac{Cost_{pragmatic,pt}}{Cost_{P3,pt}} \\
= 1 - \frac{\$929}{\$41K} \\
= 97.7\%
\end{gathered}
\]
GiveWell Top Charities (individual benchmarks):
Why the 50.3kx (90% CI: 25.0kx-111.1kx) better cost-effectiveness vs. bed nets is plausible:
Bed nets are consumable interventions requiring ongoing replacement every 3-5 years. To save 1,000 lives over 20 years requires purchasing and distributing thousands of bed nets repeatedly. Total cost scales linearly with lives saved.
The 1% Treaty is a one-time implementation cost ($1 billion) that unlocks a permanent infrastructure shift. Once the treaty passes, it redirects $27.2 billion/year in perpetuity, funding millions of trial participants annually. The implementation cost is paid once; the benefits compound indefinitely.
Asset class comparison: Bed nets are depreciating assets (consumed, worn out, require replacement). Medical treatments are appreciating assets. Once discovered, they compound in value forever; penicillin discovered in 1928 still saves lives today. Military spending creates depreciating assets (weapons become obsolete, require replacement). This reallocation shifts capital from depreciating to appreciating asset classes, explaining why ROI can be 50.3kx (90% CI: 25.0kx-111.1kx) better than excellent consumable interventions like bed nets.
\[
\begin{gathered}
k_{treaty:nets} \\
= \frac{Cost_{nets}}{Cost_{treaty,DALY}} \\
= \frac{\$89}{\$0.00177} \\
= 50{,}300
\end{gathered}
\]
where:
\[
\begin{gathered}
Cost_{treaty,DALY} \\
= \frac{Cost_{campaign}}{DALYs_{max}} \\
= \frac{\$1B}{565B} \\
= \$0.00177
\end{gathered}
\]
where:
\[
\begin{gathered}
Cost_{campaign} \\
= Budget_{viral,base} + Budget_{lobby,treaty} \\
+ Budget_{reserve} \\
= \$250M + \$650M + \$100M \\
= \$1B
\end{gathered}
\]
where:
\[
\begin{gathered}
DALYs_{max} \\
= DALYs_{global,ann} \times Pct_{avoid,DALY} \times T_{accel,max} \\
= 2.88B \times 92.6\% \times 212 \\
= 565B
\end{gathered}
\]
where:
\[
T_{accel,max} = T_{accel} + T_{lag} = 204 + 8.2 = 212
\]
where:
\[
\begin{gathered}
T_{accel} \\
= T_{first,SQ} \times \left(1 - \frac{1}{k_{capacity}}\right) \\
= 222 \times \left(1 - \frac{1}{12.3}\right) \\
= 204
\end{gathered}
\]
where:
\[
\begin{gathered}
T_{first,SQ} \\
= T_{queue,SQ} \times 0.5 \\
= 443 \times 0.5 \\
= 222
\end{gathered}
\]
where:
\[
\begin{gathered}
T_{queue,SQ} \\
= \frac{N_{untreated}}{Treatments_{new,ann}} \\
= \frac{6{,}650}{15} \\
= 443
\end{gathered}
\]
where:
\[
\begin{gathered}
N_{untreated} \\
= N_{rare} \times 0.95 \\
= 7{,}000 \times 0.95 \\
= 6{,}650
\end{gathered}
\]
where:
\[
\begin{gathered}
k_{capacity} \\
= \frac{N_{fundable,ref}}{Slots_{curr}} \\
= \frac{23.4M}{1.9M} \\
= 12.3
\end{gathered}
\]
where:
\[
\begin{gathered}
N_{fundable,ref} \\
= \frac{Subsidies_{trial,ref}}{Cost_{pragmatic,pt}} \\
= \frac{\$21.8B}{\$929} \\
= 23.4M
\end{gathered}
\]
where:
\[
\begin{gathered}
Subsidies_{trial,ref} \\
= Funding_{trial,ref} - OPEX_{trial} \\
= \$21.8B - \$40M \\
= \$21.8B
\end{gathered}
\]
where:
\[
\begin{gathered}
OPEX_{trial} \\
= Cost_{platform} + Cost_{staff} + Cost_{infra} \\
+ Cost_{regulatory} + Cost_{community} \\
= \$15M + \$10M + \$8M + \$5M + \$2M \\
= \$40M
\end{gathered}
\]
Methodology
This analysis uses three standard health economics tools:
- Net Present Value (NPV): Future money is worth less than current money because humans are impatient
- Quality-Adjusted Life Years (QALYs): Measuring healthy life, not just survival - a year lived in full health scores 1.0, while years with illness or disability score proportionally lower
- Return on Investment (ROI): Economic value generated per dollar invested
The methodology follows standard health economics practices. All parameters, sources, and uncertainty ranges are documented in Parameters and Calculations.
Cost-Benefit Framework
Cost Components
One spends $1 billion convincing humans that not dying is preferable to dying. This covers:
This is a one-time cost. Treaty passage is either achieved or it isn’t.
Benefit Components
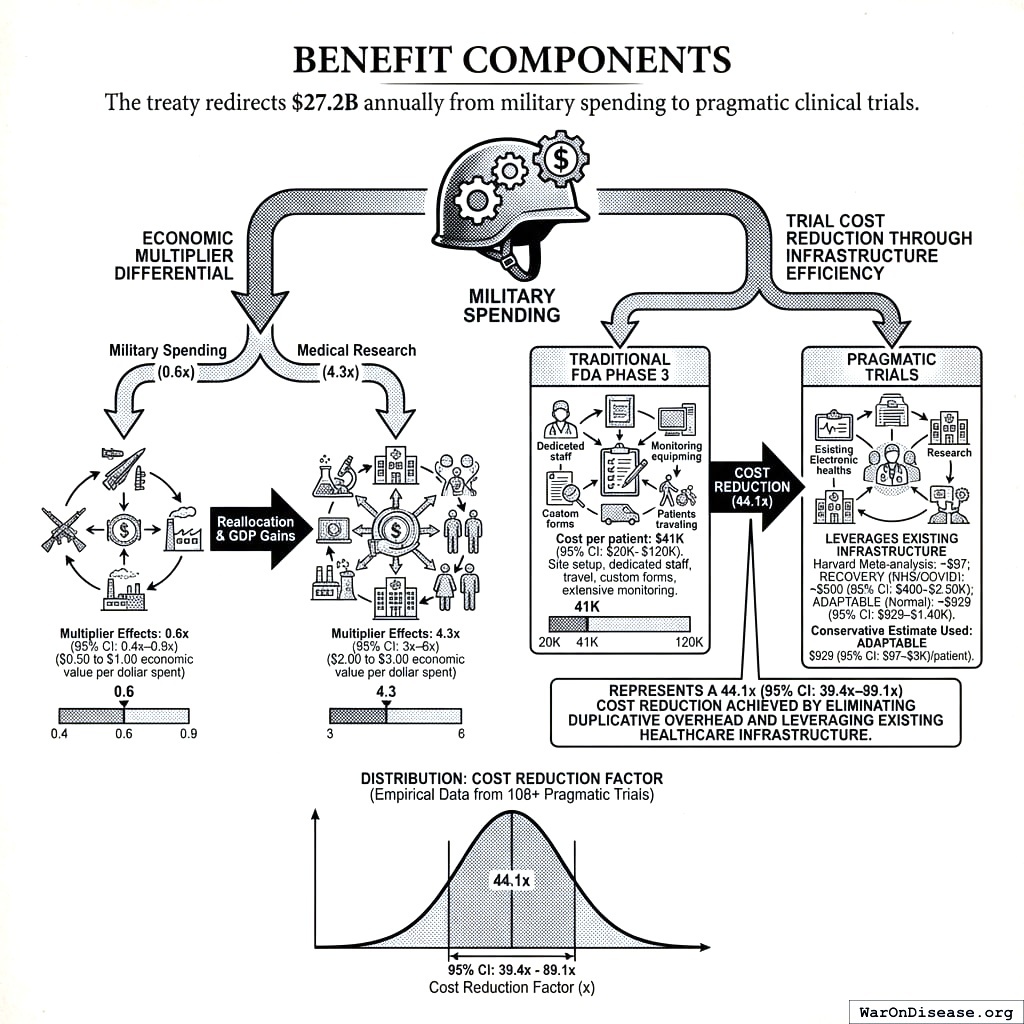
The treaty redirects $27.2 billion annually from military spending to pragmatic clinical trials.
This generates benefits through two mechanisms:
1. Economic multiplier differential
2. Trial cost reduction through infrastructure efficiency
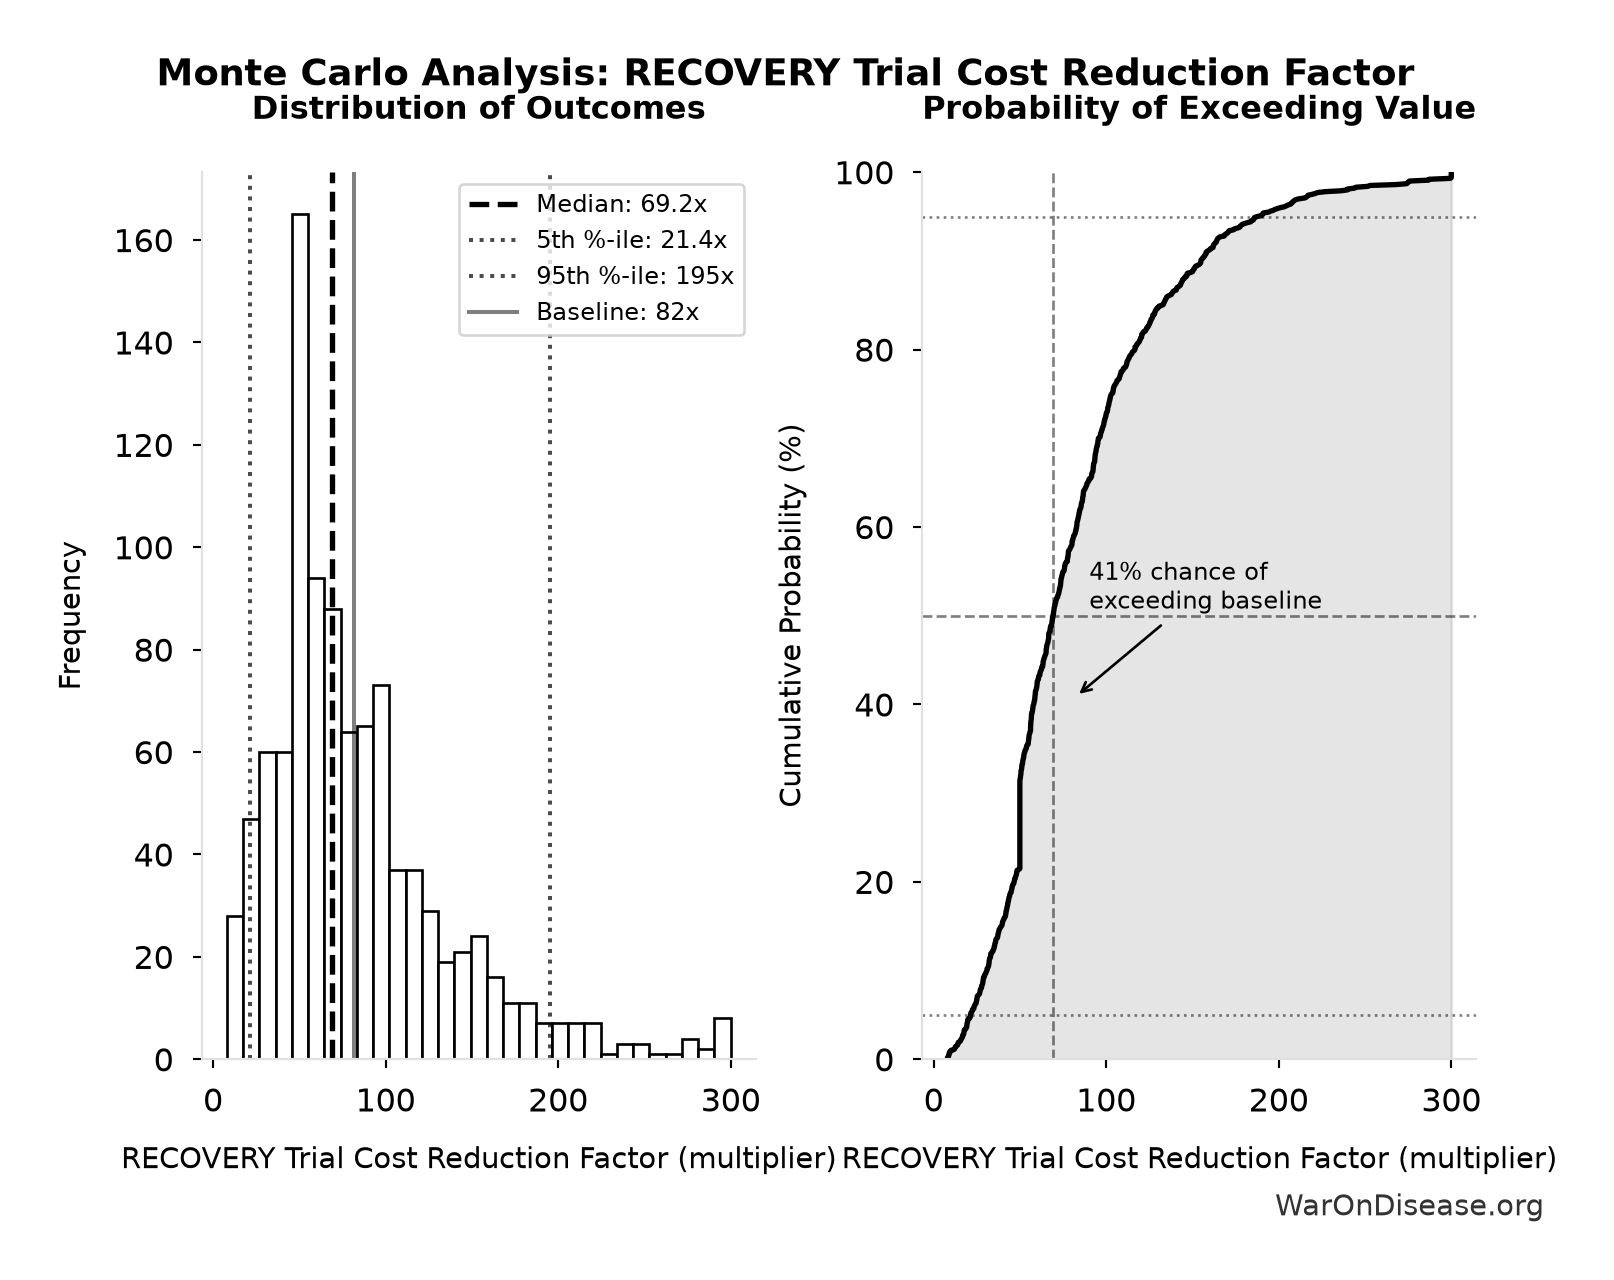
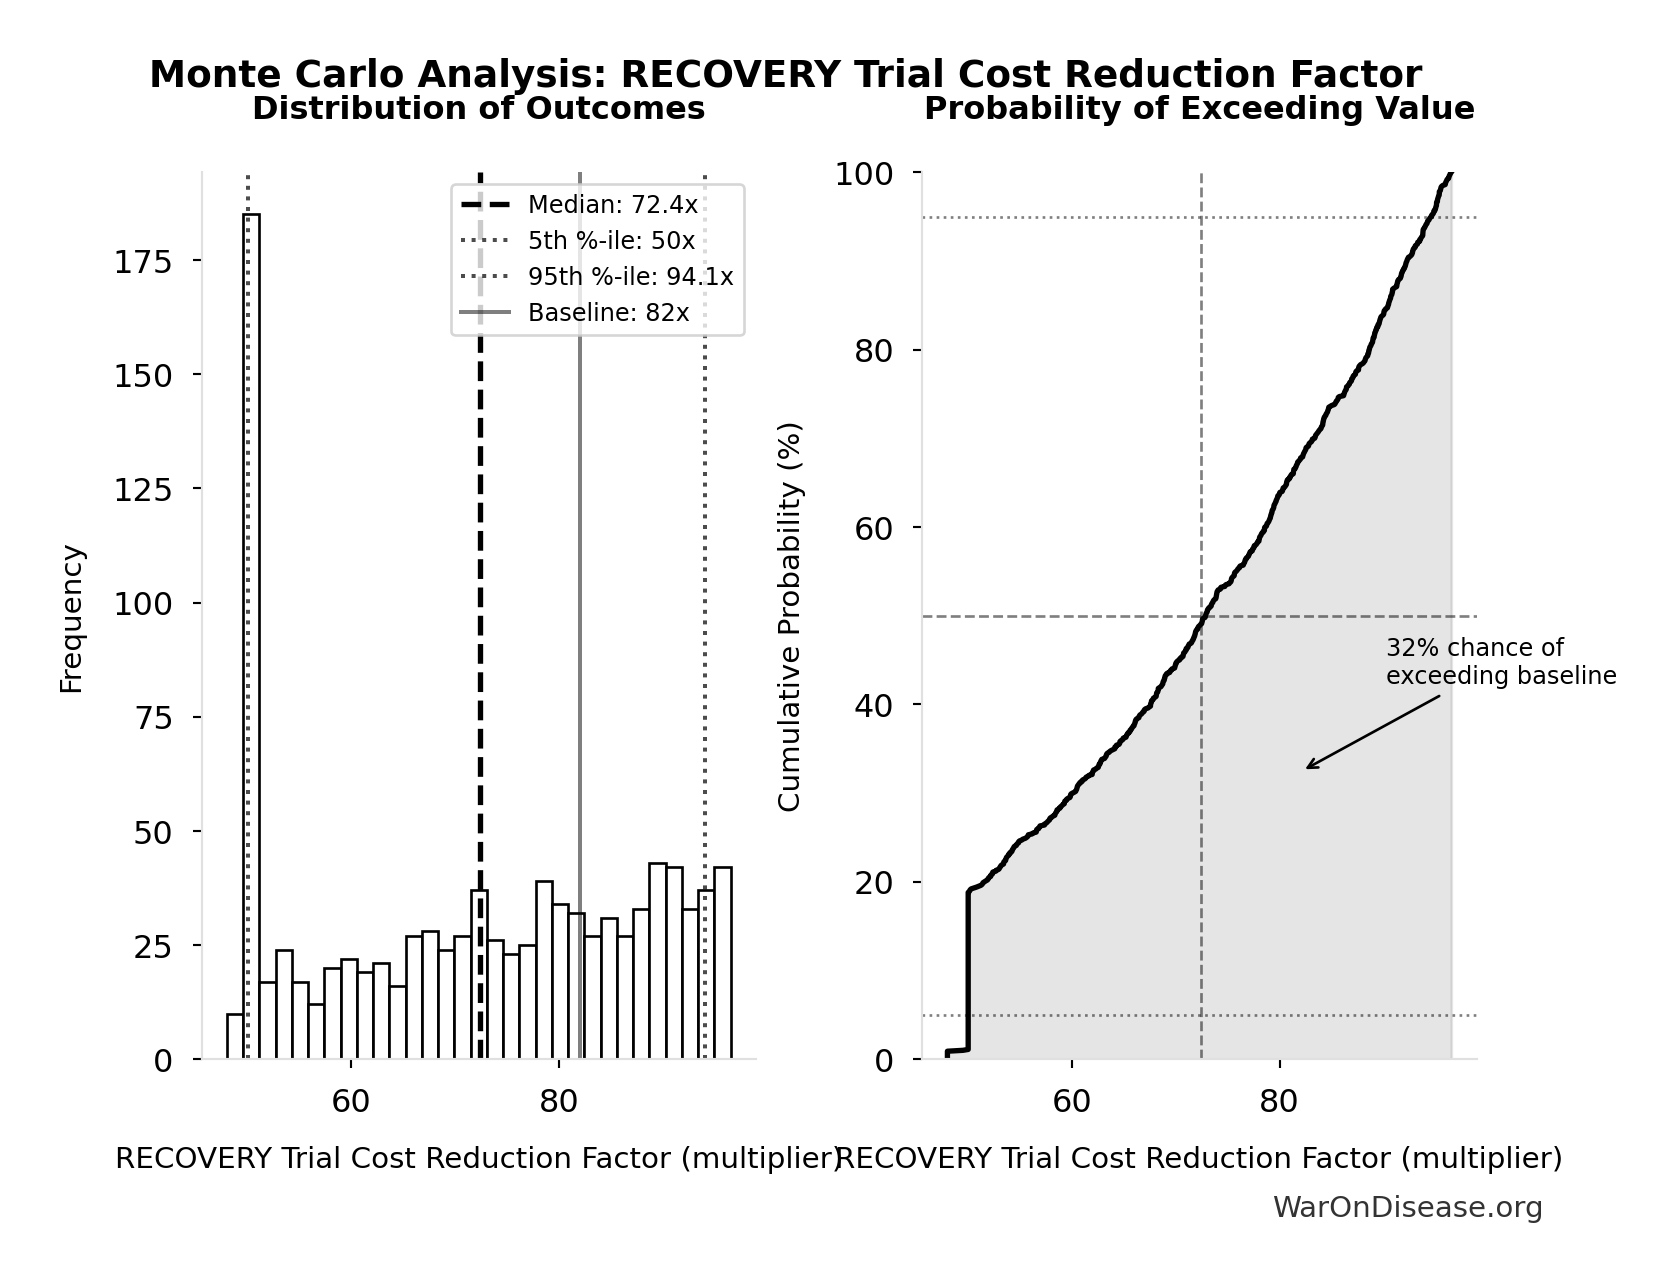
The distribution below shows the uncertainty range for the cost reduction factor based on empirical data from 108+ pragmatic trials:
Simulation Results Summary: RECOVERY Trial Cost Reduction Factor
| Baseline (deterministic) |
82x |
| Mean (expected value) |
84.2x |
| Median (50th percentile) |
69.2x |
| Standard Deviation |
54.5x |
| 90% Range (5th-95th percentile) |
[21.4x, 195x] |
The histogram shows 1,000 of the 10,000 Monte Carlo draws for RECOVERY Trial Cost Reduction Factor; the summary statistics use all 10,000. The exceedance curve (right) shows the probability of the outcome exceeding any given value.
ROI Calculation
In human language: “How much value is generated per dollar spent?”
Conservative scenario (only counting R&D efficiency, ignoring everything else):
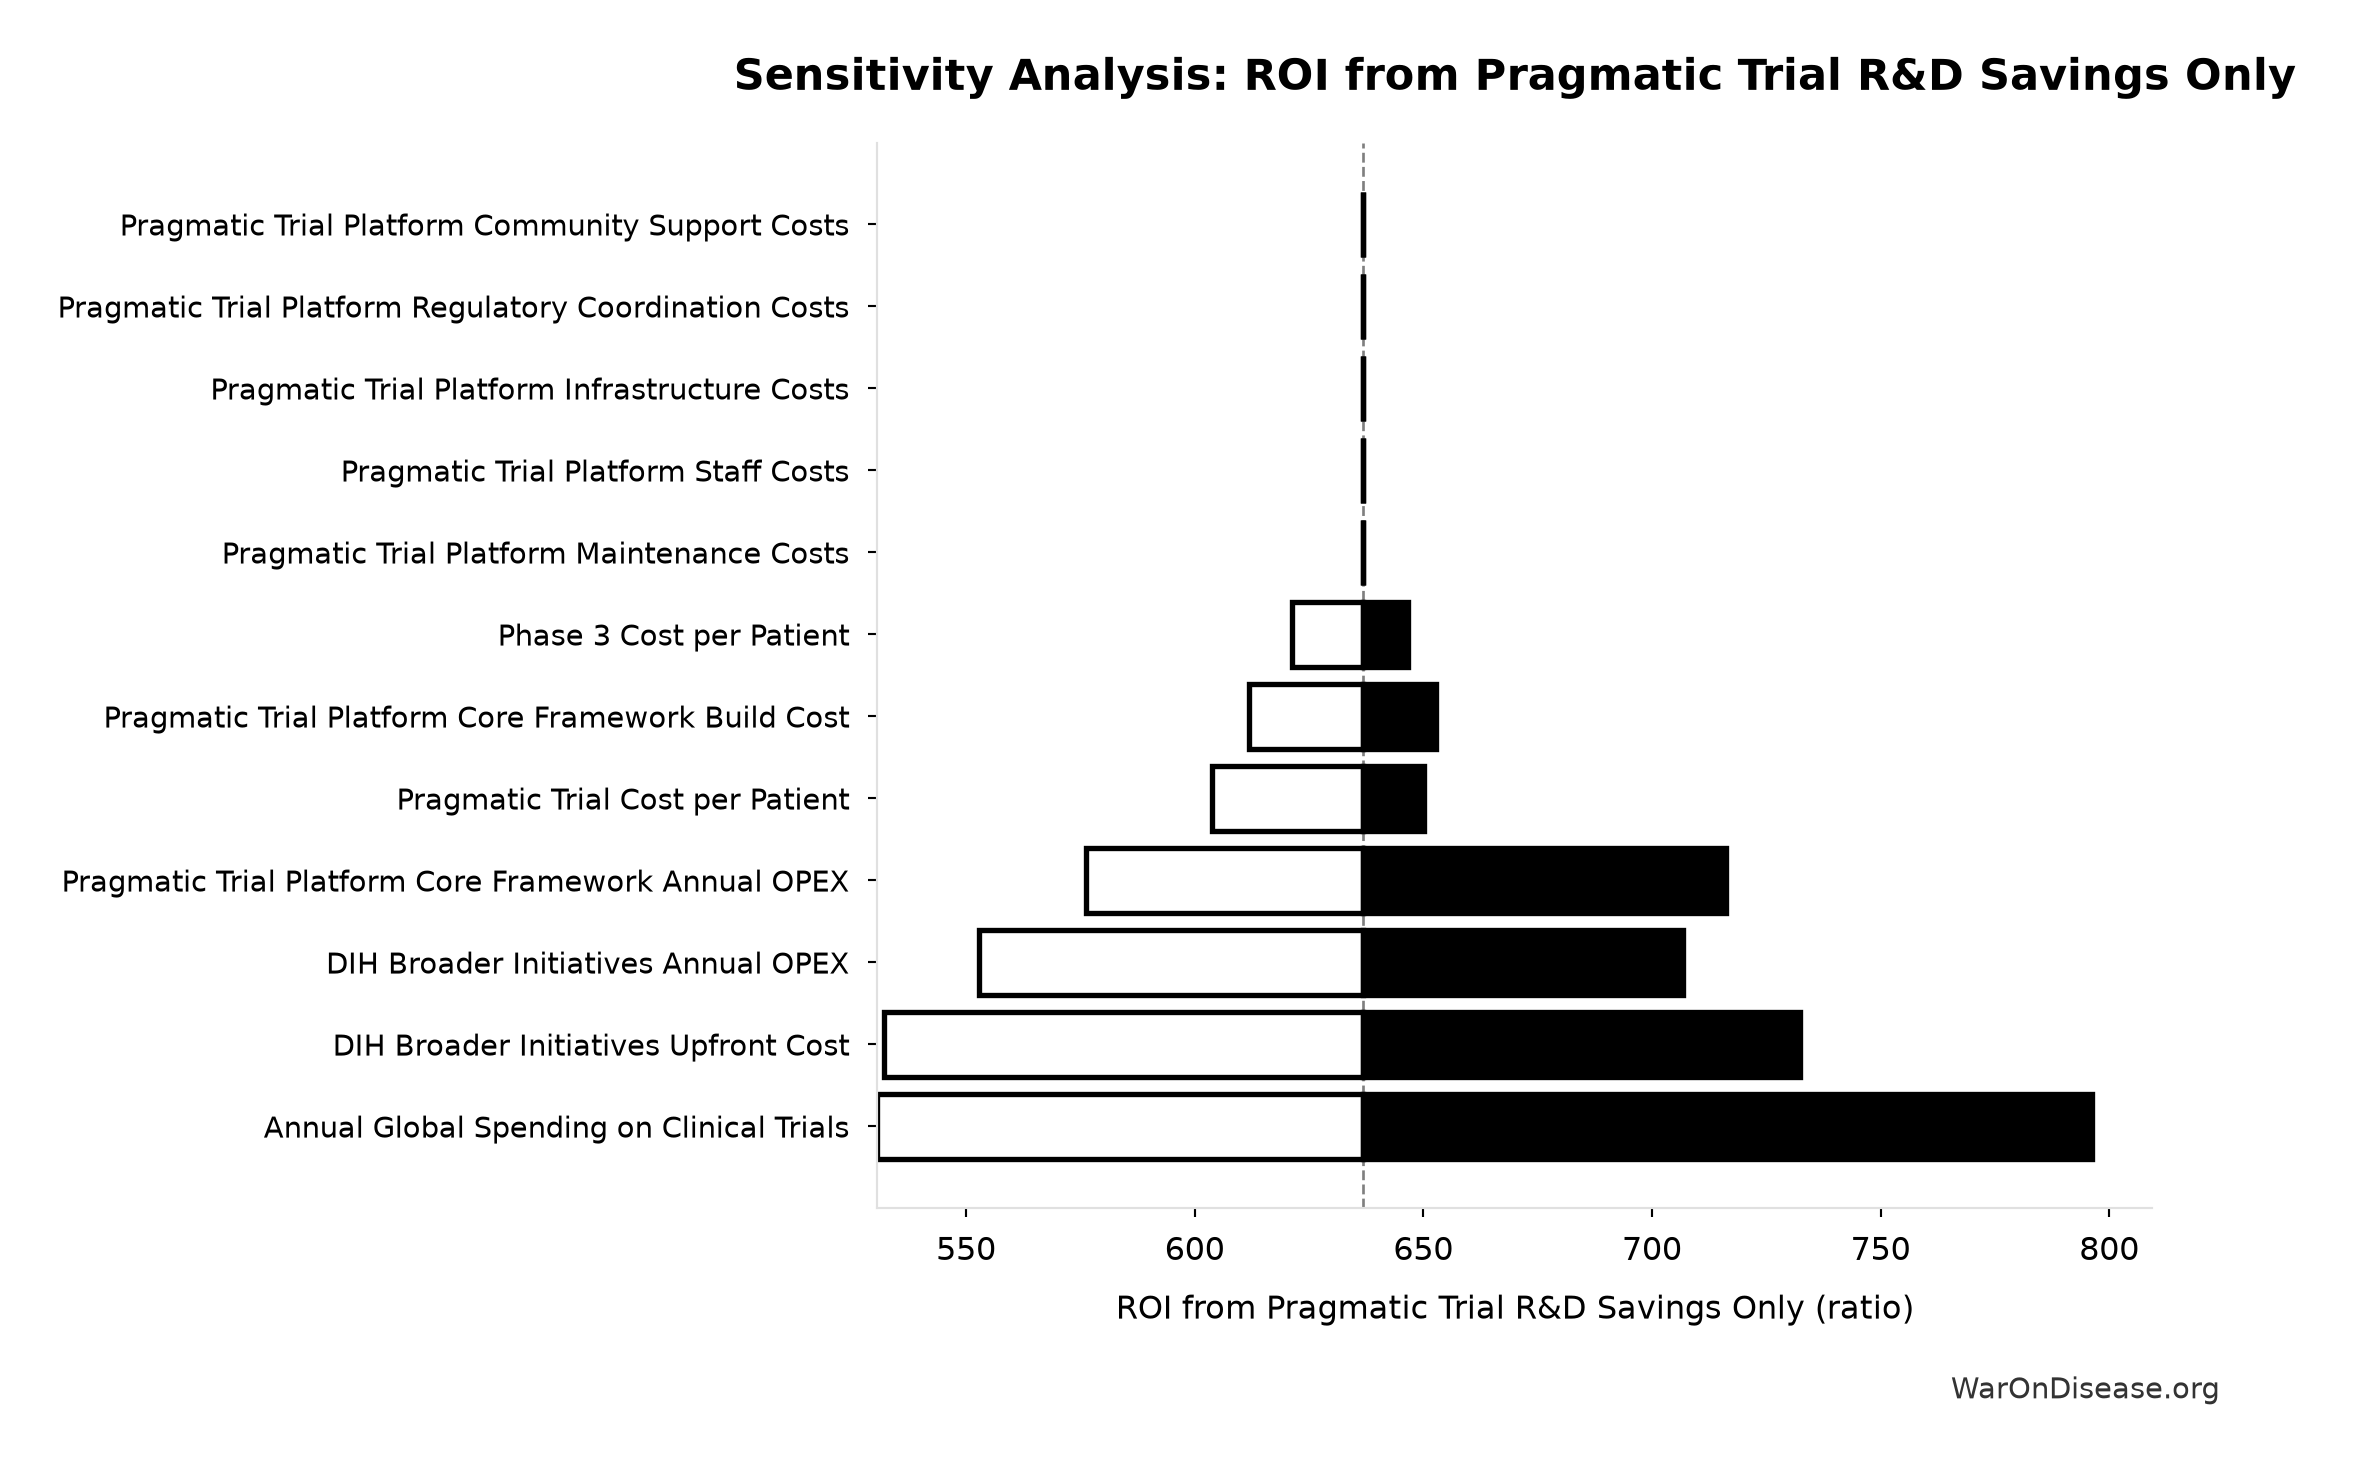
Spending $1 returns 439 (90% CI: 321-600):1.
Complete scenario (PRIMARY estimate including all core benefits):
A $1 billion campaign investment could plausibly generate: (1) a 212 years (90% CI: 124 years-398 years) average timeline shift (the average disease treatment becomes available 212 years (90% CI: 124 years-398 years) earlier), plus (2) $154 billion (90% CI: $137 billion-$172 billion)/year in recurring economic benefits (peace dividend + R&D savings).
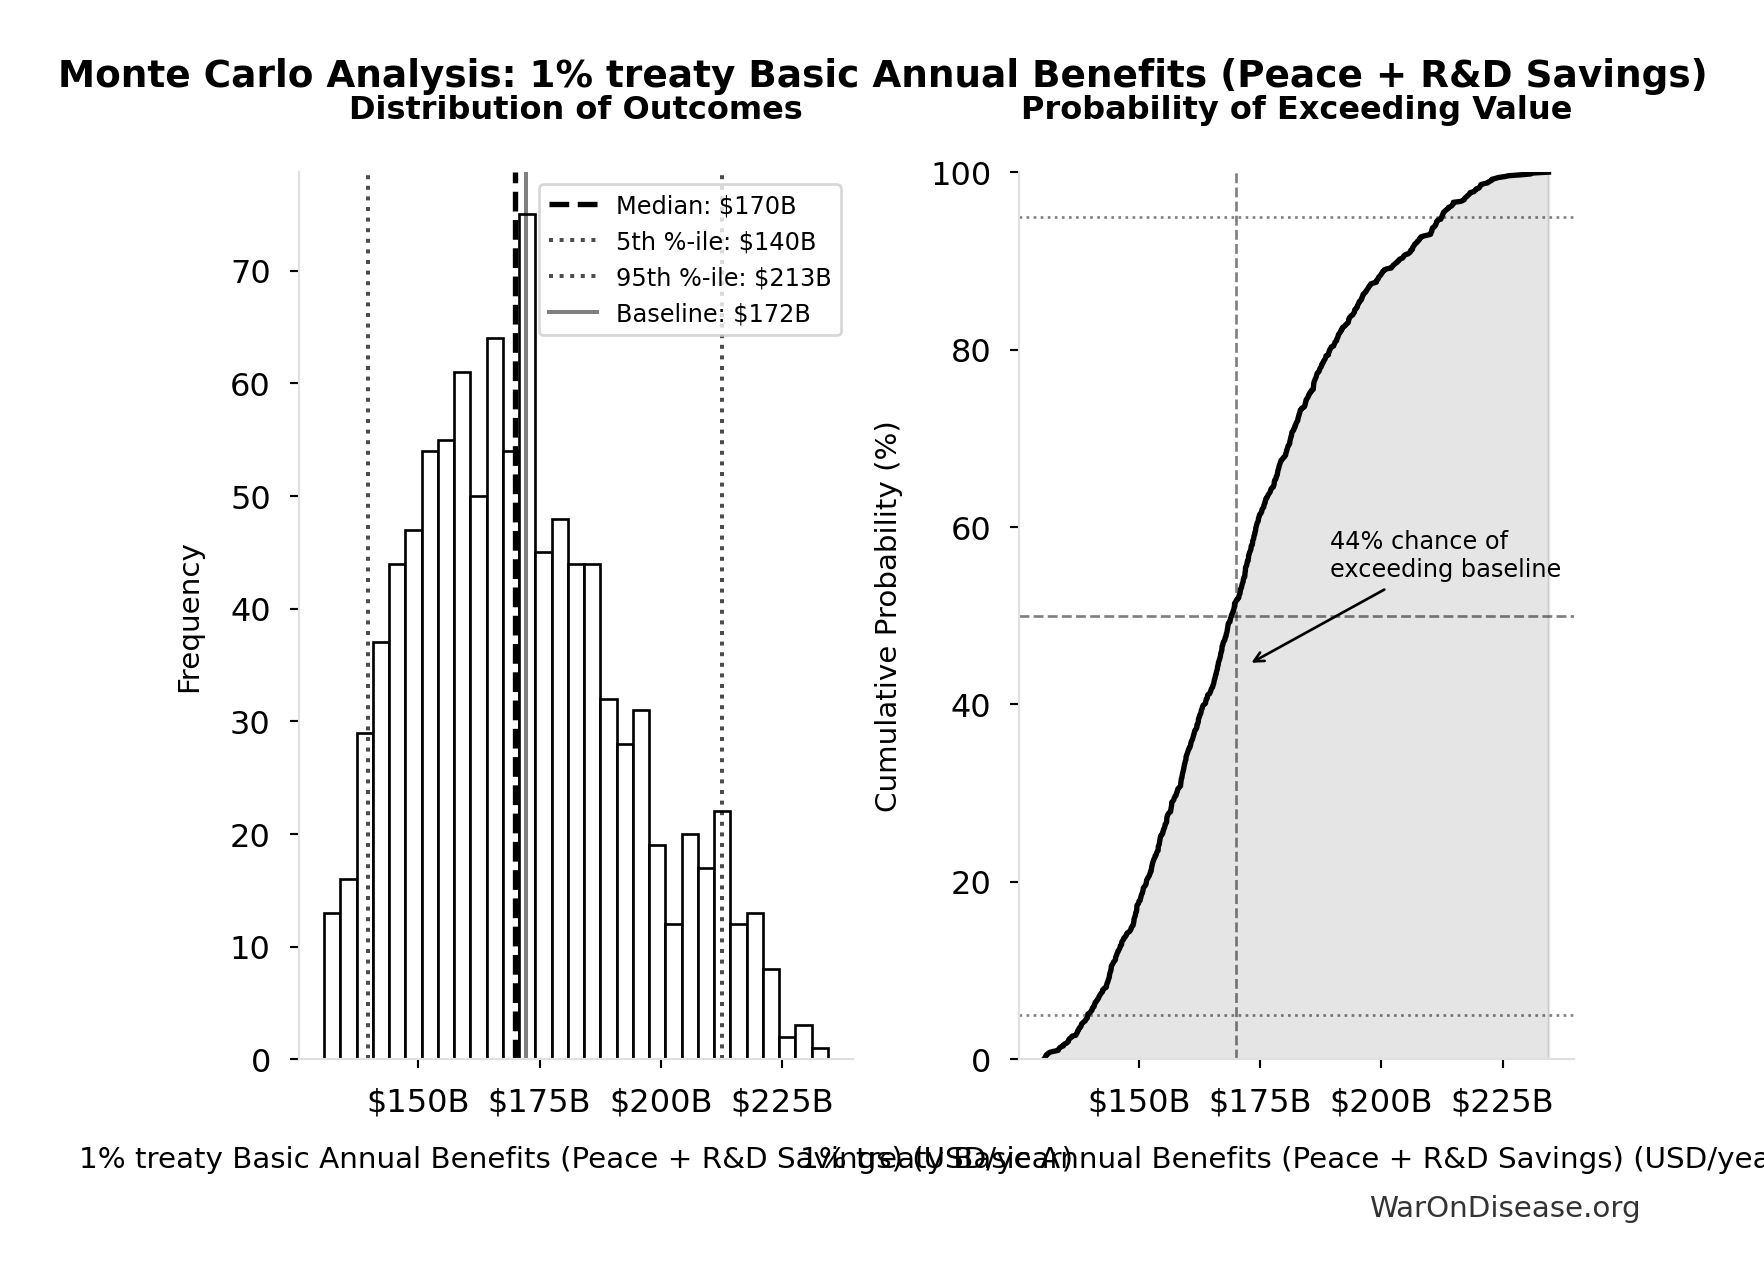
Combined Annual Benefits Uncertainty
The recurring annual benefits combine two streams: peace dividend ($114 billion (90% CI: $99.6 billion-$129 billion)/year) and R&D savings ($40.5 billion (90% CI: $31.4 billion-$51.5 billion)/year).
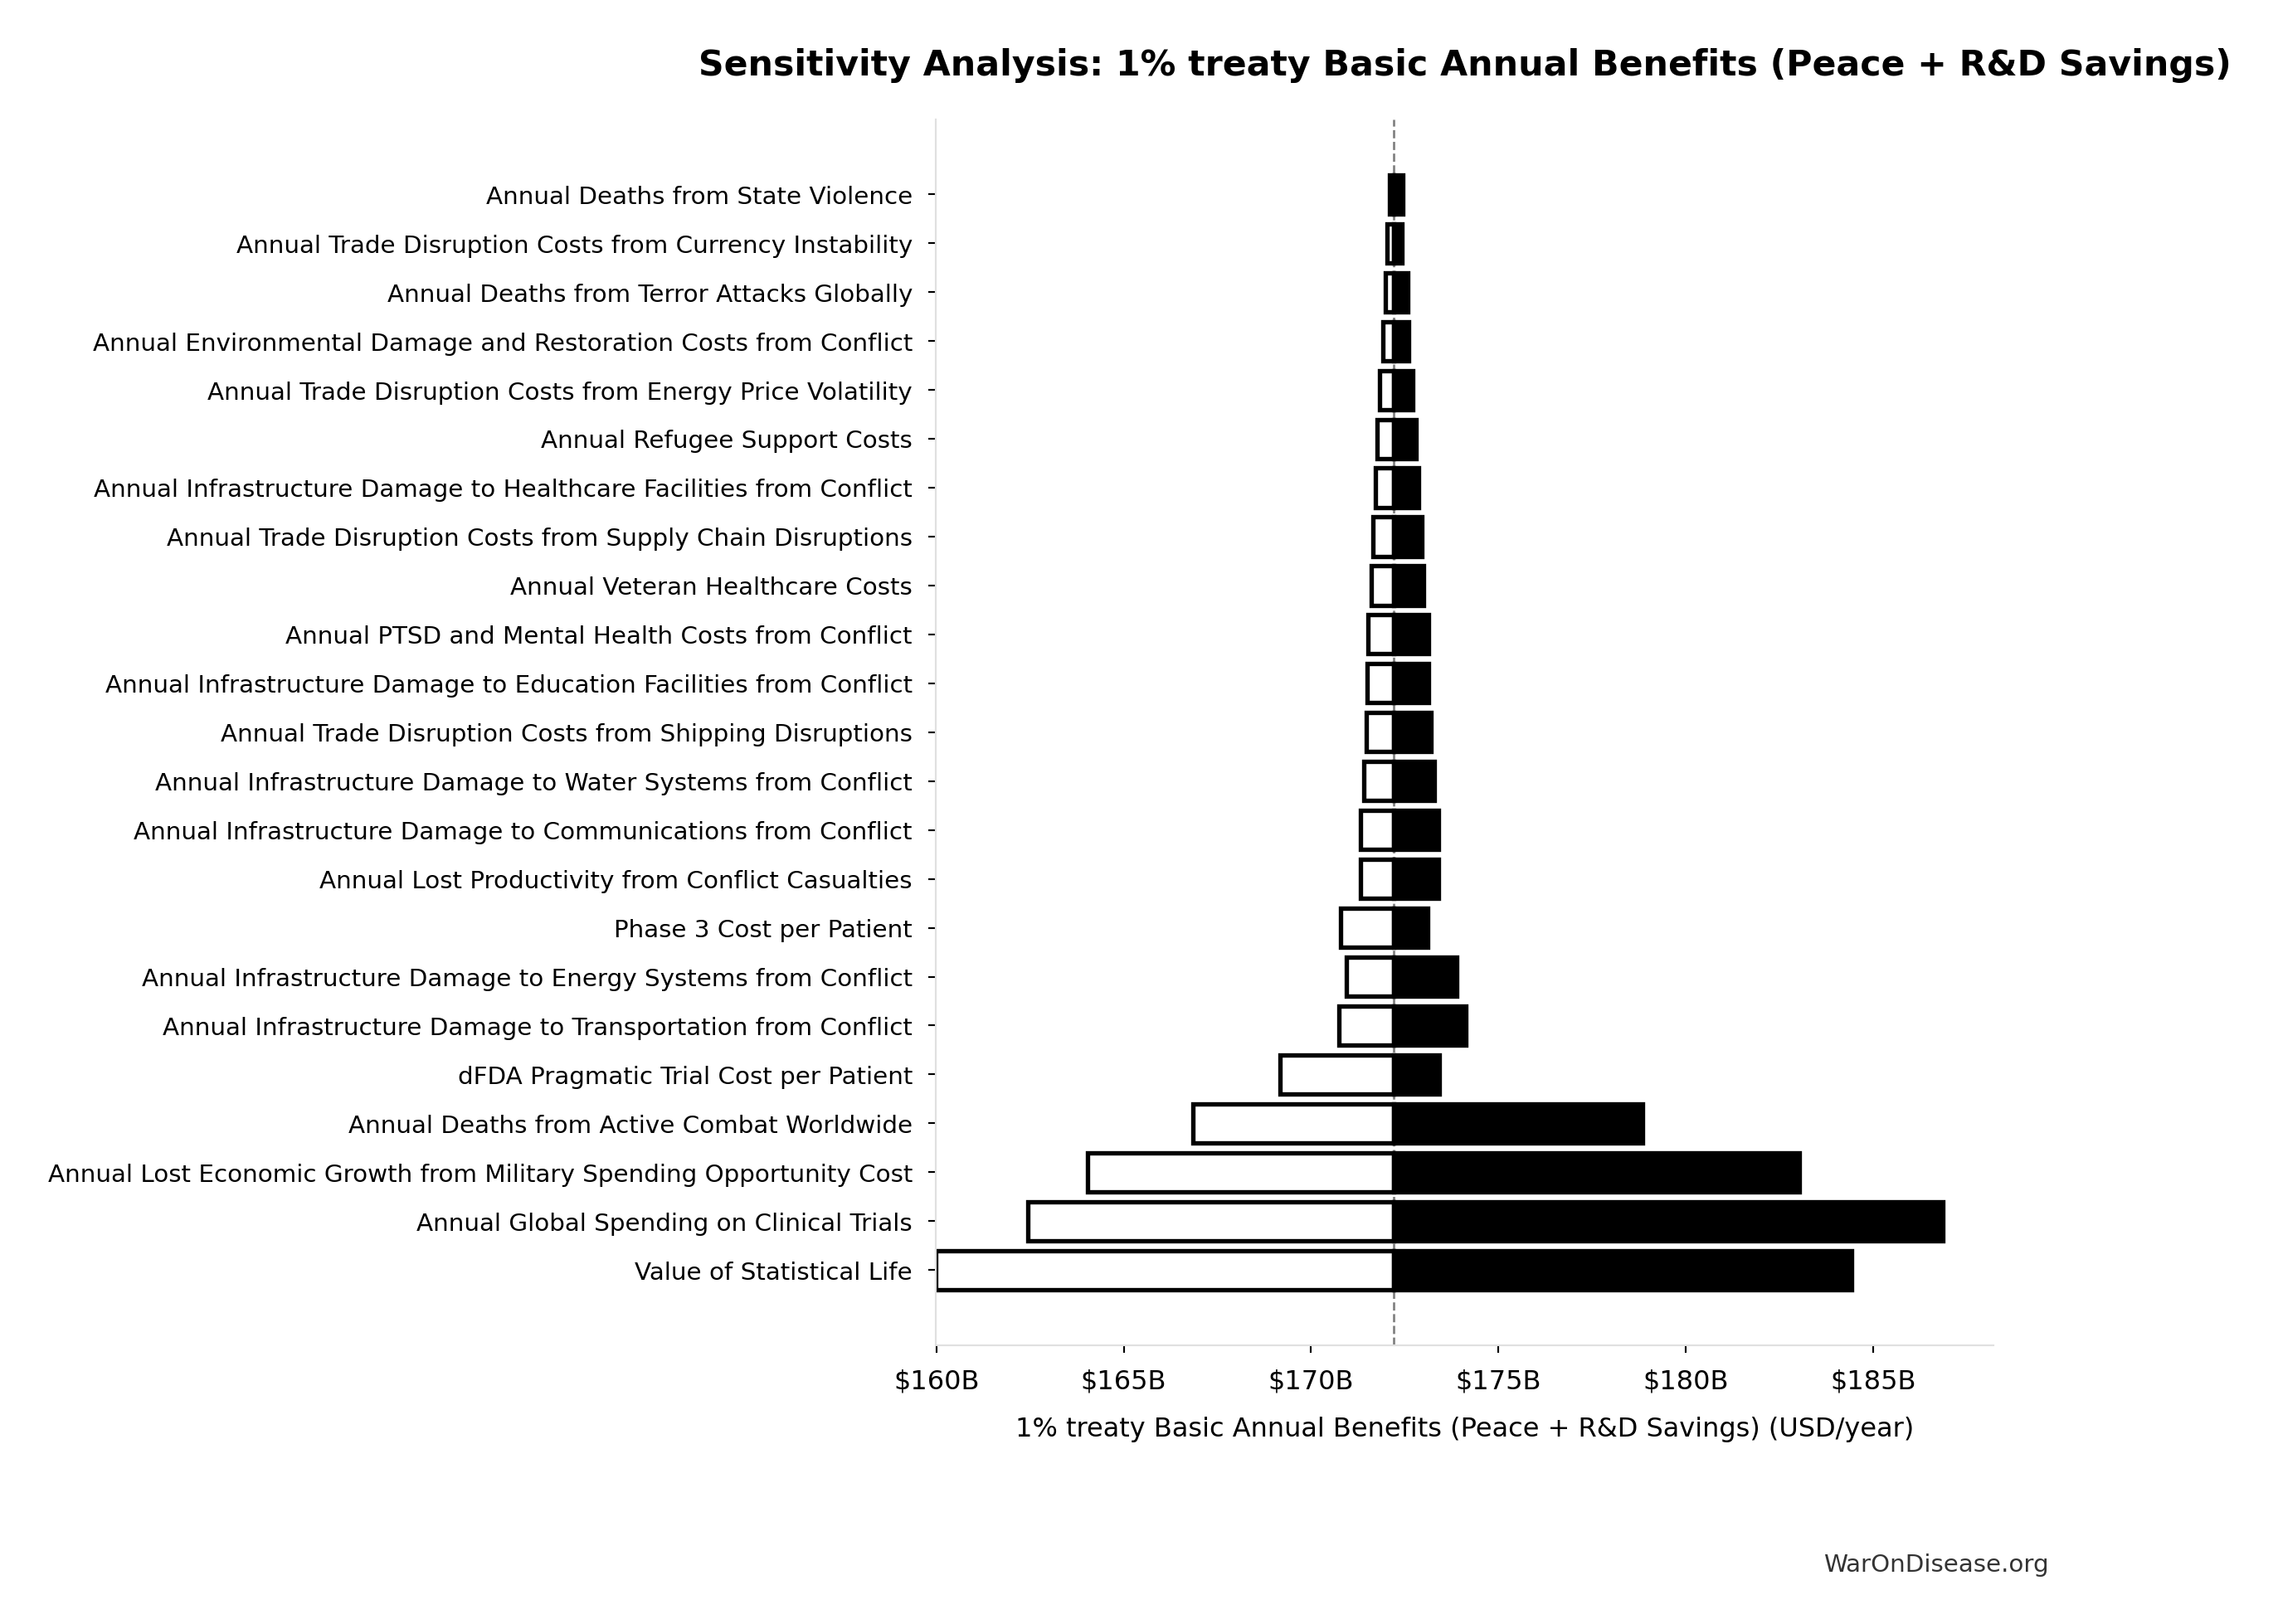
The tornado diagram shows that peace dividend magnitude and R&D savings dominate the uncertainty in combined annual benefits.
Simulation Results Summary: 1% treaty Basic Annual Benefits (Peace + R&D Savings)
| Baseline (deterministic) |
$154 billion |
| Mean (expected value) |
$154 billion |
| Median (50th percentile) |
$153 billion |
| Standard Deviation |
$10.7 billion |
| 90% Range (5th-95th percentile) |
[$137 billion, $172 billion] |
The histogram shows 1,000 of the 10,000 Monte Carlo draws for 1% treaty Basic Annual Benefits (Peace + R&D Savings); the summary statistics use all 10,000. The exceedance curve (right) shows the probability of the outcome exceeding any given value.
Monte Carlo analysis confirms the intervention generates tens of billions in recurring annual value across all plausible scenarios.
Cost-Effectiveness Analysis
Health economists measure cost-effectiveness as cost per DALY (Disability-Adjusted Life Year): how much does it cost to avert one year of disease burden?
WHO says interventions under $50,000134 per DALY are “cost-effective.” Most successful health programs cost $3,000-10,000134 per DALY.
This system’s upfront cost: $0.00177 (90% CI: $0.000809-$0.00354) per DALY
But here’s the key: this intervention is cost-saving. The upfront implementation cost of $0.00177 (90% CI: $0.000809-$0.00354)/DALY unlocks $154 billion (90% CI: $137 billion-$172 billion)/year in recurring economic benefits.
Technical note: This uses “net present value,” which is economist code for “future money is worth less than current money” (3% discount rate). For detailed analysis: full NPV methodology here.
Pragmatic Trials vs. NIH Standard Research
NIH Standard Research (Current Status Quo):
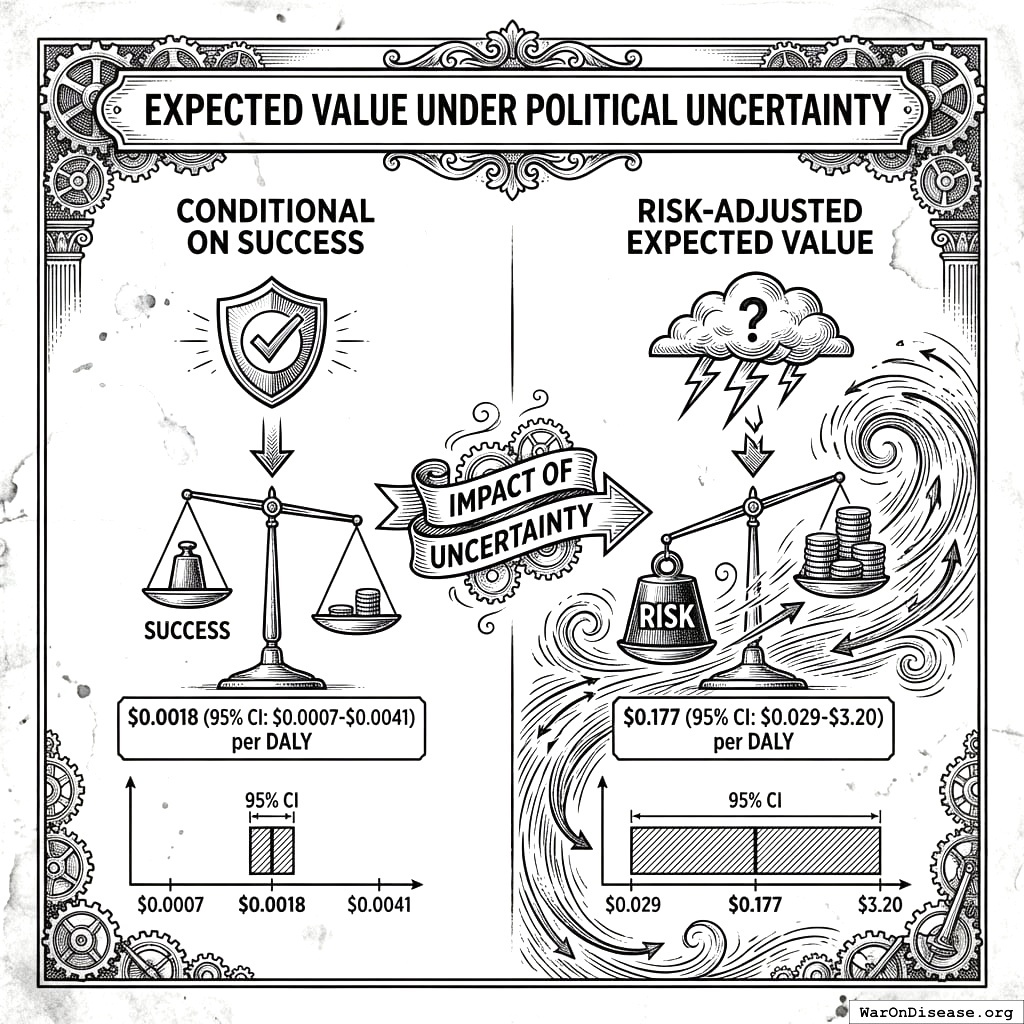
Expected Value Under Political Uncertainty
Conditional on success: $0.00177 (90% CI: $0.000809-$0.00354) per DALY
Risk-adjusted expected value: $0.177 (90% CI: $0.03-$2.92) per DALY
Uncertainty in Risk-Adjusted Cost-Effectiveness
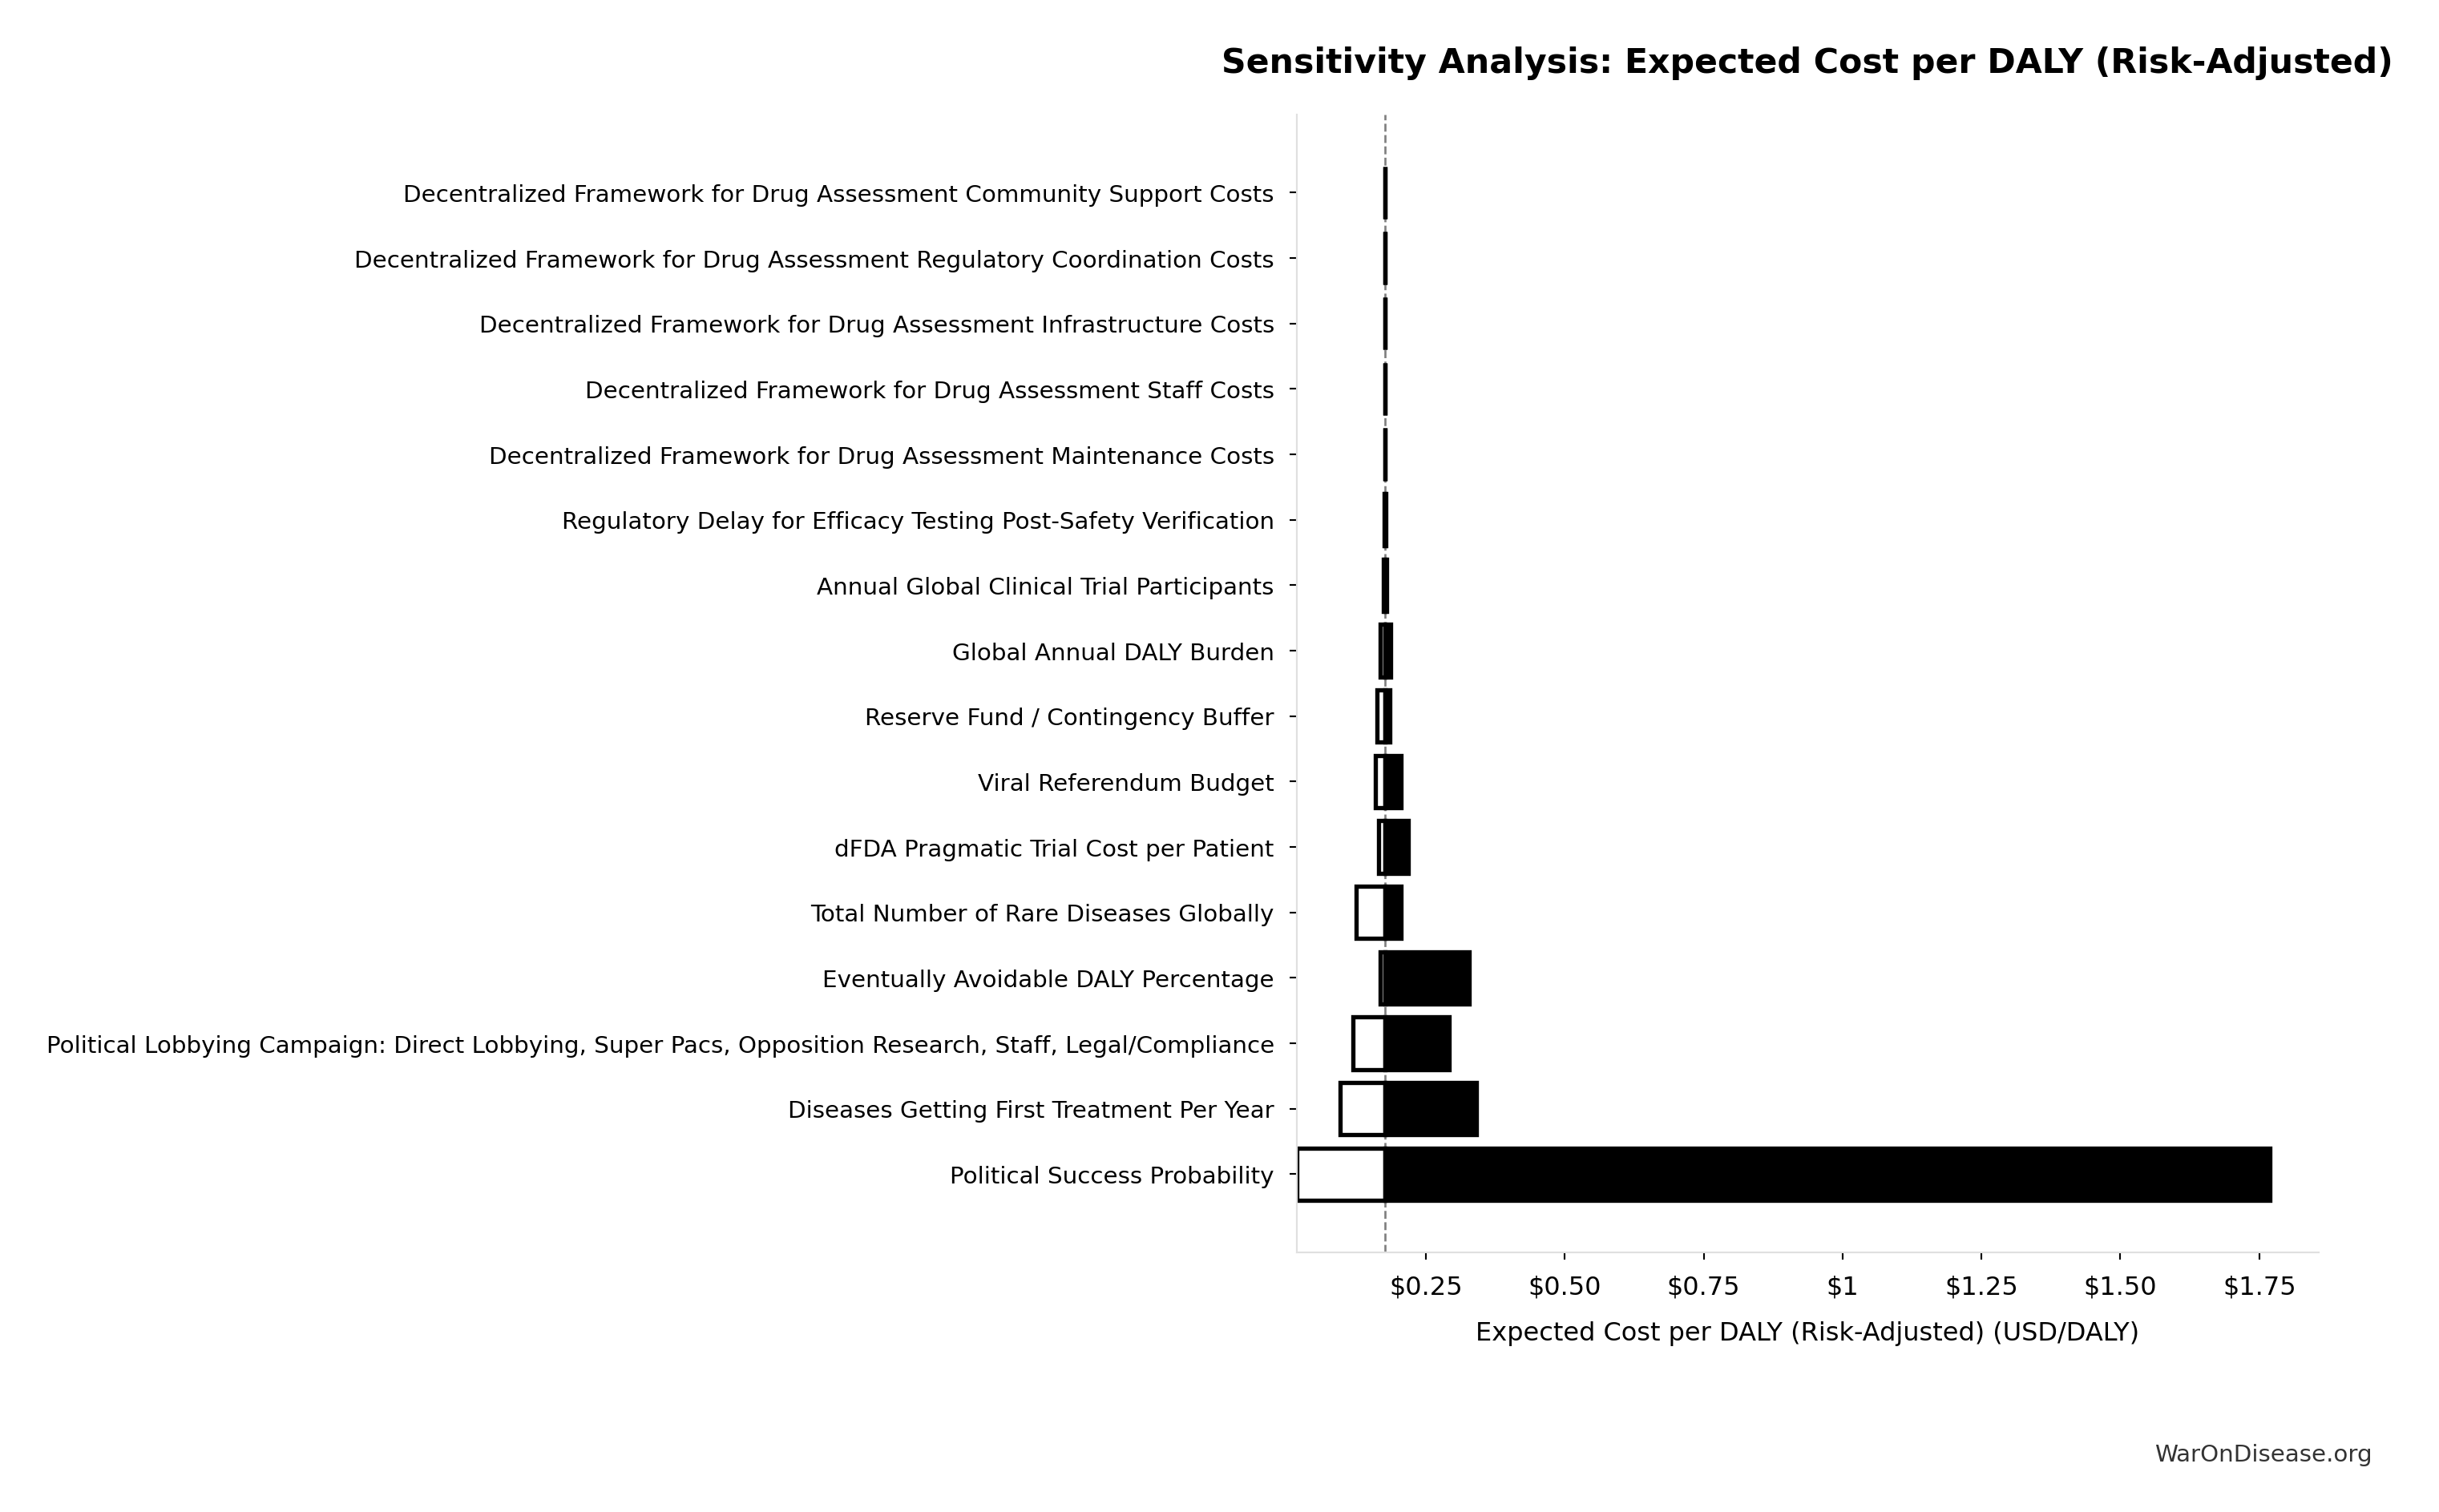
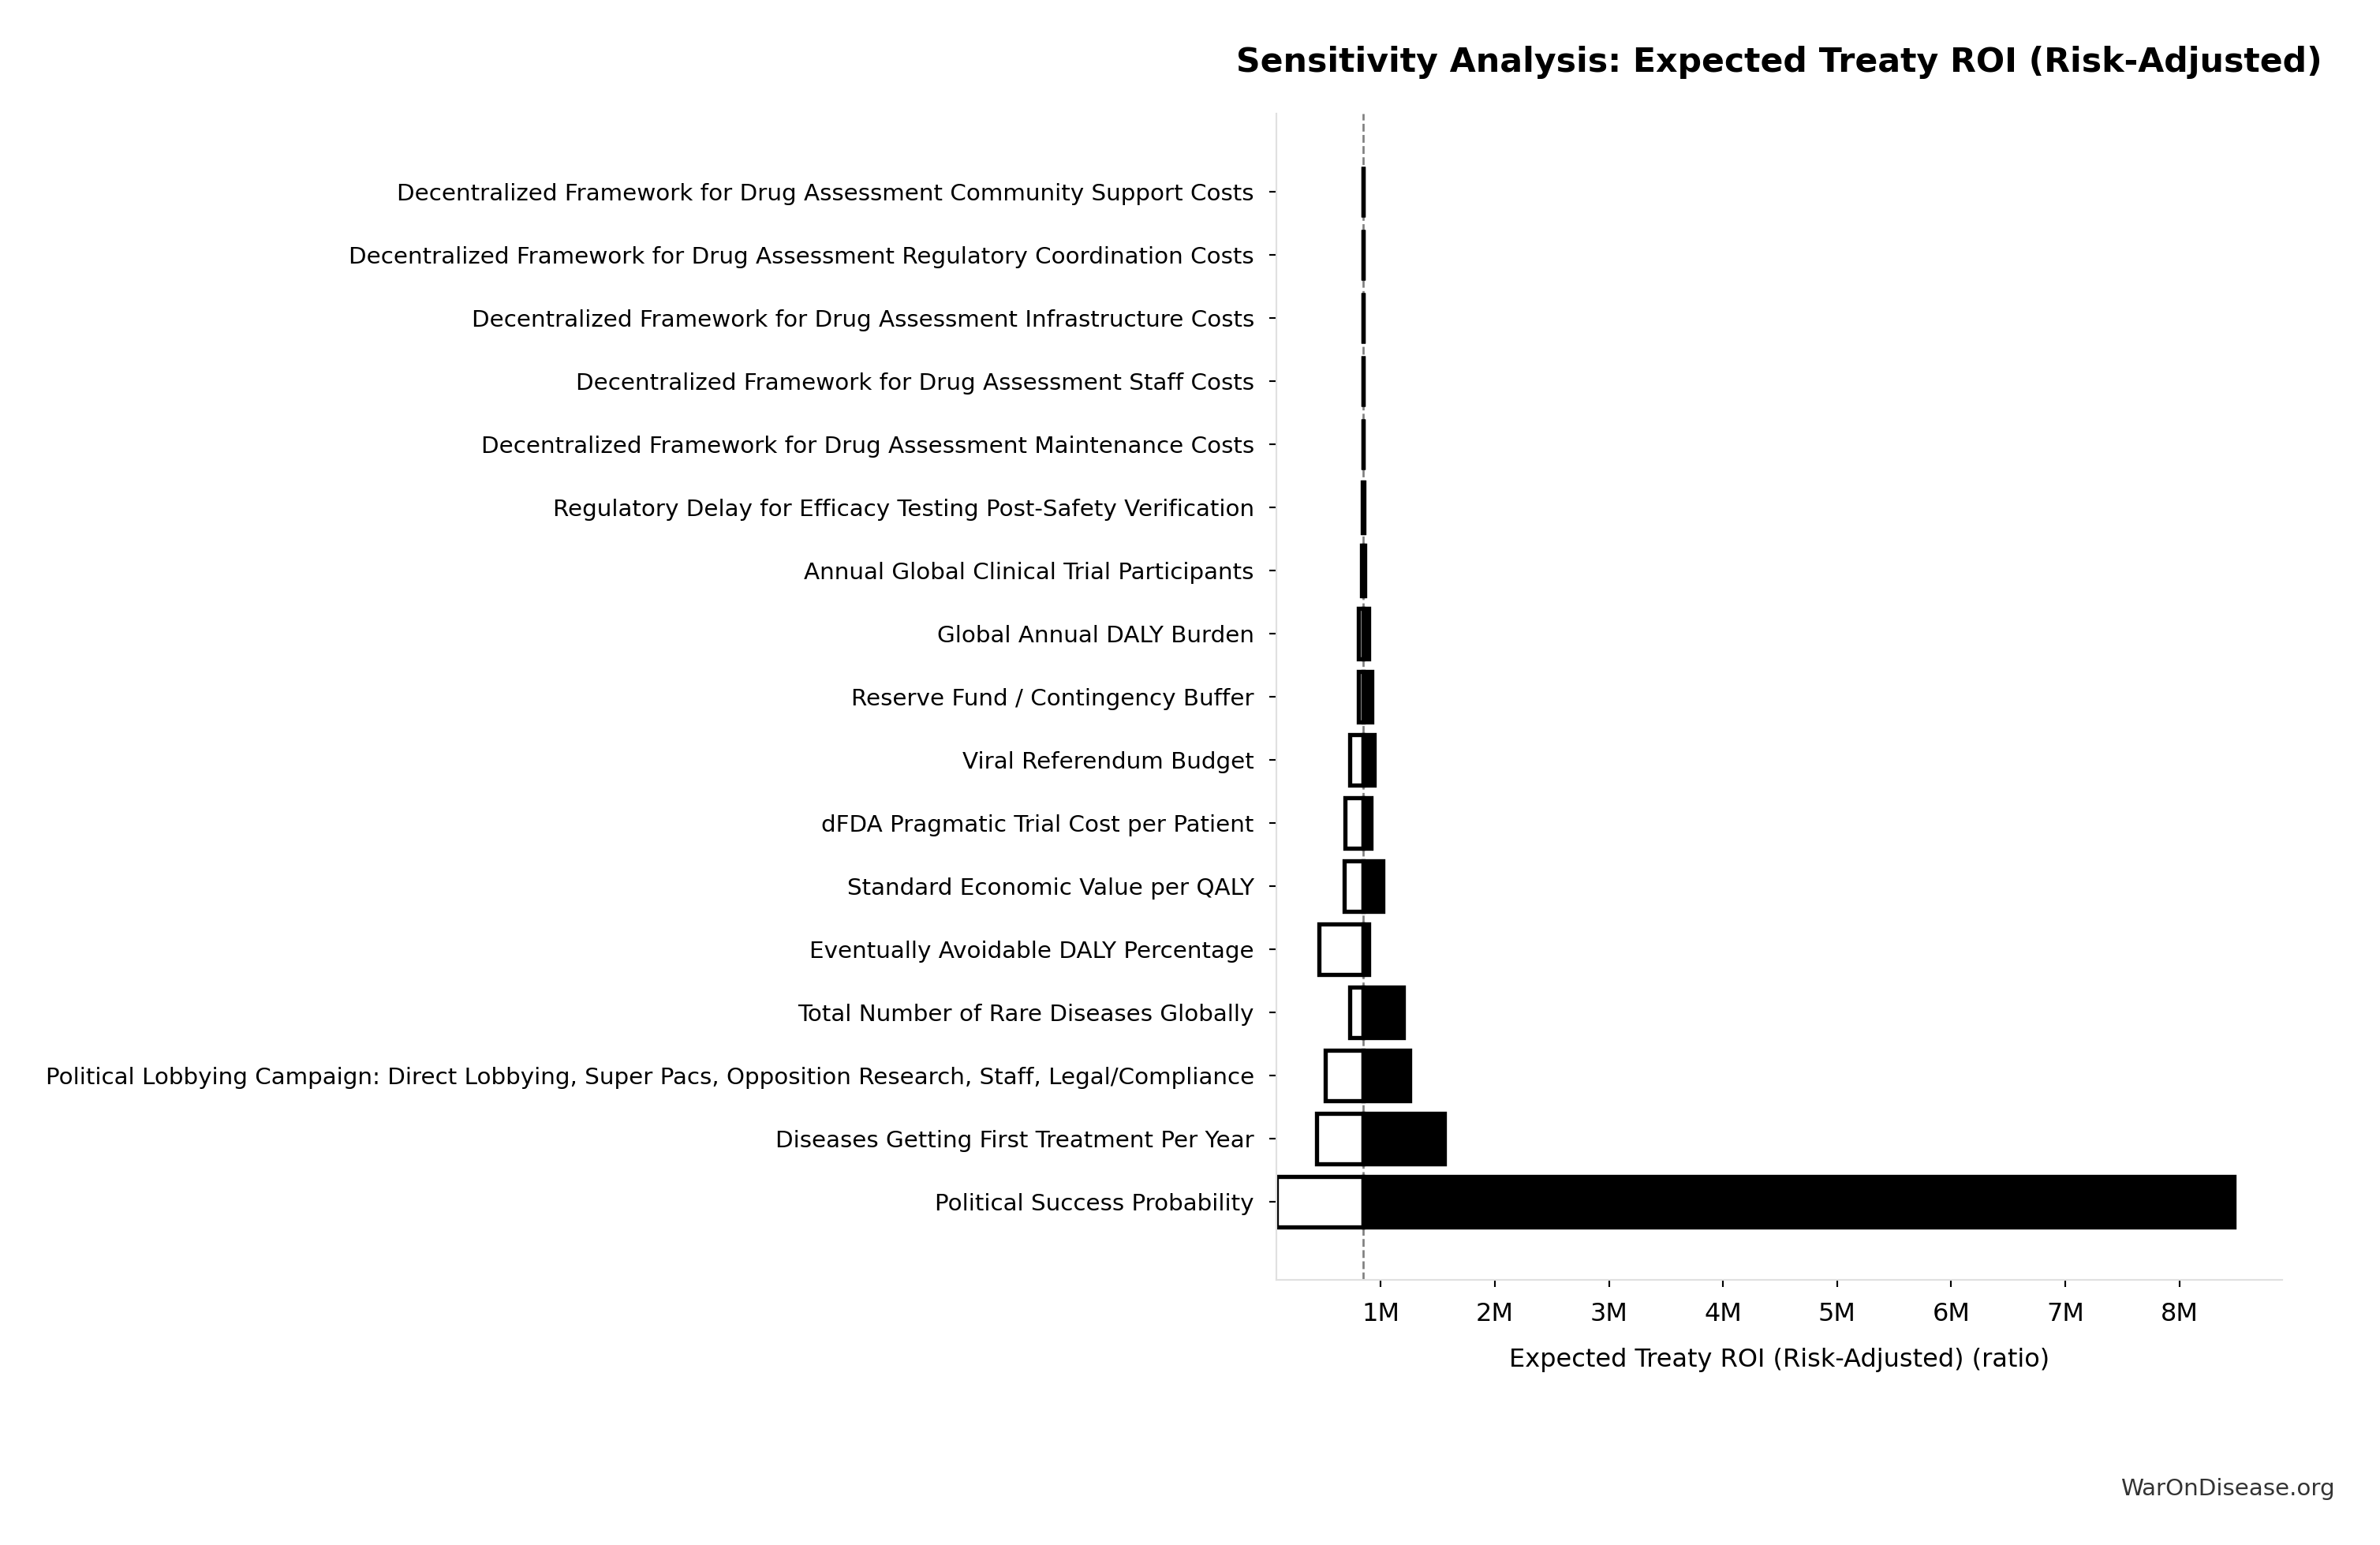
The tornado diagram shows that political success probability dominates uncertainty in risk-adjusted cost-effectiveness. Even at conservative political success estimates, expected cost per DALY remains highly competitive with top global health interventions.
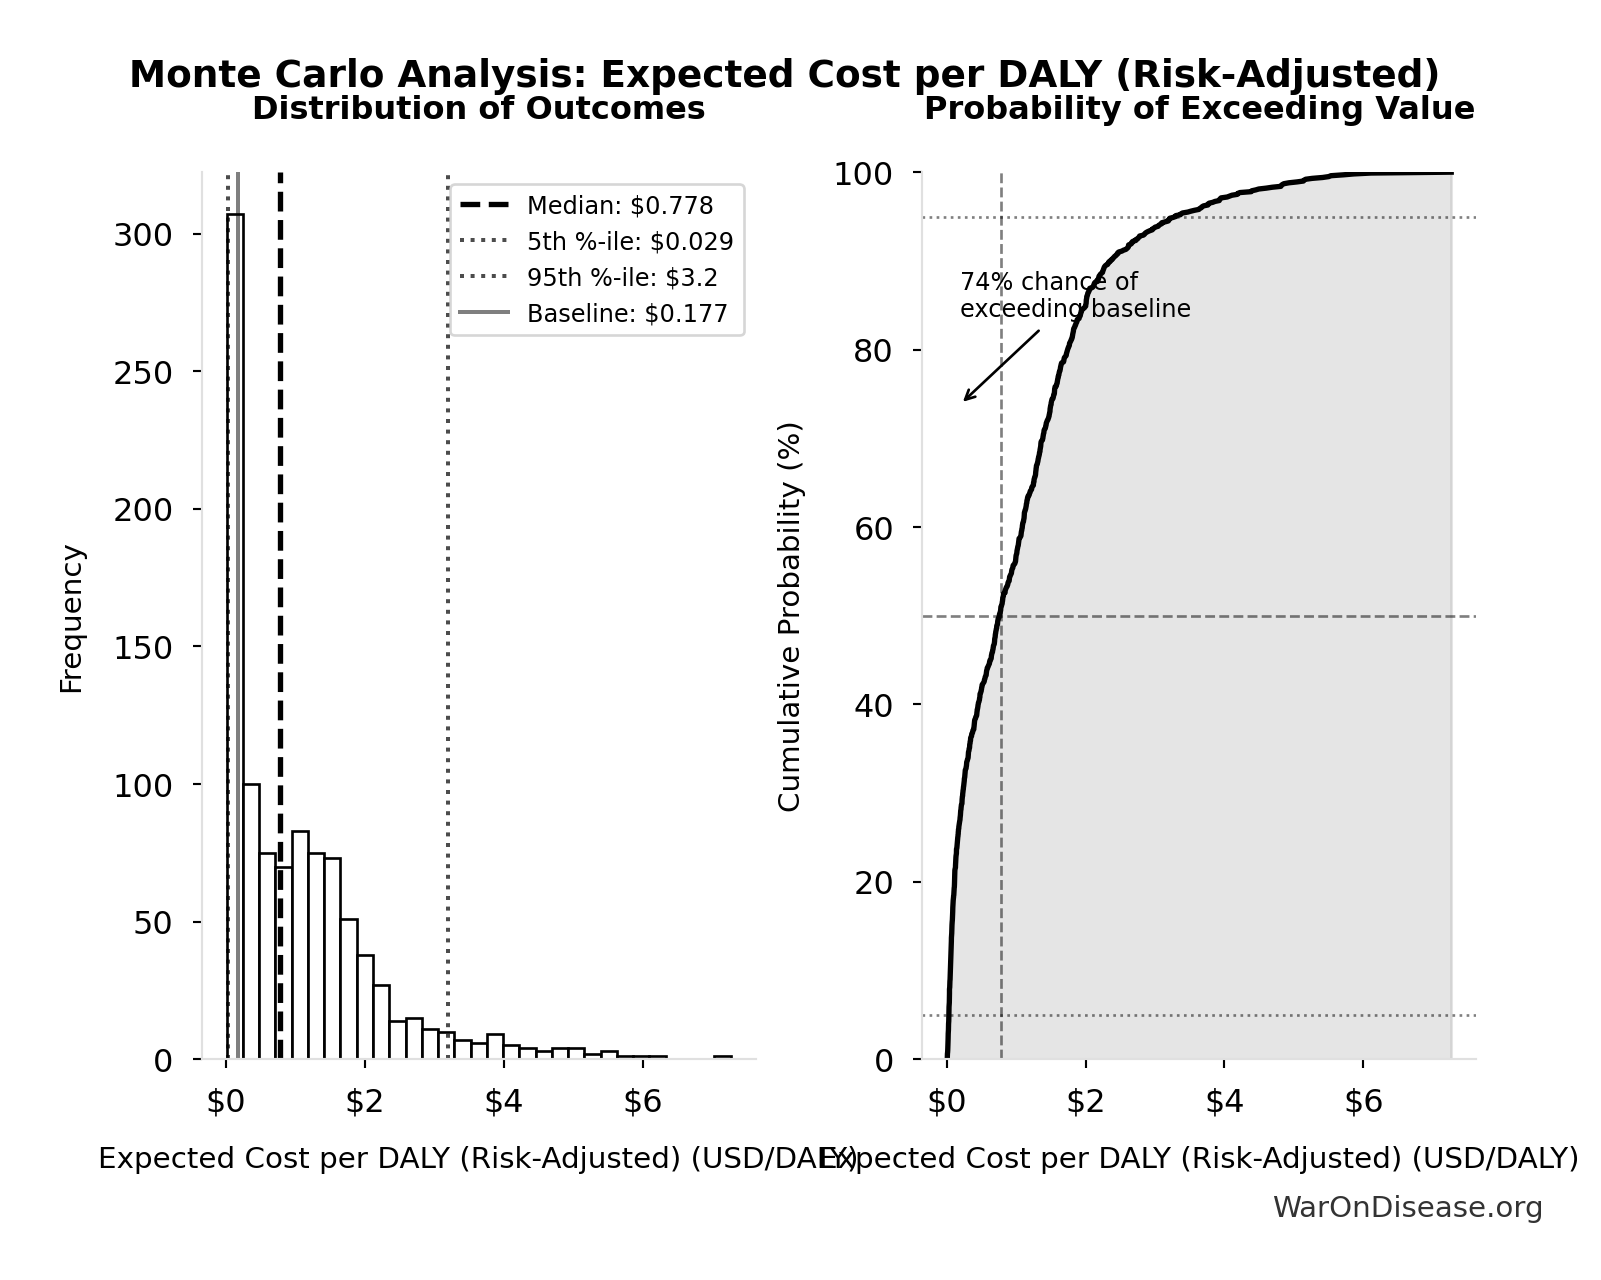
Simulation Results Summary: Expected Cost per DALY (Risk-Adjusted)
| Baseline (deterministic) |
$0.177 |
| Mean (expected value) |
$1.05 |
| Median (50th percentile) |
$0.864 |
| Standard Deviation |
$1.01 |
| 90% Range (5th-95th percentile) |
[$0.03, $2.92] |
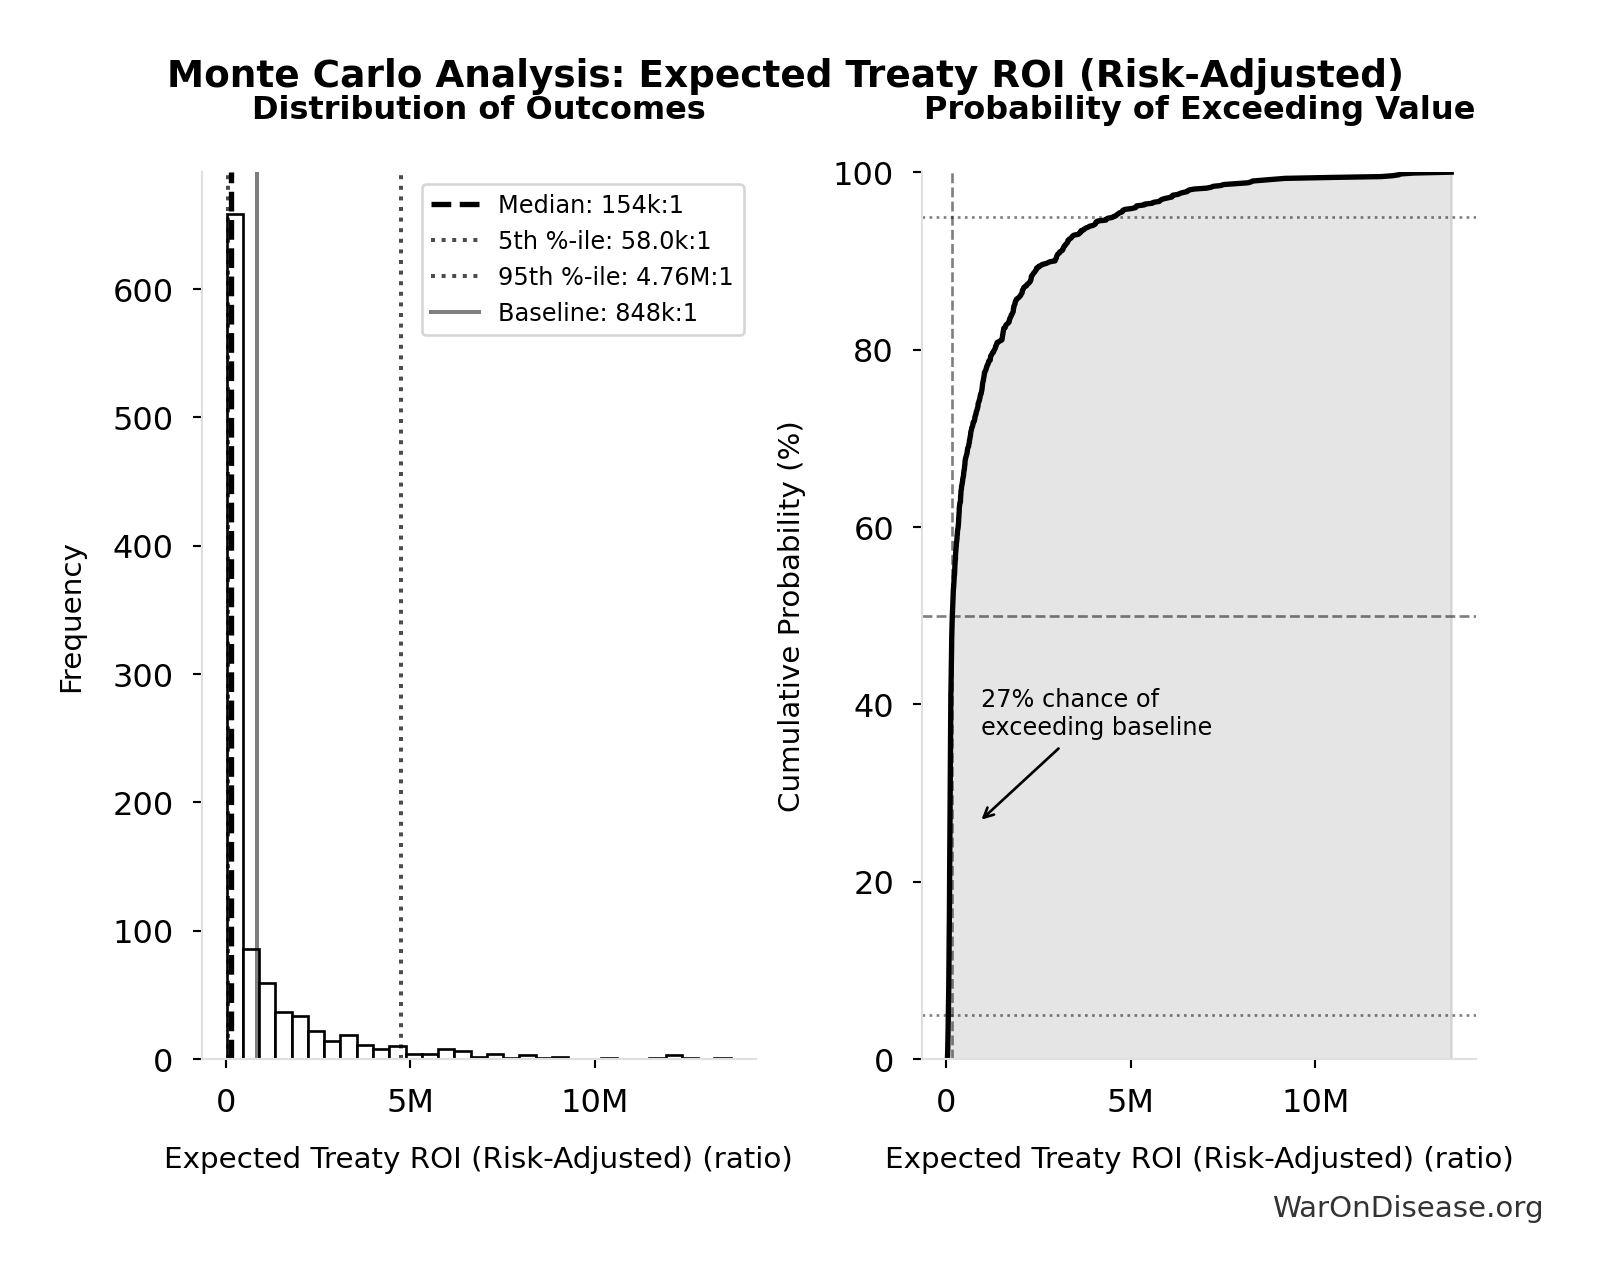
The histogram shows 1,000 of the 10,000 Monte Carlo draws for Expected Cost per DALY (Risk-Adjusted); the summary statistics use all 10,000. The exceedance curve (right) shows the probability of the outcome exceeding any given value.
Monte Carlo simulation confirms that accounting for political risk, the 95% confidence interval maintains dominance over established interventions.
Uncertainty in Cost-Effectiveness (Conditional on Success)
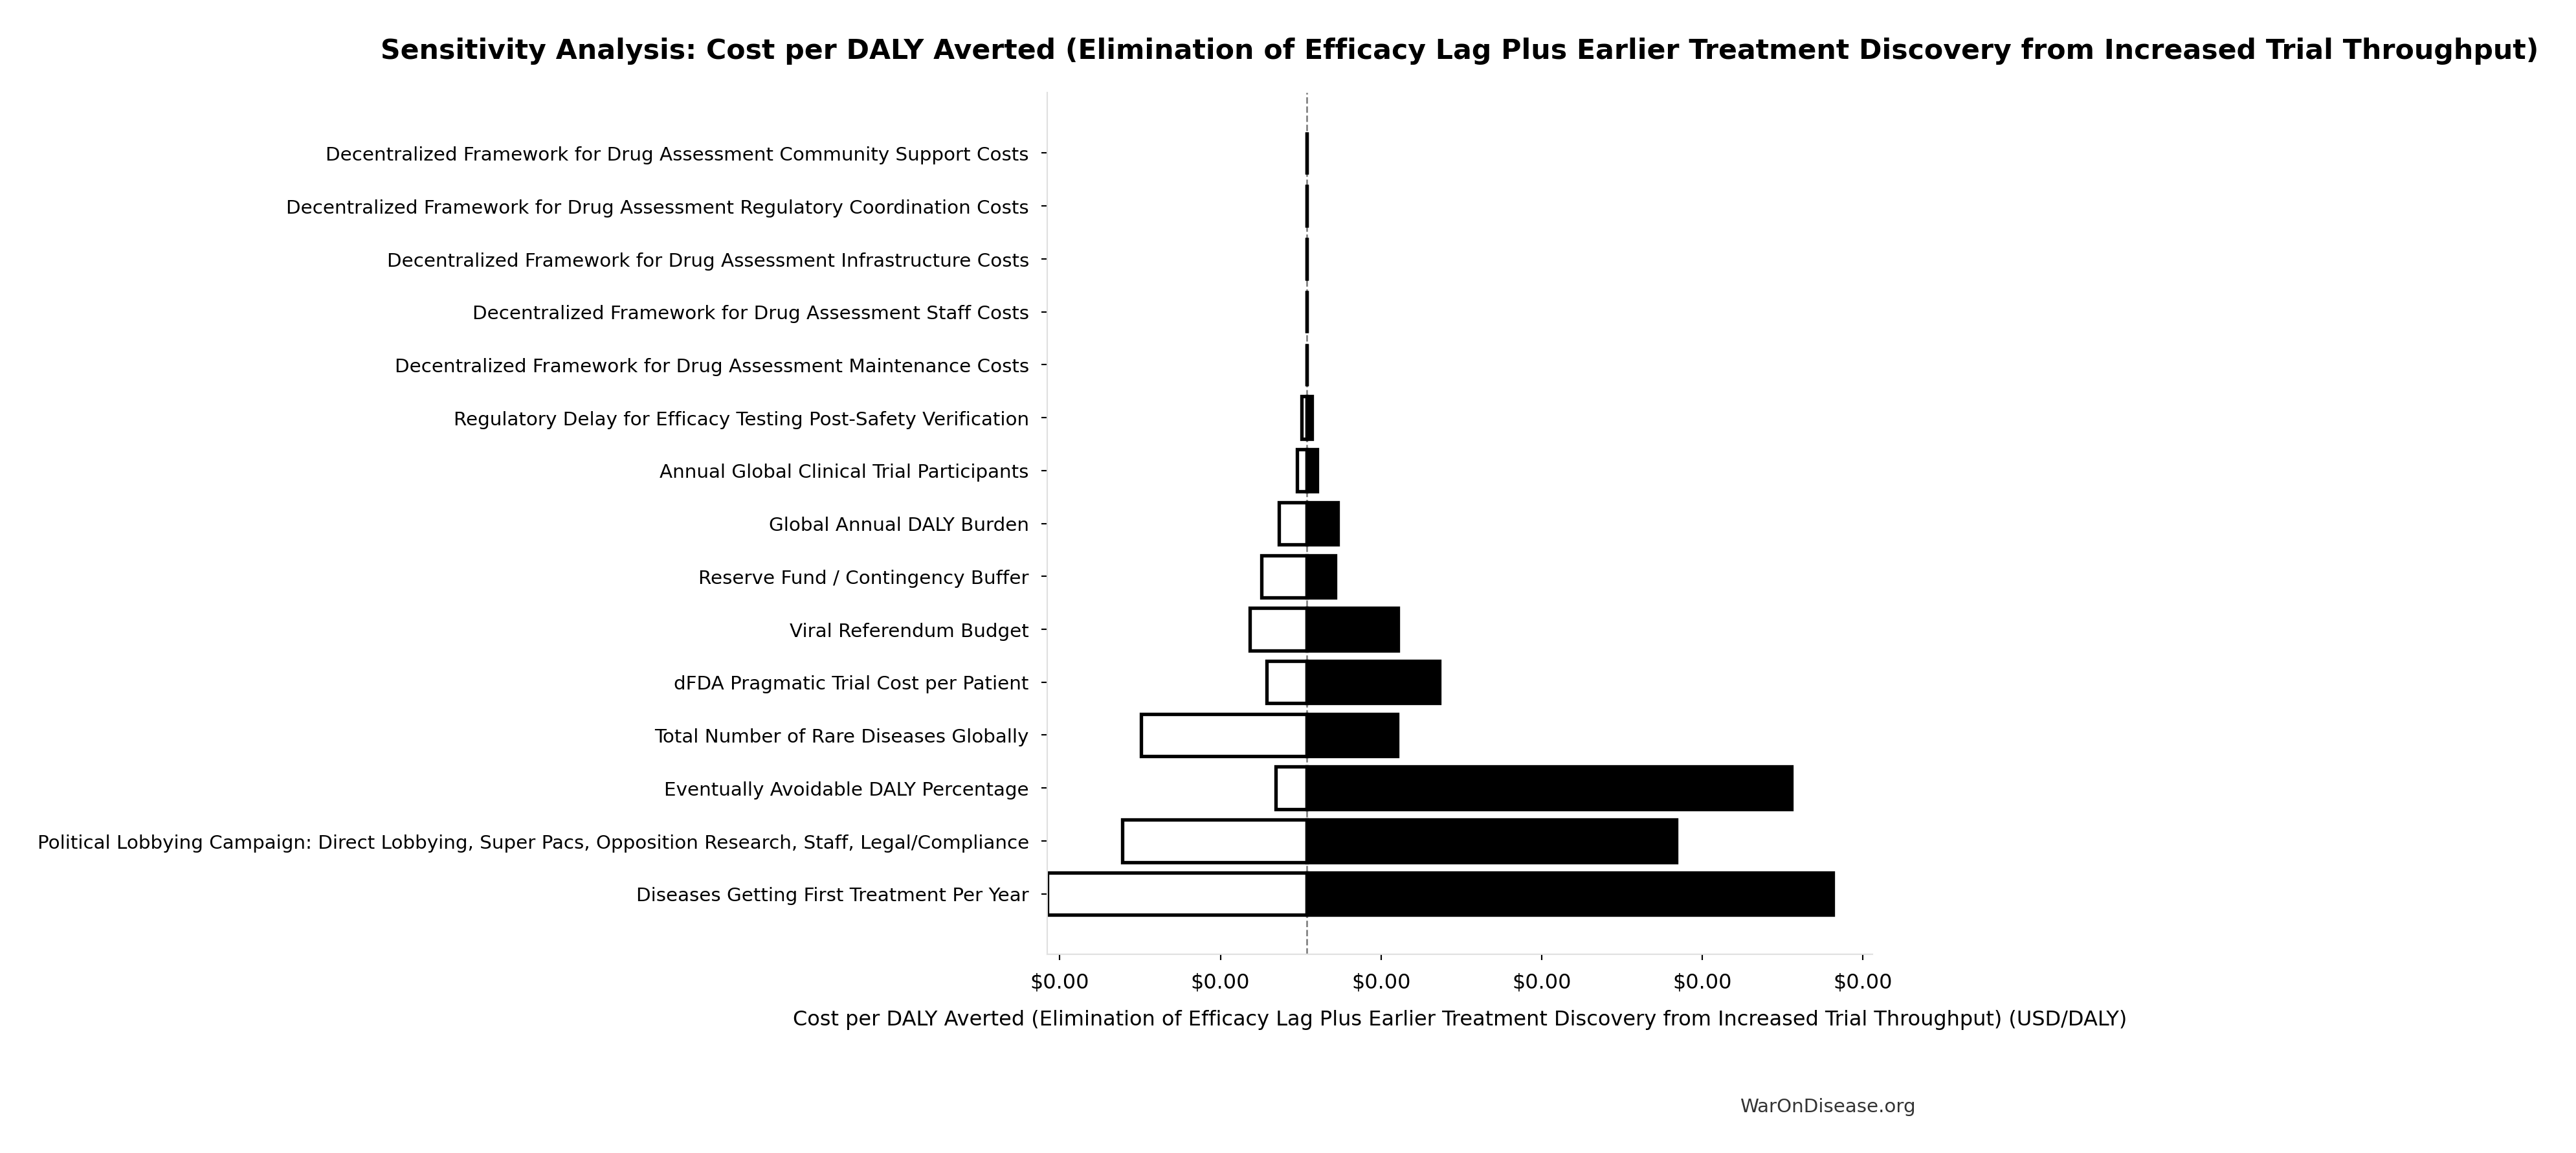
The tornado diagram shows that timeline shift assumptions and discount rate dominate uncertainty in cost-effectiveness. Even under conservative parameter assumptions, the intervention remains highly cost-effective.
Simulation Results Summary: Cost per DALY Averted (Elimination of Efficacy Lag Plus Earlier Treatment Discovery from Increased Trial Throughput)
| Baseline (deterministic) |
$0.00177 |
| Mean (expected value) |
$0.00182 |
| Median (50th percentile) |
$0.00162 |
| Standard Deviation |
$0.000903 |
| 90% Range (5th-95th percentile) |
[$0.000809, $0.00354] |
The histogram shows 1,000 of the 10,000 Monte Carlo draws for Cost per DALY Averted (Elimination of Efficacy Lag Plus Earlier Treatment Discovery from Increased Trial Throughput); the summary statistics use all 10,000. The exceedance curve (right) shows the probability of the outcome exceeding any given value.
Monte Carlo analysis confirms the 95% confidence interval for cost per DALY remains well below $1/DALY, maintaining dominance.
Accounting for political uncertainty (1% (95% CI: 0.1%-10%)), this remains 503x (90% CI: 30.5x-3.0kx) more cost-effective than bed nets ($89 (95% CI: $78-$100)/DALY) and comparable to deworming, the gold standard.
For context: Ottawa Treaty95 (landmine ban) was called a “bold gamble” that succeeded with 122 states signing95 in just 14 months.
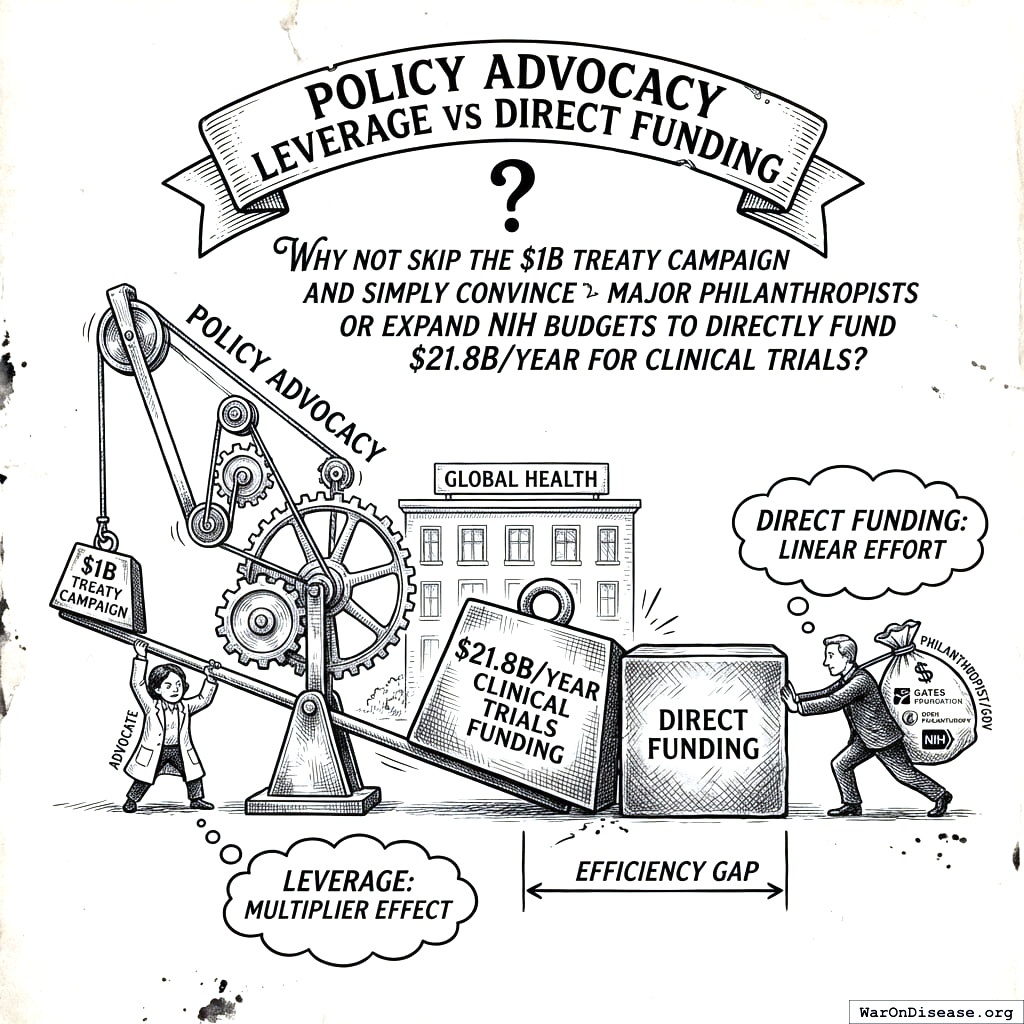
Policy Advocacy Leverage vs Direct Funding
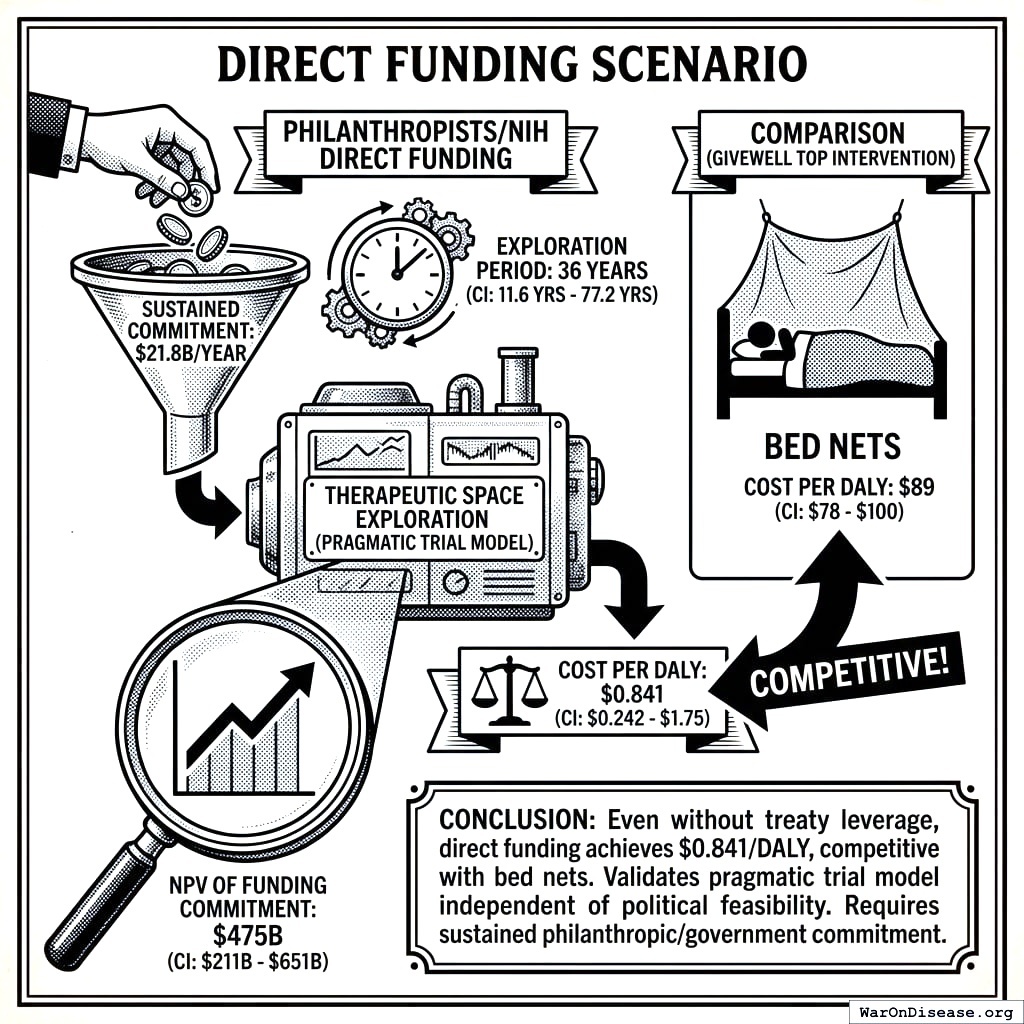
A natural question: Why not skip the $1 billion treaty campaign and simply convince major philanthropists (Gates Foundation, Open Philanthropy) or expand NIH budgets to directly fund $21.8 billion/year for clinical trials?
Numerical Comparison: Treaty vs Direct Funding
Direct Funding Scenario
If philanthropists/NIH directly funded $21.8 billion/year for 36 years (90% CI: 8.15 years-106 years) (therapeutic space exploration period):
\[
\begin{gathered}
NPV_{direct} \\
= \frac{T_{queue,trial}}{Funding_{trial,ref} \times r_{discount}} \\
= \frac{36}{\$21.8B \times 3\%} \\
= \$476B
\end{gathered}
\]
where:
\[
\begin{gathered}
T_{queue,trial} \\
= \frac{T_{queue,SQ}}{k_{capacity}} \\
= \frac{443}{12.3} \\
= 36
\end{gathered}
\]
where:
\[
\begin{gathered}
T_{queue,SQ} \\
= \frac{N_{untreated}}{Treatments_{new,ann}} \\
= \frac{6{,}650}{15} \\
= 443
\end{gathered}
\]
where:
\[
\begin{gathered}
N_{untreated} \\
= N_{rare} \times 0.95 \\
= 7{,}000 \times 0.95 \\
= 6{,}650
\end{gathered}
\]
where:
\[
\begin{gathered}
k_{capacity} \\
= \frac{N_{fundable,ref}}{Slots_{curr}} \\
= \frac{23.4M}{1.9M} \\
= 12.3
\end{gathered}
\]
where:
\[
\begin{gathered}
N_{fundable,ref} \\
= \frac{Subsidies_{trial,ref}}{Cost_{pragmatic,pt}} \\
= \frac{\$21.8B}{\$929} \\
= 23.4M
\end{gathered}
\]
where:
\[
\begin{gathered}
Subsidies_{trial,ref} \\
= Funding_{trial,ref} - OPEX_{trial} \\
= \$21.8B - \$40M \\
= \$21.8B
\end{gathered}
\]
where:
\[
\begin{gathered}
OPEX_{trial} \\
= Cost_{platform} + Cost_{staff} + Cost_{infra} \\
+ Cost_{regulatory} + Cost_{community} \\
= \$15M + \$10M + \$8M + \$5M + \$2M \\
= \$40M
\end{gathered}
\]
\[
\begin{gathered}
Cost_{direct,DALY} \\
= \frac{NPV_{direct}}{DALYs_{max}} \\
= \frac{\$476B}{565B} \\
= \$0.842
\end{gathered}
\]
where:
\[
\begin{gathered}
NPV_{direct} \\
= \frac{T_{queue,trial}}{Funding_{trial,ref} \times r_{discount}} \\
= \frac{36}{\$21.8B \times 3\%} \\
= \$476B
\end{gathered}
\]
where:
\[
\begin{gathered}
T_{queue,trial} \\
= \frac{T_{queue,SQ}}{k_{capacity}} \\
= \frac{443}{12.3} \\
= 36
\end{gathered}
\]
where:
\[
\begin{gathered}
T_{queue,SQ} \\
= \frac{N_{untreated}}{Treatments_{new,ann}} \\
= \frac{6{,}650}{15} \\
= 443
\end{gathered}
\]
where:
\[
\begin{gathered}
N_{untreated} \\
= N_{rare} \times 0.95 \\
= 7{,}000 \times 0.95 \\
= 6{,}650
\end{gathered}
\]
where:
\[
\begin{gathered}
k_{capacity} \\
= \frac{N_{fundable,ref}}{Slots_{curr}} \\
= \frac{23.4M}{1.9M} \\
= 12.3
\end{gathered}
\]
where:
\[
\begin{gathered}
N_{fundable,ref} \\
= \frac{Subsidies_{trial,ref}}{Cost_{pragmatic,pt}} \\
= \frac{\$21.8B}{\$929} \\
= 23.4M
\end{gathered}
\]
where:
\[
\begin{gathered}
Subsidies_{trial,ref} \\
= Funding_{trial,ref} - OPEX_{trial} \\
= \$21.8B - \$40M \\
= \$21.8B
\end{gathered}
\]
where:
\[
\begin{gathered}
OPEX_{trial} \\
= Cost_{platform} + Cost_{staff} + Cost_{infra} \\
+ Cost_{regulatory} + Cost_{community} \\
= \$15M + \$10M + \$8M + \$5M + \$2M \\
= \$40M
\end{gathered}
\]
where:
\[
\begin{gathered}
DALYs_{max} \\
= DALYs_{global,ann} \times Pct_{avoid,DALY} \times T_{accel,max} \\
= 2.88B \times 92.6\% \times 212 \\
= 565B
\end{gathered}
\]
where:
\[
T_{accel,max} = T_{accel} + T_{lag} = 204 + 8.2 = 212
\]
where:
\[
\begin{gathered}
T_{accel} \\
= T_{first,SQ} \times \left(1 - \frac{1}{k_{capacity}}\right) \\
= 222 \times \left(1 - \frac{1}{12.3}\right) \\
= 204
\end{gathered}
\]
where:
\[
\begin{gathered}
T_{first,SQ} \\
= T_{queue,SQ} \times 0.5 \\
= 443 \times 0.5 \\
= 222
\end{gathered}
\]
Treaty Campaign Advantage
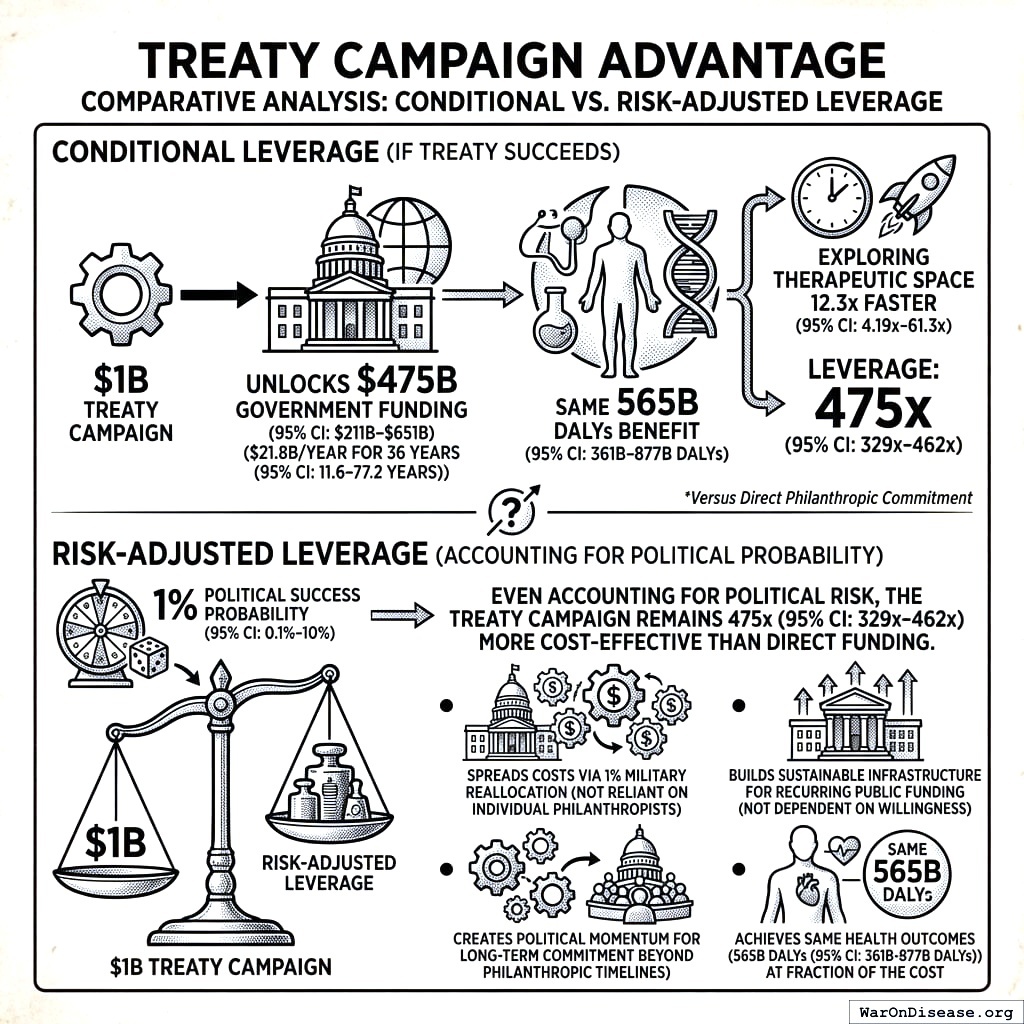
Conditional leverage (if treaty succeeds): 476x (90% CI: 149x-830x)
The $1 billion treaty campaign unlocks the same $476 billion (90% CI: $156 billion-$695 billion) in government funding ($21.8 billion/year for 36 years (90% CI: 8.15 years-106 years)) that would otherwise require direct philanthropic commitment. Both approaches achieve the same 565 billion DALYs (90% CI: 309 billion DALYs-1.08 trillion DALYs) benefit by exploring the therapeutic space 12.3x (90% CI: 4.92x-50.8x) faster.
Risk-adjusted leverage (accounting for 1% (95% CI: 0.1%-10%) political success probability):
\[
\begin{gathered}
Leverage_{treaty} \\
= \frac{Cost_{direct,DALY}}{Cost_{treaty,DALY}} \\
= \frac{\$0.842}{\$0.00177} \\
= 476
\end{gathered}
\]
where:
\[
\begin{gathered}
Cost_{direct,DALY} \\
= \frac{NPV_{direct}}{DALYs_{max}} \\
= \frac{\$476B}{565B} \\
= \$0.842
\end{gathered}
\]
where:
\[
\begin{gathered}
NPV_{direct} \\
= \frac{T_{queue,trial}}{Funding_{trial,ref} \times r_{discount}} \\
= \frac{36}{\$21.8B \times 3\%} \\
= \$476B
\end{gathered}
\]
where:
\[
\begin{gathered}
T_{queue,trial} \\
= \frac{T_{queue,SQ}}{k_{capacity}} \\
= \frac{443}{12.3} \\
= 36
\end{gathered}
\]
where:
\[
\begin{gathered}
T_{queue,SQ} \\
= \frac{N_{untreated}}{Treatments_{new,ann}} \\
= \frac{6{,}650}{15} \\
= 443
\end{gathered}
\]
where:
\[
\begin{gathered}
N_{untreated} \\
= N_{rare} \times 0.95 \\
= 7{,}000 \times 0.95 \\
= 6{,}650
\end{gathered}
\]
where:
\[
\begin{gathered}
k_{capacity} \\
= \frac{N_{fundable,ref}}{Slots_{curr}} \\
= \frac{23.4M}{1.9M} \\
= 12.3
\end{gathered}
\]
where:
\[
\begin{gathered}
N_{fundable,ref} \\
= \frac{Subsidies_{trial,ref}}{Cost_{pragmatic,pt}} \\
= \frac{\$21.8B}{\$929} \\
= 23.4M
\end{gathered}
\]
where:
\[
\begin{gathered}
Subsidies_{trial,ref} \\
= Funding_{trial,ref} - OPEX_{trial} \\
= \$21.8B - \$40M \\
= \$21.8B
\end{gathered}
\]
where:
\[
\begin{gathered}
OPEX_{trial} \\
= Cost_{platform} + Cost_{staff} + Cost_{infra} \\
+ Cost_{regulatory} + Cost_{community} \\
= \$15M + \$10M + \$8M + \$5M + \$2M \\
= \$40M
\end{gathered}
\]
where:
\[
\begin{gathered}
DALYs_{max} \\
= DALYs_{global,ann} \times Pct_{avoid,DALY} \times T_{accel,max} \\
= 2.88B \times 92.6\% \times 212 \\
= 565B
\end{gathered}
\]
where:
\[
T_{accel,max} = T_{accel} + T_{lag} = 204 + 8.2 = 212
\]
where:
\[
\begin{gathered}
T_{accel} \\
= T_{first,SQ} \times \left(1 - \frac{1}{k_{capacity}}\right) \\
= 222 \times \left(1 - \frac{1}{12.3}\right) \\
= 204
\end{gathered}
\]
where:
\[
\begin{gathered}
T_{first,SQ} \\
= T_{queue,SQ} \times 0.5 \\
= 443 \times 0.5 \\
= 222
\end{gathered}
\]
where:
\[
\begin{gathered}
Cost_{treaty,DALY} \\
= \frac{Cost_{campaign}}{DALYs_{max}} \\
= \frac{\$1B}{565B} \\
= \$0.00177
\end{gathered}
\]
where:
\[
\begin{gathered}
Cost_{campaign} \\
= Budget_{viral,base} + Budget_{lobby,treaty} \\
+ Budget_{reserve} \\
= \$250M + \$650M + \$100M \\
= \$1B
\end{gathered}
\]
Even accounting for political risk, the treaty campaign remains 476x (90% CI: 149x-830x) more cost-effective than direct funding. The treaty approach:
- Spreads costs across governments via 1% military reallocation (not reliant on individual philanthropists)
- Builds sustainable infrastructure for recurring public funding (not dependent on continued philanthropic willingness)
- Creates political momentum for long-term commitment beyond philanthropic timelines
- Achieves same health outcomes (565 billion DALYs (90% CI: 309 billion DALYs-1.08 trillion DALYs)) at fraction of the cost
Quality-Adjusted Life Year (QALY) Valuation
QALYs represent the standard metric in health economics for comparing health interventions across different conditions and treatment modalities. One QALY equals one year of life in perfect health.
QALY Calculation Model
The total DALYs averted (565 billion) from the ~212 years (90% CI: 124 years-398 years) timeline shift derives from two complementary mechanisms:
- Efficacy Lag Elimination (8.2 years (90% CI: 4.84 years-11.5 years)): Treatments reach patients immediately after Phase I safety, rather than waiting for Phase II/III efficacy trials
- Trial Capacity Expansion (204 years (90% CI: 116 years-390 years) average): 12.3x (90% CI: 4.92x-50.8x) more trials running in parallel accelerates discovery of first treatments for untreated diseases
\[
\begin{gathered}
DALYs_{max} \\
= DALYs_{global,ann} \times Pct_{avoid,DALY} \times T_{accel,max} \\
= 2.88B \times 92.6\% \times 212 \\
= 565B
\end{gathered}
\]
where:
\[
T_{accel,max} = T_{accel} + T_{lag} = 204 + 8.2 = 212
\]
where:
\[
\begin{gathered}
T_{accel} \\
= T_{first,SQ} \times \left(1 - \frac{1}{k_{capacity}}\right) \\
= 222 \times \left(1 - \frac{1}{12.3}\right) \\
= 204
\end{gathered}
\]
where:
\[
\begin{gathered}
T_{first,SQ} \\
= T_{queue,SQ} \times 0.5 \\
= 443 \times 0.5 \\
= 222
\end{gathered}
\]
where:
\[
\begin{gathered}
T_{queue,SQ} \\
= \frac{N_{untreated}}{Treatments_{new,ann}} \\
= \frac{6{,}650}{15} \\
= 443
\end{gathered}
\]
where:
\[
\begin{gathered}
N_{untreated} \\
= N_{rare} \times 0.95 \\
= 7{,}000 \times 0.95 \\
= 6{,}650
\end{gathered}
\]
where:
\[
\begin{gathered}
k_{capacity} \\
= \frac{N_{fundable,ref}}{Slots_{curr}} \\
= \frac{23.4M}{1.9M} \\
= 12.3
\end{gathered}
\]
where:
\[
\begin{gathered}
N_{fundable,ref} \\
= \frac{Subsidies_{trial,ref}}{Cost_{pragmatic,pt}} \\
= \frac{\$21.8B}{\$929} \\
= 23.4M
\end{gathered}
\]
where:
\[
\begin{gathered}
Subsidies_{trial,ref} \\
= Funding_{trial,ref} - OPEX_{trial} \\
= \$21.8B - \$40M \\
= \$21.8B
\end{gathered}
\]
where:
\[
\begin{gathered}
OPEX_{trial} \\
= Cost_{platform} + Cost_{staff} + Cost_{infra} \\
+ Cost_{regulatory} + Cost_{community} \\
= \$15M + \$10M + \$8M + \$5M + \$2M \\
= \$40M
\end{gathered}
\]
These benefits flow through three distinct channels:
A. Accelerated Development of Existing Pipeline Drugs
Health gains from bringing effective treatments to patients faster through shortened development and approval timelines:
B. Improved Preventative Care via Real-World Evidence
Value of using comprehensive data to optimize preventative care and treatment effectiveness:
C. Enabling Research for Previously Untreatable Diseases
Opens research pathways for conditions currently ignored because trials are too expensive to bother:
QALY Valuation: Standard economic valuations range from $50,000-$150,000 (90% CI: $100,384-$198,679)106 per QALY. This analysis uses conservative mid-range values.
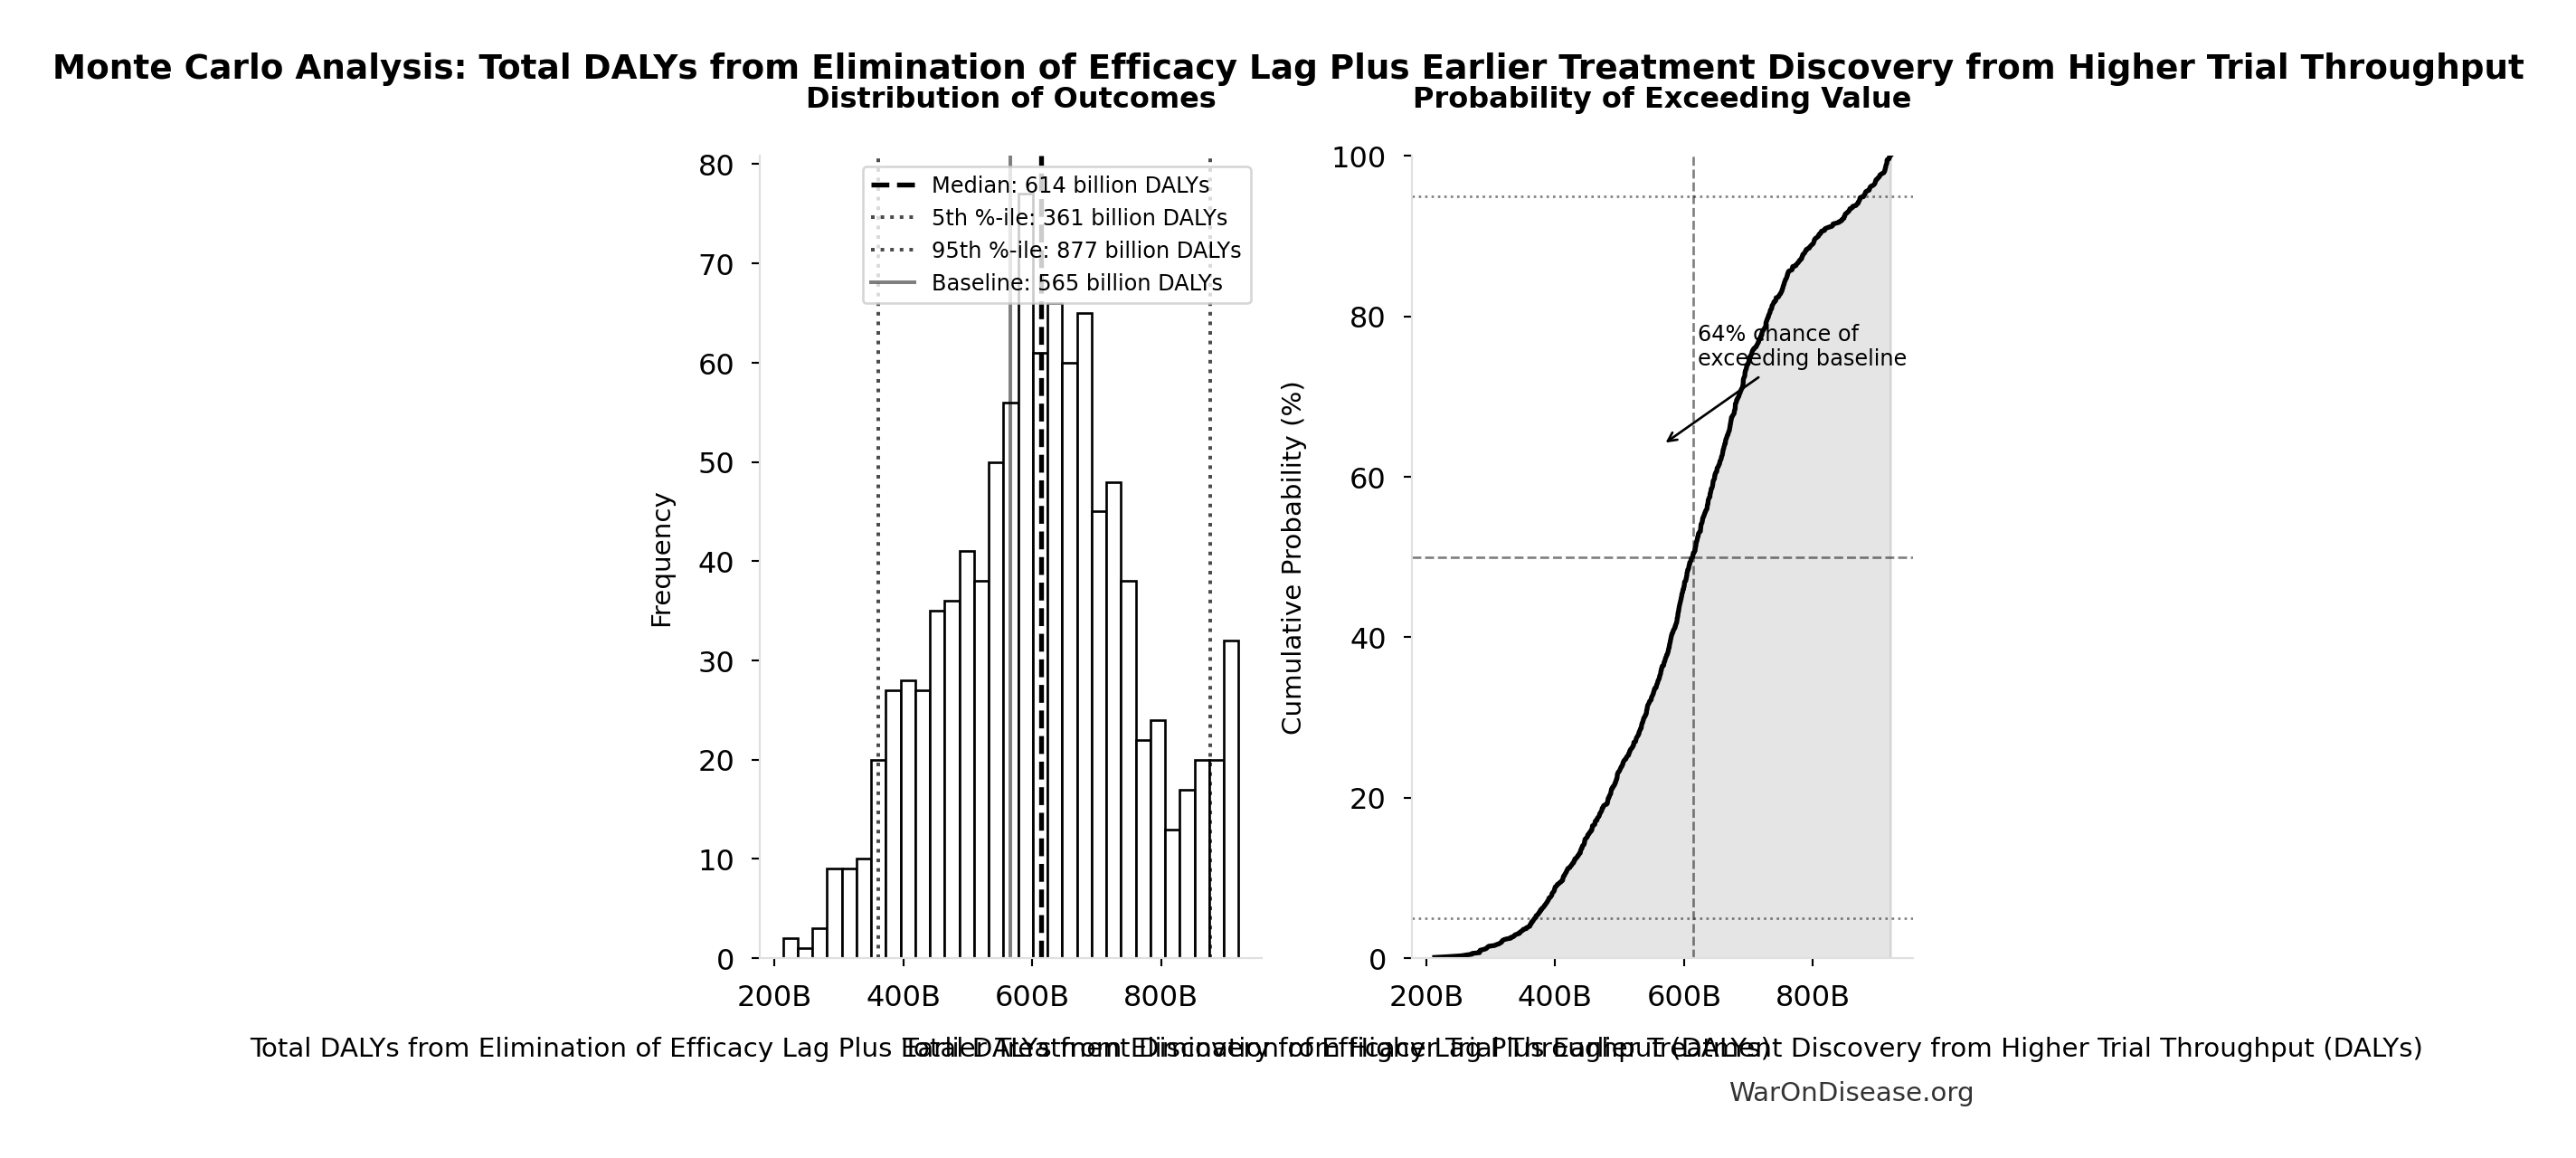
The distribution below shows the uncertainty range in total DALYs averted from the combined timeline shift (efficacy lag elimination + trial capacity expansion), based on Monte Carlo simulation of input parameter uncertainty:
Simulation Results Summary: Total DALYs from Elimination of Efficacy Lag Plus Earlier Treatment Discovery from Higher Trial Throughput
| Baseline (deterministic) |
565 billion |
| Mean (expected value) |
635 billion |
| Median (50th percentile) |
600 billion |
| Standard Deviation |
237 billion |
| 90% Range (5th-95th percentile) |
[309 billion, 1.08 trillion] |
The histogram shows 1,000 of the 10,000 Monte Carlo draws for Total DALYs from Elimination of Efficacy Lag Plus Earlier Treatment Discovery from Higher Trial Throughput; the summary statistics use all 10,000. The exceedance curve (right) shows the probability of the outcome exceeding any given value.
For detailed DALY calculation methodology, see Regulatory Mortality Analysis.
Economist Verification: Complete Derivation Chains
This section provides step-by-step derivations for all headline claims, enabling independent verification. All intermediate values are linked to their source parameters in Parameters and Calculations.
Current System Baseline:
The trial capacity multiplier determines how many more trials can be run with reallocated funding:
Step 1: Calculate patients fundable annually
\[
\begin{gathered}
N_{fundable,ann} \\
= \frac{Subsidies_{trial,ann}}{Cost_{pragmatic,pt}} \\
= \frac{\$21.7B}{\$929} \\
= 23.4M
\end{gathered}
\]
where:
\[
\begin{gathered}
Subsidies_{trial,ann} \\
= Treasury_{RD,ann} - OPEX_{trial} \\
= \$21.8B - \$40M \\
= \$21.7B
\end{gathered}
\]
where:
\[
\begin{gathered}
OPEX_{trial} \\
= Cost_{platform} + Cost_{staff} + Cost_{infra} \\
+ Cost_{regulatory} + Cost_{community} \\
= \$15M + \$10M + \$8M + \$5M + \$2M \\
= \$40M
\end{gathered}
\]
where:
\[
\begin{gathered}
Treasury_{RD,ann} \\
= Funding_{treaty} - Payout_{bond,ann} - Funding_{political,ann} \\
= \$27.2B - \$2.72B - \$2.72B \\
= \$21.8B
\end{gathered}
\]
where:
\[
\begin{gathered}
Funding_{treaty} \\
= Spending_{mil} \times Reduce_{treaty} \\
= \$2.72T \times 1\% \\
= \$27.2B
\end{gathered}
\]
where:
\[
\begin{gathered}
Payout_{bond,ann} \\
= Funding_{treaty} \times Pct_{bond} \\
= \$27.2B \times 10\% \\
= \$2.72B
\end{gathered}
\]
where:
\[
\begin{gathered}
Funding_{political,ann} \\
= Funding_{treaty} \times Pct_{political} \\
= \$27.2B \times 10\% \\
= \$2.72B
\end{gathered}
\]
Step 2: Compare to current capacity
Step 3: Calculate multiplier
\[
\begin{gathered}
k_{capacity} \\
= \frac{N_{fundable,ref}}{Slots_{curr}} \\
= \frac{23.4M}{1.9M} \\
= 12.3
\end{gathered}
\]
where:
\[
\begin{gathered}
N_{fundable,ref} \\
= \frac{Subsidies_{trial,ref}}{Cost_{pragmatic,pt}} \\
= \frac{\$21.8B}{\$929} \\
= 23.4M
\end{gathered}
\]
where:
\[
\begin{gathered}
Subsidies_{trial,ref} \\
= Funding_{trial,ref} - OPEX_{trial} \\
= \$21.8B - \$40M \\
= \$21.8B
\end{gathered}
\]
where:
\[
\begin{gathered}
OPEX_{trial} \\
= Cost_{platform} + Cost_{staff} + Cost_{infra} \\
+ Cost_{regulatory} + Cost_{community} \\
= \$15M + \$10M + \$8M + \$5M + \$2M \\
= \$40M
\end{gathered}
\]
Step 4: Cumulative Research Impact (20-year horizon)
\[
\begin{gathered}
Capacity_{20yr} \\
= k_{capacity} \times 20 \\
= 12.3 \times 20 \\
= 247
\end{gathered}
\]
where:
\[
\begin{gathered}
k_{capacity} \\
= \frac{N_{fundable,ref}}{Slots_{curr}} \\
= \frac{23.4M}{1.9M} \\
= 12.3
\end{gathered}
\]
where:
\[
\begin{gathered}
N_{fundable,ref} \\
= \frac{Subsidies_{trial,ref}}{Cost_{pragmatic,pt}} \\
= \frac{\$21.8B}{\$929} \\
= 23.4M
\end{gathered}
\]
where:
\[
\begin{gathered}
Subsidies_{trial,ref} \\
= Funding_{trial,ref} - OPEX_{trial} \\
= \$21.8B - \$40M \\
= \$21.8B
\end{gathered}
\]
where:
\[
\begin{gathered}
OPEX_{trial} \\
= Cost_{platform} + Cost_{staff} + Cost_{infra} \\
+ Cost_{regulatory} + Cost_{community} \\
= \$15M + \$10M + \$8M + \$5M + \$2M \\
= \$40M
\end{gathered}
\]
The timeline shift combines two independent effects:
Component A: Treatment Acceleration from Trial Capacity
Step 1: Status quo time to explore therapeutic search space
\[
\begin{gathered}
T_{queue,SQ} \\
= \frac{N_{untreated}}{Treatments_{new,ann}} \\
= \frac{6{,}650}{15} \\
= 443
\end{gathered}
\]
where:
\[
\begin{gathered}
N_{untreated} \\
= N_{rare} \times 0.95 \\
= 7{,}000 \times 0.95 \\
= 6{,}650
\end{gathered}
\]
Step 2: Expected time to first treatment
Step 3: Accelerated treatment timeline
With 12.3x (90% CI: 4.92x-50.8x) capacity, the search space is explored 12.3x (90% CI: 4.92x-50.8x) faster. The average disease receives treatment 204 years (90% CI: 116 years-390 years) earlier:
\[
\begin{gathered}
T_{accel} \\
= T_{first,SQ} \times \left(1 - \frac{1}{k_{capacity}}\right) \\
= 222 \times \left(1 - \frac{1}{12.3}\right) \\
= 204
\end{gathered}
\]
where:
\[
\begin{gathered}
T_{first,SQ} \\
= T_{queue,SQ} \times 0.5 \\
= 443 \times 0.5 \\
= 222
\end{gathered}
\]
where:
\[
\begin{gathered}
T_{queue,SQ} \\
= \frac{N_{untreated}}{Treatments_{new,ann}} \\
= \frac{6{,}650}{15} \\
= 443
\end{gathered}
\]
where:
\[
\begin{gathered}
N_{untreated} \\
= N_{rare} \times 0.95 \\
= 7{,}000 \times 0.95 \\
= 6{,}650
\end{gathered}
\]
where:
\[
\begin{gathered}
k_{capacity} \\
= \frac{N_{fundable,ref}}{Slots_{curr}} \\
= \frac{23.4M}{1.9M} \\
= 12.3
\end{gathered}
\]
where:
\[
\begin{gathered}
N_{fundable,ref} \\
= \frac{Subsidies_{trial,ref}}{Cost_{pragmatic,pt}} \\
= \frac{\$21.8B}{\$929} \\
= 23.4M
\end{gathered}
\]
where:
\[
\begin{gathered}
Subsidies_{trial,ref} \\
= Funding_{trial,ref} - OPEX_{trial} \\
= \$21.8B - \$40M \\
= \$21.8B
\end{gathered}
\]
where:
\[
\begin{gathered}
OPEX_{trial} \\
= Cost_{platform} + Cost_{staff} + Cost_{infra} \\
+ Cost_{regulatory} + Cost_{community} \\
= \$15M + \$10M + \$8M + \$5M + \$2M \\
= \$40M
\end{gathered}
\]
Component B: Efficacy Lag Elimination
Post-safety regulatory delay: 8.2 years (90% CI: 4.84 years-11.5 years) (BIO 2021: 10.5 years to market minus 2.3 years Phase I)
Total Timeline Shift
\[
T_{accel,max} = T_{accel} + T_{lag} = 204 + 8.2 = 212
\]
where:
\[
\begin{gathered}
T_{accel} \\
= T_{first,SQ} \times \left(1 - \frac{1}{k_{capacity}}\right) \\
= 222 \times \left(1 - \frac{1}{12.3}\right) \\
= 204
\end{gathered}
\]
where:
\[
\begin{gathered}
T_{first,SQ} \\
= T_{queue,SQ} \times 0.5 \\
= 443 \times 0.5 \\
= 222
\end{gathered}
\]
where:
\[
\begin{gathered}
T_{queue,SQ} \\
= \frac{N_{untreated}}{Treatments_{new,ann}} \\
= \frac{6{,}650}{15} \\
= 443
\end{gathered}
\]
where:
\[
\begin{gathered}
N_{untreated} \\
= N_{rare} \times 0.95 \\
= 7{,}000 \times 0.95 \\
= 6{,}650
\end{gathered}
\]
where:
\[
\begin{gathered}
k_{capacity} \\
= \frac{N_{fundable,ref}}{Slots_{curr}} \\
= \frac{23.4M}{1.9M} \\
= 12.3
\end{gathered}
\]
where:
\[
\begin{gathered}
N_{fundable,ref} \\
= \frac{Subsidies_{trial,ref}}{Cost_{pragmatic,pt}} \\
= \frac{\$21.8B}{\$929} \\
= 23.4M
\end{gathered}
\]
where:
\[
\begin{gathered}
Subsidies_{trial,ref} \\
= Funding_{trial,ref} - OPEX_{trial} \\
= \$21.8B - \$40M \\
= \$21.8B
\end{gathered}
\]
where:
\[
\begin{gathered}
OPEX_{trial} \\
= Cost_{platform} + Cost_{staff} + Cost_{infra} \\
+ Cost_{regulatory} + Cost_{community} \\
= \$15M + \$10M + \$8M + \$5M + \$2M \\
= \$40M
\end{gathered}
\]
DALYs Averted Derivation (565 billion)
Step 1: Identify annual DALY burden
- Global annual DALY burden: 2.88 billion (WHO GBD 2021)
- This includes both mortality (YLL) and morbidity (YLD: arthritis, depression, chronic pain, etc.)
Step 2: Determine avoidable fraction
- Eventually avoidable with biomedical research: 92.6% (95% CI: 50%-98%)
- Fundamentally unavoidable (accidents): 7.37%
Assumption justification (92.6% (95% CI: 50%-98%) avoidable): This represents the theoretical ceiling of what is biologically addressable, not what is currently preventable. It excludes only fundamentally unavoidable causes (primarily accidents, which cannot be addressed by medical research). Conservative estimates of current preventability (20-30%) are much lower because they measure what we can do today, not what is scientifically possible with sufficient research over decades.
Step 3: Calculate DALYs averted
\[
\begin{gathered}
DALYs_{max} \\
= DALYs_{global,ann} \times Pct_{avoid,DALY} \times T_{accel,max} \\
= 2.88B \times 92.6\% \times 212 \\
= 565B
\end{gathered}
\]
where:
\[
T_{accel,max} = T_{accel} + T_{lag} = 204 + 8.2 = 212
\]
where:
\[
\begin{gathered}
T_{accel} \\
= T_{first,SQ} \times \left(1 - \frac{1}{k_{capacity}}\right) \\
= 222 \times \left(1 - \frac{1}{12.3}\right) \\
= 204
\end{gathered}
\]
where:
\[
\begin{gathered}
T_{first,SQ} \\
= T_{queue,SQ} \times 0.5 \\
= 443 \times 0.5 \\
= 222
\end{gathered}
\]
where:
\[
\begin{gathered}
T_{queue,SQ} \\
= \frac{N_{untreated}}{Treatments_{new,ann}} \\
= \frac{6{,}650}{15} \\
= 443
\end{gathered}
\]
where:
\[
\begin{gathered}
N_{untreated} \\
= N_{rare} \times 0.95 \\
= 7{,}000 \times 0.95 \\
= 6{,}650
\end{gathered}
\]
where:
\[
\begin{gathered}
k_{capacity} \\
= \frac{N_{fundable,ref}}{Slots_{curr}} \\
= \frac{23.4M}{1.9M} \\
= 12.3
\end{gathered}
\]
where:
\[
\begin{gathered}
N_{fundable,ref} \\
= \frac{Subsidies_{trial,ref}}{Cost_{pragmatic,pt}} \\
= \frac{\$21.8B}{\$929} \\
= 23.4M
\end{gathered}
\]
where:
\[
\begin{gathered}
Subsidies_{trial,ref} \\
= Funding_{trial,ref} - OPEX_{trial} \\
= \$21.8B - \$40M \\
= \$21.8B
\end{gathered}
\]
where:
\[
\begin{gathered}
OPEX_{trial} \\
= Cost_{platform} + Cost_{staff} + Cost_{infra} \\
+ Cost_{regulatory} + Cost_{community} \\
= \$15M + \$10M + \$8M + \$5M + \$2M \\
= \$40M
\end{gathered}
\]
Step 1: Identify one-time implementation cost
- Treaty implementation cost: $1 billion
- Referendum: $250 million
- Lobbying: $650 million
- Reserve: $100 million
Step 2: Calculate cost per DALY
\[
\begin{gathered}
Cost_{treaty,DALY} \\
= \frac{Cost_{campaign}}{DALYs_{max}} \\
= \frac{\$1B}{565B} \\
= \$0.00177
\end{gathered}
\]
where:
\[
\begin{gathered}
Cost_{campaign} \\
= Budget_{viral,base} + Budget_{lobby,treaty} \\
+ Budget_{reserve} \\
= \$250M + \$650M + \$100M \\
= \$1B
\end{gathered}
\]
where:
\[
\begin{gathered}
DALYs_{max} \\
= DALYs_{global,ann} \times Pct_{avoid,DALY} \times T_{accel,max} \\
= 2.88B \times 92.6\% \times 212 \\
= 565B
\end{gathered}
\]
where:
\[
T_{accel,max} = T_{accel} + T_{lag} = 204 + 8.2 = 212
\]
where:
\[
\begin{gathered}
T_{accel} \\
= T_{first,SQ} \times \left(1 - \frac{1}{k_{capacity}}\right) \\
= 222 \times \left(1 - \frac{1}{12.3}\right) \\
= 204
\end{gathered}
\]
where:
\[
\begin{gathered}
T_{first,SQ} \\
= T_{queue,SQ} \times 0.5 \\
= 443 \times 0.5 \\
= 222
\end{gathered}
\]
where:
\[
\begin{gathered}
T_{queue,SQ} \\
= \frac{N_{untreated}}{Treatments_{new,ann}} \\
= \frac{6{,}650}{15} \\
= 443
\end{gathered}
\]
where:
\[
\begin{gathered}
N_{untreated} \\
= N_{rare} \times 0.95 \\
= 7{,}000 \times 0.95 \\
= 6{,}650
\end{gathered}
\]
where:
\[
\begin{gathered}
k_{capacity} \\
= \frac{N_{fundable,ref}}{Slots_{curr}} \\
= \frac{23.4M}{1.9M} \\
= 12.3
\end{gathered}
\]
where:
\[
\begin{gathered}
N_{fundable,ref} \\
= \frac{Subsidies_{trial,ref}}{Cost_{pragmatic,pt}} \\
= \frac{\$21.8B}{\$929} \\
= 23.4M
\end{gathered}
\]
where:
\[
\begin{gathered}
Subsidies_{trial,ref} \\
= Funding_{trial,ref} - OPEX_{trial} \\
= \$21.8B - \$40M \\
= \$21.8B
\end{gathered}
\]
where:
\[
\begin{gathered}
OPEX_{trial} \\
= Cost_{platform} + Cost_{staff} + Cost_{infra} \\
+ Cost_{regulatory} + Cost_{community} \\
= \$15M + \$10M + \$8M + \$5M + \$2M \\
= \$40M
\end{gathered}
\]
Comparison: Malaria bed nets cost $89 (95% CI: $78-$100)/DALY - this intervention is 50.3kx (90% CI: 25.0kx-111.1kx) more cost-effective.
The conservative ROI uses only R&D cost savings, ignoring all health benefits:
Step 1: Calculate annual R&D savings
\[
\begin{gathered}
Benefit_{RD,ann} \\
= Spending_{trials} \times Pct_{P2+P3} \times Reduce_{pct} \\
= \$60B \times 69\% \times 97.7\% \\
= \$40.5B
\end{gathered}
\]
where:
\[
\begin{gathered}
Reduce_{pct} \\
= 1 - \frac{Cost_{pragmatic,pt}}{Cost_{P3,pt}} \\
= 1 - \frac{\$929}{\$41K} \\
= 97.7\%
\end{gathered}
\]
Step 2: Calculate NPV of benefits (10-year horizon)
\[
\begin{gathered}
NPV_{RD} \\
= \sum_{t=1}^{10} \frac{Savings_{RD,ann} \cdot \frac{\min(t,5)}{5}}{(1+r)^t}
\end{gathered}
\]
Step 3: Calculate NPV of costs
Step 4: Calculate ROI
\[
\begin{gathered}
ROI_{RD} \\
= \frac{NPV_{RD}}{Cost_{platform,total}} \\
= \frac{\$269B}{\$611M} \\
= 439
\end{gathered}
\]
where:
\[
\begin{gathered}
NPV_{RD} \\
= \sum_{t=1}^{10} \frac{Savings_{RD,ann} \cdot \frac{\min(t,5)}{5}}{(1+r)^t}
\end{gathered}
\]
where:
\[
\begin{gathered}
Savings_{RD,ann} \\
= Benefit_{RD,ann} - OPEX_{trial} \\
= \$40.5B - \$40M \\
= \$40.4B
\end{gathered}
\]
where:
\[
\begin{gathered}
Benefit_{RD,ann} \\
= Spending_{trials} \times Pct_{P2+P3} \times Reduce_{pct} \\
= \$60B \times 69\% \times 97.7\% \\
= \$40.5B
\end{gathered}
\]
where:
\[
\begin{gathered}
Reduce_{pct} \\
= 1 - \frac{Cost_{pragmatic,pt}}{Cost_{P3,pt}} \\
= 1 - \frac{\$929}{\$41K} \\
= 97.7\%
\end{gathered}
\]
where:
\[
\begin{gathered}
OPEX_{trial} \\
= Cost_{platform} + Cost_{staff} + Cost_{infra} \\
+ Cost_{regulatory} + Cost_{community} \\
= \$15M + \$10M + \$8M + \$5M + \$2M \\
= \$40M
\end{gathered}
\]
where:
\[
\begin{gathered}
Cost_{platform,total} \\
= PV_{OPEX} + Cost_{upfront,total} \\
= \$342M + \$270M \\
= \$611M
\end{gathered}
\]
where:
\[
\begin{gathered}
PV_{OPEX} \\
= \frac{T_{horizon}}{OPEX_{total} \times r_{discount}} \\
= \frac{10}{\$40M \times 3\%} \\
= \$342M
\end{gathered}
\]
where:
\[
\begin{gathered}
OPEX_{total} \\
= OPEX_{ann} + OPEX_{DIH,ann} \\
= \$18.9M + \$21.1M \\
= \$40M
\end{gathered}
\]
where:
\[
\begin{gathered}
Cost_{upfront,total} \\
= Cost_{upfront} + Cost_{DIH,init} \\
= \$40M + \$230M \\
= \$270M
\end{gathered}
\]
The complete ROI includes the full timeline shift health benefits:
Step 1: Economic value of timeline shift
\[
\begin{gathered}
Value_{max} \\
= DALYs_{max} \times Value_{QALY} \\
= 565B \times \$150K \\
= \$84800T
\end{gathered}
\]
where:
\[
\begin{gathered}
DALYs_{max} \\
= DALYs_{global,ann} \times Pct_{avoid,DALY} \times T_{accel,max} \\
= 2.88B \times 92.6\% \times 212 \\
= 565B
\end{gathered}
\]
where:
\[
T_{accel,max} = T_{accel} + T_{lag} = 204 + 8.2 = 212
\]
where:
\[
\begin{gathered}
T_{accel} \\
= T_{first,SQ} \times \left(1 - \frac{1}{k_{capacity}}\right) \\
= 222 \times \left(1 - \frac{1}{12.3}\right) \\
= 204
\end{gathered}
\]
where:
\[
\begin{gathered}
T_{first,SQ} \\
= T_{queue,SQ} \times 0.5 \\
= 443 \times 0.5 \\
= 222
\end{gathered}
\]
where:
\[
\begin{gathered}
T_{queue,SQ} \\
= \frac{N_{untreated}}{Treatments_{new,ann}} \\
= \frac{6{,}650}{15} \\
= 443
\end{gathered}
\]
where:
\[
\begin{gathered}
N_{untreated} \\
= N_{rare} \times 0.95 \\
= 7{,}000 \times 0.95 \\
= 6{,}650
\end{gathered}
\]
where:
\[
\begin{gathered}
k_{capacity} \\
= \frac{N_{fundable,ref}}{Slots_{curr}} \\
= \frac{23.4M}{1.9M} \\
= 12.3
\end{gathered}
\]
where:
\[
\begin{gathered}
N_{fundable,ref} \\
= \frac{Subsidies_{trial,ref}}{Cost_{pragmatic,pt}} \\
= \frac{\$21.8B}{\$929} \\
= 23.4M
\end{gathered}
\]
where:
\[
\begin{gathered}
Subsidies_{trial,ref} \\
= Funding_{trial,ref} - OPEX_{trial} \\
= \$21.8B - \$40M \\
= \$21.8B
\end{gathered}
\]
where:
\[
\begin{gathered}
OPEX_{trial} \\
= Cost_{platform} + Cost_{staff} + Cost_{infra} \\
+ Cost_{regulatory} + Cost_{community} \\
= \$15M + \$10M + \$8M + \$5M + \$2M \\
= \$40M
\end{gathered}
\]
QALY Valuation Justification ($150,000 (90% CI: $100,384-$198,679)): This uses standard US economic valuations. WHO recommends $50,000-$150,000 (90% CI: $100,384-$198,679) per QALY for cost-effectiveness thresholds in high-income countries. The $150,000 (90% CI: $100,384-$198,679) value reflects revealed preferences from regulatory decisions (EPA, FDA), wage-risk tradeoffs, and health insurance willingness-to-pay studies. International analyses often use lower thresholds ($50-100K), which would reduce the ROI proportionally but not change the cost-saving classification.
Step 2: Calculate ROI
\[
\begin{gathered}
ROI_{max} \\
= \frac{Value_{max}}{Cost_{campaign}} \\
= \frac{\$84800T}{\$1B} \\
= 84.8M
\end{gathered}
\]
where:
\[
\begin{gathered}
Value_{max} \\
= DALYs_{max} \times Value_{QALY} \\
= 565B \times \$150K \\
= \$84800T
\end{gathered}
\]
where:
\[
\begin{gathered}
DALYs_{max} \\
= DALYs_{global,ann} \times Pct_{avoid,DALY} \times T_{accel,max} \\
= 2.88B \times 92.6\% \times 212 \\
= 565B
\end{gathered}
\]
where:
\[
T_{accel,max} = T_{accel} + T_{lag} = 204 + 8.2 = 212
\]
where:
\[
\begin{gathered}
T_{accel} \\
= T_{first,SQ} \times \left(1 - \frac{1}{k_{capacity}}\right) \\
= 222 \times \left(1 - \frac{1}{12.3}\right) \\
= 204
\end{gathered}
\]
where:
\[
\begin{gathered}
T_{first,SQ} \\
= T_{queue,SQ} \times 0.5 \\
= 443 \times 0.5 \\
= 222
\end{gathered}
\]
where:
\[
\begin{gathered}
T_{queue,SQ} \\
= \frac{N_{untreated}}{Treatments_{new,ann}} \\
= \frac{6{,}650}{15} \\
= 443
\end{gathered}
\]
where:
\[
\begin{gathered}
N_{untreated} \\
= N_{rare} \times 0.95 \\
= 7{,}000 \times 0.95 \\
= 6{,}650
\end{gathered}
\]
where:
\[
\begin{gathered}
k_{capacity} \\
= \frac{N_{fundable,ref}}{Slots_{curr}} \\
= \frac{23.4M}{1.9M} \\
= 12.3
\end{gathered}
\]
where:
\[
\begin{gathered}
N_{fundable,ref} \\
= \frac{Subsidies_{trial,ref}}{Cost_{pragmatic,pt}} \\
= \frac{\$21.8B}{\$929} \\
= 23.4M
\end{gathered}
\]
where:
\[
\begin{gathered}
Subsidies_{trial,ref} \\
= Funding_{trial,ref} - OPEX_{trial} \\
= \$21.8B - \$40M \\
= \$21.8B
\end{gathered}
\]
where:
\[
\begin{gathered}
OPEX_{trial} \\
= Cost_{platform} + Cost_{staff} + Cost_{infra} \\
+ Cost_{regulatory} + Cost_{community} \\
= \$15M + \$10M + \$8M + \$5M + \$2M \\
= \$40M
\end{gathered}
\]
where:
\[
\begin{gathered}
Cost_{campaign} \\
= Budget_{viral,base} + Budget_{lobby,treaty} \\
+ Budget_{reserve} \\
= \$250M + \$650M + \$100M \\
= \$1B
\end{gathered}
\]
Step 1: Identify daily mortality
- Global daily deaths from disease: 150,00014
Step 2: Apply avoidable fraction
- Eventually avoidable: 92.6% (95% CI: 50%-98%)
Step 3: Calculate lives saved from timeline shift
\[
\begin{gathered}
Lives_{max} \\
= Deaths_{disease,daily} \times T_{accel,max} \times 338 \\
= 150{,}000 \times 212 \times 338 \\
= 10.7B
\end{gathered}
\]
where:
\[
T_{accel,max} = T_{accel} + T_{lag} = 204 + 8.2 = 212
\]
where:
\[
\begin{gathered}
T_{accel} \\
= T_{first,SQ} \times \left(1 - \frac{1}{k_{capacity}}\right) \\
= 222 \times \left(1 - \frac{1}{12.3}\right) \\
= 204
\end{gathered}
\]
where:
\[
\begin{gathered}
T_{first,SQ} \\
= T_{queue,SQ} \times 0.5 \\
= 443 \times 0.5 \\
= 222
\end{gathered}
\]
where:
\[
\begin{gathered}
T_{queue,SQ} \\
= \frac{N_{untreated}}{Treatments_{new,ann}} \\
= \frac{6{,}650}{15} \\
= 443
\end{gathered}
\]
where:
\[
\begin{gathered}
N_{untreated} \\
= N_{rare} \times 0.95 \\
= 7{,}000 \times 0.95 \\
= 6{,}650
\end{gathered}
\]
where:
\[
\begin{gathered}
k_{capacity} \\
= \frac{N_{fundable,ref}}{Slots_{curr}} \\
= \frac{23.4M}{1.9M} \\
= 12.3
\end{gathered}
\]
where:
\[
\begin{gathered}
N_{fundable,ref} \\
= \frac{Subsidies_{trial,ref}}{Cost_{pragmatic,pt}} \\
= \frac{\$21.8B}{\$929} \\
= 23.4M
\end{gathered}
\]
where:
\[
\begin{gathered}
Subsidies_{trial,ref} \\
= Funding_{trial,ref} - OPEX_{trial} \\
= \$21.8B - \$40M \\
= \$21.8B
\end{gathered}
\]
where:
\[
\begin{gathered}
OPEX_{trial} \\
= Cost_{platform} + Cost_{staff} + Cost_{infra} \\
+ Cost_{regulatory} + Cost_{community} \\
= \$15M + \$10M + \$8M + \$5M + \$2M \\
= \$40M
\end{gathered}
\]
Regulatory Delay Elimination Derivation
Step 1: Lives Saved from Lag Elimination
\[
\begin{gathered}
Deaths_{lag} \\
= T_{lag} \times Deaths_{disease,daily} \times 338 \\
= 8.2 \times 150{,}000 \times 338 \\
= 416M
\end{gathered}
\]
Step 2: Economic Value of Lag Elimination
\[
\begin{gathered}
Value_{lag} \\
= DALYs_{lag} \times Value_{QALY} \\
= 8.77B \times \$150K \\
= \$1320T
\end{gathered}
\]
where:
\[
DALYs_{lag} = YLL_{lag} + YLD_{lag} = 7.9B + 873M = 8.77B
\]
where:
\[
\begin{gathered}
YLL_{lag} \\
= \text{DEATHS\_TOTAL} \times (REMAINING_LIFE_EXPECTANCY_AT_60 - (\text{MEAN\_AGE\_OF\_DEATH} - 60))
\end{gathered}
\]
where:
\[
\begin{gathered}
Deaths_{lag} \\
= T_{lag} \times Deaths_{disease,daily} \times 338 \\
= 8.2 \times 150{,}000 \times 338 \\
= 416M
\end{gathered}
\]
where:
\[
\begin{gathered}
YLD_{lag} \\
= Deaths_{lag} \times T_{suffering} \times DW_{chronic} \\
= 416M \times 6 \times 0.35 \\
= 873M
\end{gathered}
\]
Annual Recurring Benefits Derivation
\[
\begin{gathered}
Benefit_{peace+RD} \\
= Benefit_{peace,soc} + Benefit_{RD,ann} \\
= \$114B + \$40.5B \\
= \$154B
\end{gathered}
\]
where:
\[
\begin{gathered}
Benefit_{peace,soc} \\
= Cost_{war,total} \times Reduce_{treaty} \\
= \$11.4T \times 1\% \\
= \$114B
\end{gathered}
\]
where:
\[
\begin{gathered}
Cost_{war,total} \\
= Cost_{war,direct} + Cost_{war,indirect} \\
= \$7.66T + \$3.7T \\
= \$11.4T
\end{gathered}
\]
where:
\[
\begin{gathered}
Cost_{war,direct} \\
= Loss_{life,conflict} + Damage_{infra,total} \\
+ Disruption_{trade} + Spending_{mil} \\
= \$2.45T + \$1.88T + \$616B + \$2.72T \\
= \$7.66T
\end{gathered}
\]
where:
\[
\begin{gathered}
Loss_{life,conflict} \\
= Cost_{combat,human} + Cost_{state,human} \\
+ Cost_{terror,human} \\
= \$2.34T + \$27B + \$83B \\
= \$2.45T
\end{gathered}
\]
where:
\[
\begin{gathered}
Cost_{combat,human} \\
= Deaths_{combat} \times VSL \\
= 234{,}000 \times \$10M \\
= \$2.34T
\end{gathered}
\]
where:
\[
\begin{gathered}
Cost_{state,human} \\
= Deaths_{state} \times VSL \\
= 2{,}700 \times \$10M \\
= \$27B
\end{gathered}
\]
where:
\[
\begin{gathered}
Cost_{terror,human} \\
= Deaths_{terror} \times VSL \\
= 8{,}300 \times \$10M \\
= \$83B
\end{gathered}
\]
where:
\[
\begin{gathered}
Damage_{infra,total} \\
= Damage_{comms} + Damage_{edu} + Damage_{energy} \\
+ Damage_{health} + Damage_{transport} + Damage_{water} \\
= \$298B + \$234B + \$422B + \$166B + \$487B + \$268B \\
= \$1.88T
\end{gathered}
\]
where:
\[
\begin{gathered}
Disruption_{trade} \\
= Disruption_{currency} + Disruption_{energy} \\
+ Disruption_{shipping} + Disruption_{supply} \\
= \$57.4B + \$125B + \$247B + \$187B \\
= \$616B
\end{gathered}
\]
where:
\[
\begin{gathered}
Cost_{war,indirect} \\
= Damage_{env} + Loss_{growth,mil} + Loss_{capital,conflict} \\
+ Cost_{psych} + Cost_{refugee} + Cost_{vet} \\
= \$100B + \$2.72T + \$300B + \$232B + \$150B + \$200B \\
= \$3.7T
\end{gathered}
\]
where:
\[
\begin{gathered}
Benefit_{RD,ann} \\
= Spending_{trials} \times Pct_{P2+P3} \times Reduce_{pct} \\
= \$60B \times 69\% \times 97.7\% \\
= \$40.5B
\end{gathered}
\]
where:
\[
\begin{gathered}
Reduce_{pct} \\
= 1 - \frac{Cost_{pragmatic,pt}}{Cost_{P3,pt}} \\
= 1 - \frac{\$929}{\$41K} \\
= 97.7\%
\end{gathered}
\]
Verification Summary
| Trial Capacity |
12.3x (90% CI: 4.92x-50.8x) |
Patients fundable ÷ current slots |
Funding, trial cost, current capacity |
| Timeline Shift |
212 years (90% CI: 124 years-398 years) |
Treatment acceleration + efficacy lag |
Discovery capacity model, multiplier, regulatory data |
| DALYs Averted |
565 billion |
DALY burden × avoidable × shift |
WHO GBD, avoidability assumption |
| Cost/DALY |
$0.00177 (90% CI: $0.000809-$0.00354) |
Implementation cost ÷ DALYs |
Implementation budget, DALYs |
| ROI (Conservative) |
439 (90% CI: 321-600):1 |
NPV benefits ÷ NPV costs |
Trial savings, discount rate |
| ROI (Complete) |
84.8 million (90% CI: 39.6 million-194 million):1 |
Economic value ÷ implementation cost |
QALY valuation, timeline shift |
| Lives Saved |
10.7 billion |
Daily deaths × avoidable × shift |
WHO mortality, timeline shift |
| Delay Lives |
416 million deaths (90% CI: 244 million deaths-587 million deaths) |
Daily deaths × lag × avoidable |
WHO mortality, lag years |
| Delay Value |
$1.32 quadrillion (90% CI: $676 trillion-$2.14 quadrillion) |
Delay DALYs × QALY Value |
Delay DALYs, QALY ($150k) |
Sensitivity to key assumptions: The tornado diagrams throughout this document show that results are most sensitive to: (1) timeline shift duration, (2) QALY valuation, and (3) eventually avoidable percentage. Even under conservative parameter assumptions (lower timeline shift, lower QALY values, lower avoidability), the intervention remains cost-saving.
For complete parameter definitions, uncertainty ranges, and Monte Carlo distributions, see Parameters and Calculations.
Counterfactual Baseline Specification
This cost-effectiveness analysis uses the status quo as the baseline counterfactual: military spending continues at current levels ($2.72 trillion61 annually) and is allocated to traditional military purposes. Under this baseline, the $27.2 billion redirected to pragmatic clinical trials infrastructure would otherwise remain in military budgets.
Alternative counterfactual scenarios include:
Military R&D continuation: The $27.2 billion continues funding military research and development, potentially yielding civilian technology spillovers (e.g., GPS, internet protocols, materials science advances). This scenario is partially addressed in the peace dividend calculations, which acknowledge that military spending generates economic multiplier effects of 0.5-1.0× compared to pragmatic clinical trial multipliers of 2.0-3.0×.
Return to taxpayers: Funds are returned via tax cuts, enabling private consumption and investment. Under this scenario, the opportunity cost equals the weighted average return on private capital (approximately 3% annually in developed economies).
Alternative government priorities: Reallocation to other public investments such as infrastructure, education, or climate mitigation. Each alternative use would require separate cost-benefit analysis to determine relative efficiency.
Methodological note on baseline selection: The economically rigorous baseline is the “next best alternative use” rather than “status quo continuation.” However, identifying the single next-best alternative requires comprehensive comparison across all possible uses of public funds, which exceeds the scope of this analysis. This analysis therefore focuses on the conditional benefits of the system: the health and economic gains achievable by redirecting $27.2 billion from military to medical research infrastructure.
Conservative interpretation: Even if alternative uses generate positive economic value, a global pragmatic trial system exhibits dominant intervention characteristics (cost-saving: $0.00177 (90% CI: $0.000809-$0.00354) per DALY), indicating it saves costs while improving health outcomes. Under standard cost-effectiveness frameworks, dominant interventions are unconditionally recommended regardless of alternative uses, as they represent free gains in both dimensions (reduced costs and improved health).
Peace Dividend Calculation Methodology
Economic benefits of reduced military spending
- Direct fiscal savings (Cash): $27.2 billion available for productive investment. This is the floor.
- Diplomatic De-escalation (Upside): Reduced conflict-related economic damage (trade disruption, infrastructure destruction, refugee costs).
Opportunity Cost & Signal Value: The argument isn’t just that 1% less budget stops 1% of bullets linearly. It’s that 1% redirected to shared survival goals (curing disease) acts as a confidence-building measure (CBM) in arms control theory. It signals a shift from zero-sum competition to positive-sum cooperation.
Conservative estimate: Analysis uses $114 billion (90% CI: $99.6 billion-$129 billion) annual peace dividend. Even if conflict intensity doesn’t drop linearly, the $27.2 billion annual cash reallocation is real. The ROI works on the cash alone; peace is a massive bonus.
War Costs Breakdown
| Direct Military Spending |
$2.72 trillion61 |
SIPRI 2024 global military budgets (source)149 |
| Infrastructure Destruction |
$1.88 trillion (90% CI: $1.65 trillion-$2.1 trillion) |
Transportation, energy, communications, water, education, healthcare facilities |
| Human Life Losses |
$2.45 trillion (90% CI: $1.34 trillion-$3.71 trillion) |
245 thousand deaths/year (90% CI: 198 thousand deaths/year-297 thousand deaths/year) conflict deaths × $10 million (95% CI: $5 million-$15 million)130 value of statistical life (conservative estimate) |
| Trade Disruption |
$616 billion (90% CI: $526 billion-$716 billion) |
Shipping, supply chains, energy prices, currency volatility |
| Lost Economic Growth |
$2.72 trillion (95% CI: $1.9 trillion-$3.8 trillion)47 |
Opportunity cost of military spending vs. productive investment |
| Veteran Healthcare |
$200 billion (95% CI: $140 billion-$280 billion)51 |
Long-term medical care for conflict-related injuries |
| Refugee Support |
$150 billion (95% CI: $105 billion-$210 billion)50 |
108.4M displaced persons150 × $1,384/year50 |
| Environmental Damage |
$100 billion (95% CI: $70 billion-$140 billion)46 |
Environmental destruction, toxic contamination, restoration costs |
| Psychological Impact |
$232 billion (95% CI: $162 billion-$325 billion)49 |
PTSD treatment, mental health services, productivity loss |
| Lost Human Capital |
$300 billion (95% CI: $210 billion-$420 billion)48 |
Productive capacity lost from casualties and displacement |
| Total War Costs |
$11.4 trillion (90% CI: $9.96 trillion-$12.9 trillion) |
Combined direct and indirect annual costs |
| 1% Reduction |
$114 billion (90% CI: $99.6 billion-$129 billion) |
Peace dividend from 1% treaty implementation |
This calculation methodology follows standard cost-of-conflict analysis frameworks used by the World Bank, IMF, and academic conflict economics research.
Note on confidence levels: The direct military spending reduction ($27.2 billion) has high confidence. The remaining conflict cost reductions assume proportional scaling (1% military spending → 1% conflict reduction) which lacks empirical validation. Conservative scenarios should use only direct fiscal savings; optimistic scenarios can include full peace dividend effects.
Sensitivity of peace dividend estimate: The tornado chart below shows which cost components have the largest impact on the total peace dividend. The primary drivers are infrastructure destruction costs and lost economic growth:
Confidence level separation: The peace dividend calculation separates into two components:
Direct fiscal savings (high confidence): $27.2 billion - The 1% reduction in military budgets ($27.2 billion) represents direct fiscal savings with high certainty. These funds are immediately available for reallocation.
Conflict reduction benefits (upside scenario): $86.4 billion (90% CI: $72.4 billion-$101 billion) - The remaining $86.4 billion (90% CI: $72.4 billion-$101 billion) models the benefits if conflict costs reduce proportionally. While the causal link between marginal budget cuts and conflict intensity is complex, the directionality is positive.
\[
\begin{gathered}
Savings_{conflict} \\
= Benefit_{peace,soc} - Funding_{treaty} \\
= \$114B - \$27.2B \\
= \$86.4B
\end{gathered}
\]
where:
\[
\begin{gathered}
Benefit_{peace,soc} \\
= Cost_{war,total} \times Reduce_{treaty} \\
= \$11.4T \times 1\% \\
= \$114B
\end{gathered}
\]
where:
\[
\begin{gathered}
Cost_{war,total} \\
= Cost_{war,direct} + Cost_{war,indirect} \\
= \$7.66T + \$3.7T \\
= \$11.4T
\end{gathered}
\]
where:
\[
\begin{gathered}
Cost_{war,direct} \\
= Loss_{life,conflict} + Damage_{infra,total} \\
+ Disruption_{trade} + Spending_{mil} \\
= \$2.45T + \$1.88T + \$616B + \$2.72T \\
= \$7.66T
\end{gathered}
\]
where:
\[
\begin{gathered}
Loss_{life,conflict} \\
= Cost_{combat,human} + Cost_{state,human} \\
+ Cost_{terror,human} \\
= \$2.34T + \$27B + \$83B \\
= \$2.45T
\end{gathered}
\]
where:
\[
\begin{gathered}
Cost_{combat,human} \\
= Deaths_{combat} \times VSL \\
= 234{,}000 \times \$10M \\
= \$2.34T
\end{gathered}
\]
where:
\[
\begin{gathered}
Cost_{state,human} \\
= Deaths_{state} \times VSL \\
= 2{,}700 \times \$10M \\
= \$27B
\end{gathered}
\]
where:
\[
\begin{gathered}
Cost_{terror,human} \\
= Deaths_{terror} \times VSL \\
= 8{,}300 \times \$10M \\
= \$83B
\end{gathered}
\]
where:
\[
\begin{gathered}
Damage_{infra,total} \\
= Damage_{comms} + Damage_{edu} + Damage_{energy} \\
+ Damage_{health} + Damage_{transport} + Damage_{water} \\
= \$298B + \$234B + \$422B + \$166B + \$487B + \$268B \\
= \$1.88T
\end{gathered}
\]
where:
\[
\begin{gathered}
Disruption_{trade} \\
= Disruption_{currency} + Disruption_{energy} \\
+ Disruption_{shipping} + Disruption_{supply} \\
= \$57.4B + \$125B + \$247B + \$187B \\
= \$616B
\end{gathered}
\]
where:
\[
\begin{gathered}
Cost_{war,indirect} \\
= Damage_{env} + Loss_{growth,mil} + Loss_{capital,conflict} \\
+ Cost_{psych} + Cost_{refugee} + Cost_{vet} \\
= \$100B + \$2.72T + \$300B + \$232B + \$150B + \$200B \\
= \$3.7T
\end{gathered}
\]
where:
\[
\begin{gathered}
Funding_{treaty} \\
= Spending_{mil} \times Reduce_{treaty} \\
= \$2.72T \times 1\% \\
= \$27.2B
\end{gathered}
\]
Conservative interpretation: The direct fiscal savings ($27.2 billion annually) are certain. The “peace dividend” is treated as an upside scenario in the conservative case, ensuring the economic model doesn’t rely on optimistic geopolitical outcomes. The ROI remains positive on R&D savings alone.
Research Acceleration Mechanism
The 12.3x (90% CI: 4.92x-50.8x) research acceleration multiplier comes from the combination of multiple proven accelerators:
Faster Recruitment: The Oxford RECOVERY trial recruited 47,000+ patients across nearly 200 hospitals151, while 80% of traditional trials fail to meet enrollment timelines152. This speed comes from pragmatic eligibility (minimal exclusions153 vs. 86.1% excluded traditionally) and embedded recruitment in routine care.
Faster Completion: Pragmatic trials complete in 3-12 months instead of 3-5 years because patient subsidies flip economic incentives. Physicians gain revenue from trial participation rather than losing it, eliminating the perverse incentives that delay traditional trials.
Massive Parallelization: With more trials running simultaneously (vs. 10,000 trials18 today), the framework achieves substantially more concurrent research. Universal patient participation makes this possible, as every doctor’s office becomes a trial site.
Higher Completion Rates: More of pragmatic trials complete (vs. 40%22 abandonment rate today) because patients are subsidized and physicians profit from participation.
The 12.3x (90% CI: 4.92x-50.8x) figure itself comes only from funding divided by per-patient cost (derived in the Economist Verification section); these factors are what make that added capacity usable.
Generalizability of Cost Savings: Critics regarding RECOVERY and ADAPTABLE as outliers should note that a systematic review of 64 embedded pragmatic clinical trials94 found a median cost per participant of just $97 (95% CI: $19-$478) (IQR $19–$478). High-cost traditional trials are necessary only for first-in-human safety testing. For the 9.5 million combinations (90% CI: 6.68 million combinations-12.8 million combinations) unexplored combinations of already-safe compounds (repurposing), pragmatic protocols are sufficient, covering the vast majority (>90%) of the therapeutic search space.
Sensitivity of research acceleration estimate: The tornado chart below shows which input parameters have the largest impact on the trial capacity multiplier. The width of each bar shows how much the multiplier changes when that parameter varies across its uncertainty range:
Automating Friction, Not Judgment: The system operates as automated infrastructure analyzing time-series EHR data from electronic health records, wearables, and apps. The 12.3x (90% CI: 4.92x-50.8x) research acceleration does not require 12.3x (90% CI: 4.92x-50.8x) more Principal Investigators.
The bottleneck in clinical research is administrative friction, not scientific talent.
Currently, researchers spend up to 50% of their time154 on grants and administrative tasks. The trial protocol automates this overhead, leaving human judgment for hypothesis generation and complex safety signal interpretation.
Compliance automation: A global pragmatic trial system wraps the requirements of the regulatory bodies involved (FDA, EMA, PMDA, Health Canada, TGA, etc.) into one submission. Researchers define their hypothesis and patient population; the system automatically:
- Generates IRB submissions for each jurisdiction
- Handles liability insurance and indemnification
- Creates compliant protocol documents for each agency
- Submits applications simultaneously to multiple regulatory bodies
- Aggregates real-world evidence into agency-specific formats
- Manages ongoing reporting requirements across jurisdictions
The system uses federated queries (data stays in EHR and consumer health app systems) rather than centralized databases, enabling analysis without data movement. Physicians continue normal clinical practice; the system automatically detects patterns, identifies treatment effects, and flags signals for peer review. This is fundamentally different from traditional research models that scale linearly with researcher headcount.
Treatment Discovery Through Therapeutic Space Exploration
The 12.3x (90% CI: 4.92x-50.8x) research acceleration transforms our ability to explore the vast therapeutic space where undiscovered treatments already exist.
The Unexplored Therapeutic Frontier
The problem is less that effective treatments are hard to find than that almost nobody is looking:
\[
\begin{gathered}
N_{combos} \\
= N_{safe} \times N_{diseases,trial} \\
= 9{,}500 \times 1{,}000 \\
= 9.5M
\end{gathered}
\]
Some effective treatments are probably sitting among compounds already proven safe. Nobody has looked.
Current Exploration Rate vs. Therapeutic Space
Under the status quo:
\[
\begin{gathered}
T_{first,SQ} \\
= T_{queue,SQ} \times 0.5 \\
= 443 \times 0.5 \\
= 222
\end{gathered}
\]
where:
\[
\begin{gathered}
T_{queue,SQ} \\
= \frac{N_{untreated}}{Treatments_{new,ann}} \\
= \frac{6{,}650}{15} \\
= 443
\end{gathered}
\]
where:
\[
\begin{gathered}
N_{untreated} \\
= N_{rare} \times 0.95 \\
= 7{,}000 \times 0.95 \\
= 6{,}650
\end{gathered}
\]
This calculation is empirically grounded: only ~5% of the 7,000 diseases (95% CI: 6,000 diseases-10,000 diseases) rare diseases have FDA-approved treatments after 40+ years of the Orphan Drug Act. At the current rate of 15 diseases/year (95% CI: 8 diseases/year-30 diseases/year) diseases/year getting first treatments, most of the therapeutic space remains permanently unexplored.
With framework implementation:
\[
\begin{gathered}
Treatments_{trial,ann} \\
= Treatments_{new,ann} \times k_{capacity} \\
= 15 \times 12.3 \\
= 185
\end{gathered}
\]
where:
\[
\begin{gathered}
k_{capacity} \\
= \frac{N_{fundable,ref}}{Slots_{curr}} \\
= \frac{23.4M}{1.9M} \\
= 12.3
\end{gathered}
\]
where:
\[
\begin{gathered}
N_{fundable,ref} \\
= \frac{Subsidies_{trial,ref}}{Cost_{pragmatic,pt}} \\
= \frac{\$21.8B}{\$929} \\
= 23.4M
\end{gathered}
\]
where:
\[
\begin{gathered}
Subsidies_{trial,ref} \\
= Funding_{trial,ref} - OPEX_{trial} \\
= \$21.8B - \$40M \\
= \$21.8B
\end{gathered}
\]
where:
\[
\begin{gathered}
OPEX_{trial} \\
= Cost_{platform} + Cost_{staff} + Cost_{infra} \\
+ Cost_{regulatory} + Cost_{community} \\
= \$15M + \$10M + \$8M + \$5M + \$2M \\
= \$40M
\end{gathered}
\]
\[
\begin{gathered}
T_{queue,trial} \\
= \frac{T_{queue,SQ}}{k_{capacity}} \\
= \frac{443}{12.3} \\
= 36
\end{gathered}
\]
where:
\[
\begin{gathered}
T_{queue,SQ} \\
= \frac{N_{untreated}}{Treatments_{new,ann}} \\
= \frac{6{,}650}{15} \\
= 443
\end{gathered}
\]
where:
\[
\begin{gathered}
N_{untreated} \\
= N_{rare} \times 0.95 \\
= 7{,}000 \times 0.95 \\
= 6{,}650
\end{gathered}
\]
where:
\[
\begin{gathered}
k_{capacity} \\
= \frac{N_{fundable,ref}}{Slots_{curr}} \\
= \frac{23.4M}{1.9M} \\
= 12.3
\end{gathered}
\]
where:
\[
\begin{gathered}
N_{fundable,ref} \\
= \frac{Subsidies_{trial,ref}}{Cost_{pragmatic,pt}} \\
= \frac{\$21.8B}{\$929} \\
= 23.4M
\end{gathered}
\]
where:
\[
\begin{gathered}
Subsidies_{trial,ref} \\
= Funding_{trial,ref} - OPEX_{trial} \\
= \$21.8B - \$40M \\
= \$21.8B
\end{gathered}
\]
where:
\[
\begin{gathered}
OPEX_{trial} \\
= Cost_{platform} + Cost_{staff} + Cost_{infra} \\
+ Cost_{regulatory} + Cost_{community} \\
= \$15M + \$10M + \$8M + \$5M + \$2M \\
= \$40M
\end{gathered}
\]
Additionally, eliminating the 8.2 years (90% CI: 4.84 years-11.5 years) efficacy lag means discovered treatments reach patients immediately. The total timeline shift is 212 years (90% CI: 124 years-398 years) (discovery acceleration + efficacy lag elimination).
\[
T_{accel,max} = T_{accel} + T_{lag} = 204 + 8.2 = 212
\]
where:
\[
\begin{gathered}
T_{accel} \\
= T_{first,SQ} \times \left(1 - \frac{1}{k_{capacity}}\right) \\
= 222 \times \left(1 - \frac{1}{12.3}\right) \\
= 204
\end{gathered}
\]
where:
\[
\begin{gathered}
T_{first,SQ} \\
= T_{queue,SQ} \times 0.5 \\
= 443 \times 0.5 \\
= 222
\end{gathered}
\]
where:
\[
\begin{gathered}
T_{queue,SQ} \\
= \frac{N_{untreated}}{Treatments_{new,ann}} \\
= \frac{6{,}650}{15} \\
= 443
\end{gathered}
\]
where:
\[
\begin{gathered}
N_{untreated} \\
= N_{rare} \times 0.95 \\
= 7{,}000 \times 0.95 \\
= 6{,}650
\end{gathered}
\]
where:
\[
\begin{gathered}
k_{capacity} \\
= \frac{N_{fundable,ref}}{Slots_{curr}} \\
= \frac{23.4M}{1.9M} \\
= 12.3
\end{gathered}
\]
where:
\[
\begin{gathered}
N_{fundable,ref} \\
= \frac{Subsidies_{trial,ref}}{Cost_{pragmatic,pt}} \\
= \frac{\$21.8B}{\$929} \\
= 23.4M
\end{gathered}
\]
where:
\[
\begin{gathered}
Subsidies_{trial,ref} \\
= Funding_{trial,ref} - OPEX_{trial} \\
= \$21.8B - \$40M \\
= \$21.8B
\end{gathered}
\]
where:
\[
\begin{gathered}
OPEX_{trial} \\
= Cost_{platform} + Cost_{staff} + Cost_{infra} \\
+ Cost_{regulatory} + Cost_{community} \\
= \$15M + \$10M + \$8M + \$5M + \$2M \\
= \$40M
\end{gathered}
\]
Note: Valley of death rescue (1.4x (90% CI: 1.26x-1.54x)) adds more drug candidates to the pipeline, further expanding the explorable therapeutic space.
\[
k_{rescue} = Attrition_{valley} + 1 = 40\% + 1 = 1.4
\]
This acceleration applies across all diseases, not just well-funded ones. The current system prioritizes diseases with commercial potential; the framework’s universal trial infrastructure removes economic barriers that leave rare and neglected diseases permanently unexplored.
Addressing the Returns Question: Diminishing, Linear, or Compounding?
A common objection is that “more trials won’t produce proportionally more treatments,” the diminishing returns hypothesis. This deserves serious consideration, but the evidence suggests the opposite may be true.
Important distinction: Bloom et al. (2020)155 document declining research productivity (~5% annually across industries), but this measures idea productivity (breakthroughs per researcher-year). This intervention targets a different margin: trial execution efficiency (cost per patient enrolled, completion rates, recruitment speed). Streamlining data collection is not the same as discovering new biology.
Why Diminishing Returns Is Unlikely (We Haven’t Started Looking)
The diminishing returns objection assumes we’ve exhausted low-hanging fruit. But we’ve barely begun:
- Single compounds alone: 9.5 million combinations (90% CI: 6.68 million combinations-12.8 million combinations) possible combinations of known safe compounds × diseases. At current trial capacity, systematically testing these would take 2,879 years (90% CI: 1,976 years-4,041 years). We won’t finish until the year 5000.
\[
\begin{gathered}
T_{explore,safe} \\
= \frac{N_{combos}}{Trials_{ann,curr}} \\
= \frac{9.5M}{3{,}300} \\
= 2{,}880
\end{gathered}
\]
where:
\[
\begin{gathered}
N_{combos} \\
= N_{safe} \times N_{diseases,trial} \\
= 9{,}500 \times 1{,}000 \\
= 9.5M
\end{gathered}
\]
- Combination therapies expand the space: Modern medicine relies on multi-drug regimens (oncology, HIV, cardiology). Pairwise combinations of safe compounds create 45.1 billion combinations (90% CI: 25 billion combinations-72.6 billion combinations) possibilities, requiring 13.7 million years (90% CI: 7.45 million years-22.6 million years) at current pace, longer than Homo sapiens has existed.
\[
\begin{gathered}
Space_{combo} \\
= N_{combo} \times N_{diseases,trial} \\
= 45.1M \times 1{,}000 \\
= 45.1B
\end{gathered}
\]
where:
\[
N_{combo} = \frac{N_{safe} \cdot (N_{safe} - 1)}{2}
\]
Repurposing success proves effective treatments exist: 30% of approved drugs gain new indications, demonstrating the unexplored space contains discoveries.
Most biology is untargeted: Only 12% of the human interactome has been targeted. We’re ignoring 88% of our own biology.
Systematic search yields rapid discoveries: The Oxford RECOVERY trial discovered multiple effective COVID treatments in months because it looked systematically. This pattern replicates across the 108+ pragmatic trials in the Harvard meta-analysis135.
The Case for Compounding Returns
Platform technologies may actually produce increasing returns per trial over time:
Expanding the candidate pipeline:
- mRNA platforms: COVID vaccines demonstrated mRNA can be designed in days. This platform applies to cancer, infectious diseases, and potentially genetic disorders, vastly expanding testable candidates
- AI drug discovery: Machine learning models increasingly predict drug-target interactions, enabling smarter trial selection. DeepMind’s AlphaFold solved protein structure prediction; similar approaches will prioritize high-probability combinations
- Epigenetic reprogramming: Yamanaka factors demonstrated cellular reprogramming. As this technology matures, entirely new therapeutic modalities become testable
- Gene therapy platforms: AAV vectors, plasmid delivery, and CRISPR-based approaches create thousands of new candidate therapies annually
Learning effects that improve success rates:
- Predictive analytics: Each completed trial generates data that improves predictions for future trials. As the framework accumulates outcomes across millions of patients, machine learning models will increasingly identify which drug-disease combinations merit testing
- Network pharmacology: Understanding how drugs affect biological networks (not just single targets) reveals unexpected therapeutic applications. More data = better network models = higher hit rates
- Biomarker discovery: Large-scale trial data identifies patient subpopulations who respond to specific treatments, enabling precision targeting that increases trial success rates
- Failure analysis: Systematically studying why trials fail (wrong dose, wrong population, wrong endpoint) improves future trial design
- Biological model refinement: Every trial (success or failure) teaches us how human biology responds to interventions. This cumulative knowledge improves our mechanistic understanding of disease pathways, enabling increasingly accurate prediction of which candidates will work. The ratio of effective treatments per trial should increase over time, not decrease.
Mathematical Framework: When Would Diminishing Returns Dominate?
We can formalize the competing models to identify when diminishing returns would actually matter.
Model 1: Linear (Baseline)
\[
T_{discovered} = k_0 \cdot N_{trials}
\]
Where \(k_0\) is the constant discovery rate (effective treatments per trial). This assumes the therapeutic space is sampled uniformly at random.
Model 2: Diminishing Returns (Pessimistic)
As we exhaust the therapeutic space, the hit rate decreases:
\[
k_{dim}(s) = k_0 \cdot (1 - s)
\]
Where \(s = S_{explored}/S_{total}\) is the fraction of therapeutic space already tested. At current exploration (\(s < 0.01\)), this gives \(k_{dim} \approx 0.99 \cdot k_0\), virtually identical to linear.
Model 3: Learning/Compounding (Optimistic)
Each trial improves our biological models, increasing future hit rates:
\[
k_{learn}(n) = k_0 \cdot \left(1 + \alpha \cdot \ln(1 + n)\right)
\]
Where \(\alpha\) is the learning coefficient and \(n\) is cumulative trials completed. Even modest learning (\(\alpha = 0.1\)) with 100,000 trials yields \(k_{learn} \approx 2.15 \cdot k_0\).
Model 4: Combined (Realistic)
Both effects operate simultaneously:
\[
k_{combined}(s, n) = k_0 \cdot (1 - s) \cdot \left(1 + \alpha \cdot \ln(1 + n)\right)
\]
The Crossover Point: When Does Depletion Dominate Learning?
Diminishing returns dominates when the depletion factor exceeds the learning factor:
\[
(1 - s) < \frac{1}{1 + \alpha \cdot \ln(1 + n)}
\]
Solving for the critical exploration fraction:
\[
s_{crossover} = 1 - \frac{1}{1 + \alpha \cdot \ln(1 + n)}
\]
Numerical Analysis:
| 0.05 (weak) |
100,000 |
37% |
| 0.10 (modest) |
100,000 |
53% |
| 0.15 (strong) |
100,000 |
63% |
| 0.10 (modest) |
1,000,000 |
61% |
Interpretation: Even with weak learning effects, diminishing returns only dominates after exploring 37%+ of therapeutic space. With modest learning, the crossover occurs at 53%+ exploration.
Timeline to Crossover:
At current exploration of 0.342% (90% CI: 0%-1%) (<1%), reaching the 53% crossover would require:
For combination therapies (45.1 billion combinations (90% CI: 25 billion combinations-72.6 billion combinations)), reaching 53% exploration would take:
- Current pace: ~7 million years
- With framework: ~600,000 years
Conclusion: For any plausible planning horizon, learning effects dominate. Diminishing returns is a theoretical concern for civilizations operating on multi-century timescales, not a practical constraint for the next 100+ years of medical research.
The Conservative Default: Linear Assumption
Given genuine uncertainty about whether returns are diminishing or compounding, our analysis assumes a linear relationship between trial capacity and treatment discoveries. This is the conservative choice because:
- It’s the neutral prior: Without strong evidence for either diminishing or compounding returns, linearity is the least assumptive model
- It may underestimate benefits: If platform technologies and learning effects produce compounding returns, our projections are conservative
- It’s empirically defensible: The RECOVERY trial’s success (multiple treatments found with increased search) is consistent with linear or better returns
Bottom line: Even under the conservative linear assumption, 12.3x (90% CI: 4.92x-50.8x) more trials produces 12.3x (90% CI: 4.92x-50.8x) more discoveries from a space that is 99%+ unexplored.
Sensitivity Analysis Approach
The analysis employs comprehensive sensitivity testing across multiple scenarios to assess robustness of findings:
Conservative Scenario (439 (90% CI: 321-600):1 ROI):
- R&D cost reduction: 97.7% (90% CI: 92%-100%)
- Health benefits: excluded
- Adoption timeline: 5 years to full adoption
- Includes only R&D efficiency savings (excludes the peace dividend and all health benefits)
Complete Case (84.8 million (90% CI: 39.6 million-194 million):1 ROI):
Probabilistic sensitivity analysis: We ran 10,000 Monte Carlo simulations where each uncertain parameter was randomly sampled from probability distributions. The chart below shows the resulting ROI distributions with 95% confidence intervals.
What we varied: every input with a specified distribution, including per-patient trial cost, political success probability, adoption timeline, discount rate, and the avoidable share of disease burden; the distributions are listed in Parameters and Calculations.
Economic interpretation: ROI > 1:1 means benefits exceed costs. All simulations produce ROI > 1:1, meaning there is effectively zero probability (within the modeled uncertainty) that this intervention loses money. Even the most conservative scenario (R&D savings only at 439 (90% CI: 321-600):1) generates positive returns. This qualifies as a dominant intervention in health economics: it should be implemented regardless of budget constraints, as it generates net economic surplus while improving health outcomes.
Which parameters matter most for conservative ROI? The tornado chart below shows the sensitivity of the R&D-only ROI estimate to each input parameter. Parameters at the top have the largest impact on the final result:
For comprehensive sensitivity analysis including tornado charts for all calculated parameters, see Parameters and Calculations.
Key Analytical Assumptions
This analysis rests on several core assumptions that should be made explicit for academic transparency:
Strategic Stability Assumption
Assumption: A coordinated 1% reduction in military spending across all nations maintains relative power balances and strategic deterrence capabilities.
Justification: The 1% Treaty explicitly requires proportional reductions from all signatories. Since relative military capabilities remain unchanged, strategic stability is preserved. Historical analysis shows that symmetric reductions in military tensions (e.g., START treaties, naval treaties between world wars) maintained deterrence while reducing absolute expenditure.
Sensitivity: This assumption is critical to the peace dividend calculation. Alternative scenarios modeling unilateral reductions would require different political economy frameworks.
Linear Scaling Assumption
Assumption: Economic benefits and costs scale approximately linearly with program scope and adoption rates.
Justification: Conservative assumption that costs scale with system usage. Research acceleration benefits may exhibit superlinear returns (network effects, data abundance), making this assumption conservative.
Adoption Rate Assumptions
Assumption: The framework achieves gradual adoption following a 5 years linear ramp (20%, 40%, 60%, 80%, 100%) to full participation among eligible trials.
Justification: Based on historical adoption curves for electronic health records (5-10 years to majority adoption), clinical trial registry systems, and FDA Sentinel System implementation.
Adoption realism considerations: Technology adoption typically follows S-curve dynamics with critical mass thresholds rather than linear ramps. Coordination failure risk exists (prisoner’s dilemma: pharmaceutical companies may prefer others adopt first). Mitigation: Economic incentives (82x (90% CI: 21.4x-195x) cost reduction) create overwhelming financial motivation for early adoption. Regulatory harmonization across jurisdictions may extend to 10-20 years rather than the modeled 5-year timeline, though pilot programs in willing jurisdictions (UK MHRA, which accepted RECOVERY evidence) can establish proof-of-concept earlier.
Sensitivity: NPV calculations model adoption through the gradual ramp rather than immediate full adoption; slower adoption delays benefits without changing the steady state.
Cost Reduction Assumptions
Assumption: Embedded pragmatic trials reduce per-patient trial costs by 97.7% (90% CI: 92%-100%) compared to traditional randomized controlled trials (ADAPTABLE-based central estimate; the per-patient cost distribution above gives the range).
Empirical basis
Sensitivity: The R&D-only ROI (439 (90% CI: 321-600):1) uses the 97.7% (90% CI: 92%-100%) central estimate; the tornado chart in the Sensitivity Analysis section shows its range across the per-patient cost interval.
Political Feasibility Assumption
Assumption: The 1% Treaty achieves ratification by sufficient nations within a 3-5 year campaign timeline.
Justification: Historical treaty adoption timelines vary (Nuclear Non-Proliferation Treaty: 3 years; Paris Climate Agreement: 5 years). This analysis focuses on economic value conditional on implementation, not probability of political success.
Important caveat: This analysis does not model the probability distribution over political outcomes. The economic case (439 (90% CI: 321-600):1 to 84.8 million (90% CI: 39.6 million-194 million):1 ROI) holds if implemented, but political economy barriers to implementation are substantial and outside the scope of this cost-benefit analysis.
Expected Value Analysis Accounting for Political Risk
Standard economic practice: Cost-benefit analysis for interventions with implementation uncertainty requires expected value calculation:
\[E[ROI] = ROI_{conditional} \times P_{success}\]
The preceding analysis presents conditional benefits (returns IF implementation succeeds). Expected value analysis incorporates the probability of achieving political ratification and sustained commitment.
Political success probability: We model political success as uncertain (1% (95% CI: 0.1%-10%)) reflecting geopolitical uncertainty. The distribution below shows the assumed probability range:
This chart shows the assumed probability distribution for this parameter. The shaded region represents the 95% confidence interval where we expect the true value to fall.
Risk-adjusted expected ROI: 848 thousand (90% CI: 47.8 thousand-4.95 million):1
\[
\begin{gathered}
E[ROI_{max}] \\
= ROI_{max} \times P_{success} \\
= 84.8M \times 1\% \\
= 848{,}000
\end{gathered}
\]
where:
\[
\begin{gathered}
ROI_{max} \\
= \frac{Value_{max}}{Cost_{campaign}} \\
= \frac{\$84800T}{\$1B} \\
= 84.8M
\end{gathered}
\]
where:
\[
\begin{gathered}
Value_{max} \\
= DALYs_{max} \times Value_{QALY} \\
= 565B \times \$150K \\
= \$84800T
\end{gathered}
\]
where:
\[
\begin{gathered}
DALYs_{max} \\
= DALYs_{global,ann} \times Pct_{avoid,DALY} \times T_{accel,max} \\
= 2.88B \times 92.6\% \times 212 \\
= 565B
\end{gathered}
\]
where:
\[
T_{accel,max} = T_{accel} + T_{lag} = 204 + 8.2 = 212
\]
where:
\[
\begin{gathered}
T_{accel} \\
= T_{first,SQ} \times \left(1 - \frac{1}{k_{capacity}}\right) \\
= 222 \times \left(1 - \frac{1}{12.3}\right) \\
= 204
\end{gathered}
\]
where:
\[
\begin{gathered}
T_{first,SQ} \\
= T_{queue,SQ} \times 0.5 \\
= 443 \times 0.5 \\
= 222
\end{gathered}
\]
where:
\[
\begin{gathered}
T_{queue,SQ} \\
= \frac{N_{untreated}}{Treatments_{new,ann}} \\
= \frac{6{,}650}{15} \\
= 443
\end{gathered}
\]
where:
\[
\begin{gathered}
N_{untreated} \\
= N_{rare} \times 0.95 \\
= 7{,}000 \times 0.95 \\
= 6{,}650
\end{gathered}
\]
where:
\[
\begin{gathered}
k_{capacity} \\
= \frac{N_{fundable,ref}}{Slots_{curr}} \\
= \frac{23.4M}{1.9M} \\
= 12.3
\end{gathered}
\]
where:
\[
\begin{gathered}
N_{fundable,ref} \\
= \frac{Subsidies_{trial,ref}}{Cost_{pragmatic,pt}} \\
= \frac{\$21.8B}{\$929} \\
= 23.4M
\end{gathered}
\]
where:
\[
\begin{gathered}
Subsidies_{trial,ref} \\
= Funding_{trial,ref} - OPEX_{trial} \\
= \$21.8B - \$40M \\
= \$21.8B
\end{gathered}
\]
where:
\[
\begin{gathered}
OPEX_{trial} \\
= Cost_{platform} + Cost_{staff} + Cost_{infra} \\
+ Cost_{regulatory} + Cost_{community} \\
= \$15M + \$10M + \$8M + \$5M + \$2M \\
= \$40M
\end{gathered}
\]
where:
\[
\begin{gathered}
Cost_{campaign} \\
= Budget_{viral,base} + Budget_{lobby,treaty} \\
+ Budget_{reserve} \\
= \$250M + \$650M + \$100M \\
= \$1B
\end{gathered}
\]
The tornado chart below shows how expected ROI varies with political success probability - this is the primary driver of uncertainty:
The Monte Carlo distribution shows the full range of expected ROI outcomes when sampling political success probability from its uncertainty distribution:
Simulation Results Summary: Expected Treaty ROI (Risk-Adjusted)
| Baseline (deterministic) |
848 thousand:1 |
| Mean (expected value) |
1.01 million:1 |
| Median (50th percentile) |
175 thousand:1 |
| Standard Deviation |
2.1 million:1 |
| 90% Range (5th-95th percentile) |
[47.8 thousand:1, 4.95 million:1] |
The histogram shows 1,000 of the 10,000 Monte Carlo draws for Expected Treaty ROI (Risk-Adjusted); the summary statistics use all 10,000. The exceedance curve (right) shows the probability of the outcome exceeding any given value.
Comparison to traditional interventions (assuming 100% implementation probability):
Interpretation: The high conditional ROI (84.8 million (90% CI: 39.6 million-194 million):1) means that even modest implementation probabilities yield expected values competitive with the best health interventions that have near-certain implementation.
Note: The uncertainty analysis samples political probability from its full distribution (1% (95% CI: 0.1%-10%)). Actual probability depends on campaign execution, geopolitical conditions, and how many voters register publicly. The campaign strategy allocates $1 billion over 4 years specifically to maximize ratification probability.
Time Inconsistency and Commitment Credibility
Political economy challenge: Even if the treaty achieves initial ratification, sustained commitment over the 10 years analytical horizon faces time inconsistency problems. Political business cycles (2-6 year terms) create incentives to raid the pragmatic clinical trials budget for short-term priorities.
The Iron Triangle problem: Weapons manufacturers have concentrated interests with substantial lobbying capacity ($198 million (95% CI: $190 million-$210 million)25 annually), creating tight coordination between the war industry, congressional committees, and Pentagon bureaucracy. Health benefits, while larger in aggregate ($154 billion (90% CI: $137 billion-$172 billion) annually), are diffuse across millions of beneficiaries who lack equivalent lobbying infrastructure. This asymmetry (concentrated producer benefits vs. diffuse consumer benefits) creates political economy barriers to reallocation even when aggregate welfare gains are enormous.
Historical precedent: Why past peace dividends failed: The post-World War II “peace dividend” saw military spending fall from 41% of GDP (1945) to 7.2% (1948)160, with expectations of permanent reductions. However, the Cold War reversed this within 3 years. Military spending returned to 15% of GDP by 1953. Similar patterns occurred post-Vietnam (1970s) and post-Cold War (1990s): initial reductions followed by reversals within 5-10 years. The critical failure: savings weren’t bound to a substitute industry. Money reverted to general budgets, making re-militarization politically costless. The 1% Treaty solves this by contractually binding savings to health research infrastructure, creating a new constituency (patients, researchers, pharmaceutical companies) with incentives to defend the reallocation.
Treaty ratification ≠ sustained funding: The Paris Climate Agreement provides a cautionary example: 196 parties ratified, but many failed to meet funding commitments. As of 2024, developed countries have not met the $100B annual climate finance pledge despite treaty obligations. Treaty ratification creates moral commitment but weak enforcement mechanisms for sustained budgetary allocations.
Implication for expected value: The political success probabilities used in expected value analysis (1% (95% CI: 0.1%-10%)) implicitly incorporate time inconsistency risk. The expected value analysis partially addresses this through probability discounting, but time inconsistency (commitment erosion over time) represents an additional risk factor beyond initial political feasibility.
Potential commitment mechanisms (not modeled):
- Constitutional amendment (very high barrier, very high credibility)
- Independent funding agency with statutory protections
- Lock-box mechanism with supermajority requirement to redirect funds
- International monitoring and reputation costs
- Public transparency: all spending and trial outcomes publicly auditable
Note: The analysis acknowledges this limitation. Results should be interpreted as conditional on sustained implementation, with expected value analysis providing probability-adjusted estimates that partially account for political risk.
Technology Constancy Assumption
Assumption: Analysis does not incorporate potential advances in AI, automation, or biotechnology that could further accelerate research.
Justification: Conservative assumption. Emerging AI capabilities in drug discovery, automated synthesis, and computational biology could dramatically increase research productivity beyond modeled estimates.
Implication: Baseline estimates likely underestimate long-term benefits by excluding technology-driven accelerations.
Data Quality and Availability
All primary data sources are documented in References with confidence levels:
- High confidence: SIPRI military expenditure, WHO mortality statistics, ClinicalTrials.gov data
- Medium confidence: Peace dividend estimates, QALY valuations (wide range in literature)
- Conservative bounds: Where uncertainty exists, analysis uses conservative estimates favoring underestimation of benefits
For complete parameter documentation with confidence indicators and peer-review status, see Parameters and Calculations Reference.
Scenario Analysis: Complete Case
84.8 million (90% CI: 39.6 million-194 million):1 ROI
The conservative scenario counted only R&D efficiency gains. This section includes all quantifiable benefit categories.
Timeline Shift Value
The recurring benefits ($154 billion (90% CI: $137 billion-$172 billion)/year) are trivial compared to the timeline shift: $84.8 quadrillion (90% CI: $42.9 quadrillion-$172 quadrillion) from treatments arriving ~212 years (90% CI: 124 years-398 years) earlier on average.
Complete Case ROI
\[
\begin{gathered}
ROI_{max} \\
= \frac{Value_{max}}{Cost_{campaign}} \\
= \frac{\$84800T}{\$1B} \\
= 84.8M
\end{gathered}
\]
where:
\[
\begin{gathered}
Value_{max} \\
= DALYs_{max} \times Value_{QALY} \\
= 565B \times \$150K \\
= \$84800T
\end{gathered}
\]
where:
\[
\begin{gathered}
DALYs_{max} \\
= DALYs_{global,ann} \times Pct_{avoid,DALY} \times T_{accel,max} \\
= 2.88B \times 92.6\% \times 212 \\
= 565B
\end{gathered}
\]
where:
\[
T_{accel,max} = T_{accel} + T_{lag} = 204 + 8.2 = 212
\]
where:
\[
\begin{gathered}
T_{accel} \\
= T_{first,SQ} \times \left(1 - \frac{1}{k_{capacity}}\right) \\
= 222 \times \left(1 - \frac{1}{12.3}\right) \\
= 204
\end{gathered}
\]
where:
\[
\begin{gathered}
T_{first,SQ} \\
= T_{queue,SQ} \times 0.5 \\
= 443 \times 0.5 \\
= 222
\end{gathered}
\]
where:
\[
\begin{gathered}
T_{queue,SQ} \\
= \frac{N_{untreated}}{Treatments_{new,ann}} \\
= \frac{6{,}650}{15} \\
= 443
\end{gathered}
\]
where:
\[
\begin{gathered}
N_{untreated} \\
= N_{rare} \times 0.95 \\
= 7{,}000 \times 0.95 \\
= 6{,}650
\end{gathered}
\]
where:
\[
\begin{gathered}
k_{capacity} \\
= \frac{N_{fundable,ref}}{Slots_{curr}} \\
= \frac{23.4M}{1.9M} \\
= 12.3
\end{gathered}
\]
where:
\[
\begin{gathered}
N_{fundable,ref} \\
= \frac{Subsidies_{trial,ref}}{Cost_{pragmatic,pt}} \\
= \frac{\$21.8B}{\$929} \\
= 23.4M
\end{gathered}
\]
where:
\[
\begin{gathered}
Subsidies_{trial,ref} \\
= Funding_{trial,ref} - OPEX_{trial} \\
= \$21.8B - \$40M \\
= \$21.8B
\end{gathered}
\]
where:
\[
\begin{gathered}
OPEX_{trial} \\
= Cost_{platform} + Cost_{staff} + Cost_{infra} \\
+ Cost_{regulatory} + Cost_{community} \\
= \$15M + \$10M + \$8M + \$5M + \$2M \\
= \$40M
\end{gathered}
\]
where:
\[
\begin{gathered}
Cost_{campaign} \\
= Budget_{viral,base} + Budget_{lobby,treaty} \\
+ Budget_{reserve} \\
= \$250M + \$650M + \$100M \\
= \$1B
\end{gathered}
\]
Translation: Every $1 of the $1 billion campaign returns 84.8 million (90% CI: 39.6 million-194 million) in timeline-shift value (the $84.8 quadrillion (90% CI: $42.9 quadrillion-$172 quadrillion) above divided by the campaign cost). The recurring $154 billion (90% CI: $137 billion-$172 billion)/year in peace dividend and R&D savings is additional and is not in the ratio.
Sensitivity of complete ROI: The tornado chart below shows which parameters most affect the complete ROI estimate:
Critical distinction - the two benefit categories are different things:
Investment required: $1 billion (one-time implementation cost)
Efficacy lag uncertainty: The timeline shift depends on the efficacy lag parameter, which represents years of regulatory delay after safety is established. The distribution below shows the uncertainty range:
This chart shows the assumed probability distribution for this parameter. The shaded region represents the 95% confidence interval where we expect the true value to fall.
Individual-Level Economic Impact
The aggregate societal benefits ($154 billion (90% CI: $137 billion-$172 billion) annually) result from individual economic gains multiplied across billions of people. Understanding individual impact helps explain both the scale and the equity of the model.
Simulation Results Summary: Personal Lifetime Wealth (QALY-Based)
| Baseline (deterministic) |
$3 million |
| Mean (expected value) |
$2.98 million |
| Median (50th percentile) |
$1.87 million |
| Standard Deviation |
$3.41 million |
| 90% Range (5th-95th percentile) |
[$378,265, $9.35 million] |
The histogram shows 1,000 of the 10,000 Monte Carlo draws for Personal Lifetime Wealth (QALY-Based); the summary statistics use all 10,000. The exceedance curve (right) shows the probability of the outcome exceeding any given value.
Who Benefits and How
The 1% Treaty creates positive economic incentives across all major groups, eliminating traditional opposition to healthcare system reform. This alignment makes it politically feasible and sustainable.
Who Gets What:
- Military sector: Keeps 99% of current budget
- Pharmaceutical industry: Trial costs shift from expense to revenue (patients fund participation); research capacity increases 12.3x (90% CI: 4.92x-50.8x)
- Insurance companies: Net savings from reduced disease burden ($400 trillion (90% CI: $252 trillion-$544 trillion) current annual welfare cost)
- Healthcare providers: More treatment options; earlier access to effective therapies
- Patients: Access to clinical trials as healthcare and new treatments years or decades sooner
- Taxpayers: Net reduction in taxes and healthcare costs through improved R&D efficiency
Implementation Strategy
The economic benefits outlined above demonstrate why the 1% Treaty pays for itself many times over. Implementation requires enough voters on record to make refusal politically costly:
Step 1: Global Mandate (The Philanthropic Catalyst)
Goal: Survey 3.5% of the global population (280 million of people (90% CI: 88 million of people-628 million of people)).
Why 3.5%?: Historical analysis (Chenoweth et al.) shows that no government has withstood nonviolent civil challenge from 3.5% of its population. This public mandate would increase political pressure for treaty ratification.
Funding: This educational and scientific polling initiative is the primary entry point for philanthropic partners, validating global demand before the main campaign begins.
Step 2: Capitalization
Front-loading the cost of political change requires capital, and the arbitrage gap that attracts it is large: adoption costs on the order of $1 billion against sovereign flows of $27.2 billion/year. Which instrument closes that gap is a separate design question with several answers, costed in Adoption Pathways and Cost Sensitivity.
Step 3: Implement the Legislative Strategy
Deploy the proceeds to translate public support into legislative action.
Step 4: Build the Infrastructure
The 1% shift funds globally scaled pragmatic trial infrastructure modeled on RECOVERY’s approach. Thousands of neglected treatments finally get tested. Effective ones scale instantly.
Technical requirements: Building this requires EHR interoperability, data standards, automated analysis pipelines, and regulatory framework updates. RECOVERY demonstrated the core model works; scaling requires infrastructure investment but no fundamental technical breakthroughs. The challenge is deployment and adoption, not invention.
Step 5: The Statutory Administration Utility
The Treaty mandates that the Fund be managed by an independent administrator to ensure operational efficiency and accountability.
The mechanism:
- 12.3x (90% CI: 4.92x-50.8x) more trial capacity to test treatments simultaneously
- Disease categories collapse as effective treatments scale
- Healthspan overtakes pathology
The utility structure: The treaty hard-codes the non-medical allocation on all inflows. 10% goes to returns on the capital that financed adoption ($2.72 billion/year). 10% funds the political defense layer ($2.72 billion/year) through legally separate entities. The administrator handles treasury plumbing and scheduled payments; it does not receive the non-medical allocation as a management fee. The remaining 80% flows directly to clinical trials and research.
Governance constraints (addressing self-dealing concerns):
- Independent board: Majority of seats held by treaty signatory representatives, not the administrator
- Capped compensation: Administrator salaries benchmarked to comparable multilateral institutions (WHO, World Bank)
- Annual third-party audit: Published financials with signatory oversight committee review
- Sunset provision: Fee percentage subject to 10-year renegotiation by signatory majority
- Operational scope: The non-medical allocation funds only financing returns, the political defense layer, compliance monitoring, and fund administration (not administrator profit)
Holders of the treaty-defined revenue share receive perpetual distributions, creating a permanent constituency to defend the Treaty against political cuts. The design does not rely on altruism. It relies on the non-medical allocation funding a political defense layer whose only job is to protect the Treaty’s existence.
Implementation complexity: Coordinating global treaty adoption, building technical infrastructure, and integrating with existing health systems presents significant logistical challenges. However, these are coordination problems with aligned incentives, not conflicts of interest. Similar to how nations coordinated on the Montreal Protocol (ozone layer) or the International Space Station despite complexity, the economic case makes cooperation rational even for self-interested actors.
For comprehensive implementation details, see Adoption Pathways and Cost Sensitivity and the pathway specifications cited there.
Implementation Budget Breakdown
The $1 billion implementation cost (used as denominator in complete case 84.8 million (90% CI: 39.6 million-194 million):1 ROI) allocates funds across three strategic categories:
| Global Referendum |
$250 million |
Global direct democracy campaign (280 million of people (90% CI: 88 million of people-628 million of people) votes). Creates a public mandate and a political cost for non-adoption. Not legally binding. |
| Legislative Advocacy |
$650 million |
Legislative outreach (US/EU/G20), policy education, military industry conversion, legal/compliance |
| Reserve Fund |
$100 million |
Post-victory transition, treaty implementation support, contingency buffer |
| Total Implementation Cost |
$1 billion |
4-year implementation timeline |
\[
\begin{gathered}
Cost_{campaign} \\
= Budget_{viral,base} + Budget_{lobby,treaty} \\
+ Budget_{reserve} \\
= \$250M + \$650M + \$100M \\
= \$1B
\end{gathered}
\]
This budget is designed for a 3-5 year campaign to achieve treaty ratification by major powers, representing less than 4% of the first year’s conservative benefits ($154 billion (90% CI: $137 billion-$172 billion)). The referendum component isn’t a “magic wand”; it’s a mechanism to generate the political capital required to force the treaty onto the agenda of sovereign nations.
This economic analysis focuses on the return on investment once the framework is operational, demonstrating that the intervention generates 439 (90% CI: 321-600):1 to 84.8 million (90% CI: 39.6 million-194 million):1 returns regardless of the specific path to adoption.
Detailed Technical References
For the rigorous analysis:
Risk Analysis and Mitigation
This section addresses common objections and potential failure modes, along with specific mitigation strategies.
The “But Politicians Won’t Do It” Problem
What could go wrong: Politicians take too long to redirect 1% of military spending to pragmatic clinical trials because nobody has paid them to do the arithmetic yet.
Counterargument:
Political influence has a measured price and a measured return. Military lobbyists got $1,813 back for every $1 the top five firms spent on political influence across the twenty-year Afghan War161. Nothing about that machinery is reserved for weapons; it responds to whoever funds it, which is why the adoption problem is a financing problem rather than a persuasion problem. The pathways in Adoption Pathways and Cost Sensitivity are different ways of funding it.
Treaty-defined revenue shares also create a compliance interest that outlives the campaign: if the treaty is not respected, the income stream stops, so the holders of that stream defend it.
Historical precedent: After WW2, military spending was cut by 87.6%124, contributing to substantial economic growth162. The proposed 1% reduction is significantly more modest.
Safety Concerns
Objection: Pragmatic trials with lower costs may compromise safety by missing dangerous side effects.
Response: The empirical evidence indicates the opposite. The proposed system provides superior safety monitoring compared to traditional trials across multiple dimensions: sample size, population diversity, monitoring duration, publication completeness, and adverse event detection speed.
Proposed system safety advantages:
Mandatory universal data collection: The system automatically collects and publishes outcome data on all treatments and all health outcomes using existing EHR infrastructure. This is not currently done systematically for approved drugs.
Continuous population-scale monitoring: Pragmatic trials with 10,000-100,000+ participants monitored continuously through EHR integration detect safety problems faster and more reliably than small, time-limited traditional trials. The RECOVERY trial identified an effective treatment (dexamethasone) and an ineffective one (hydroxychloroquine) within about 100 days of launch, and went on to enroll 47,000 patients.
Preserved Phase I safety testing: The proposal retains rigorous Phase I safety testing (~2.3 years). What changes is eliminating the 8.2 years (90% CI: 4.84 years-11.5 years) efficacy delay after safety is verified. Phase I safety assessment remains mandatory.
Immediate mass notification: When safety signals are detected, all patients currently taking the drug receive automated alerts through patient portals, enabling immediate clinical review and discontinuation if warranted. Current voluntary reporting systems lack this capability.
Comparative safety surveillance:
| Sample size |
300-3,000 patients |
10,000-100,000+ patients |
| Patient selection |
86.1% excluded (comorbidities, age, medications) |
All volunteers included (real-world populations) |
| Monitoring duration |
3-12 months (then stops) |
Continuous through EHR integration (indefinite) |
| Publication rate |
~50% unpublished140; positive results 3× more likely published |
100% automatically published (automated data aggregation) |
| Subpopulation safety |
Excludes elderly, children, pregnant patients |
Tests all populations, detects subpopulation-specific risks |
| Long-term effects |
Rarely captured (<1 year observation) |
Continuous multi-year tracking via EHR linkage |
| Adverse event detection |
Voluntary physician reporting (1-10% capture rate) |
Automated statistical surveillance (100% capture of recorded events) |
| Mass notification |
Manual, slow, incomplete |
Automated, immediate, comprehensive |
| Comparative effectiveness |
Single treatment vs. placebo (or one comparator) |
Multiple treatments randomized simultaneously; enables ranking |
| Population stratification |
Not possible (86.1% excluded; narrow population) |
Full subgroup analysis by demographics, genetics, comorbidities |
Quantified mortality from efficacy delay: The 8.2 years (90% CI: 4.84 years-11.5 years) delay between Phase I safety verification and final approval has resulted in an estimated 416 million deaths (90% CI: 244 million deaths-587 million deaths) from 1962-2024 by delaying patient access to beneficial treatments that had already passed safety testing. This figure represents the cumulative mortality from requiring patients to wait ~8 years for efficacy confirmation after treatments are confirmed non-toxic, when those patients could have voluntarily participated in efficacy trials immediately following Phase I completion.
\[
\begin{gathered}
Deaths_{lag} \\
= T_{lag} \times Deaths_{disease,daily} \times 338 \\
= 8.2 \times 150{,}000 \times 338 \\
= 416M
\end{gathered}
\]
Cost reduction does not imply quality reduction: The 82x (90% CI: 21.4x-195x) cost reduction achieved by the RECOVERY trial came from eliminating duplicative infrastructure (using existing hospitals instead of building dedicated trial sites, using existing EHR data instead of parallel data collection systems), not from reducing sample sizes, shortening observation periods, or relaxing safety standards. Lower cost reflects infrastructure efficiency, not reduced scientific rigor.
For detailed mortality analysis, see Regulatory Mortality Analysis.
Patient Agency and Autonomy
The fund puts patients in control through trial participation, not committee votes.
Current system: roughly 200 NIH decision-makers163 set research priorities for 8 billion of people (95% CI: 7.8 billion of people-8.2 billion of people) people
New system: Patients choose which trials to join. Trials that attract patients get funded. Trials that don’t, die.
Patient subsidies follow them to whichever trial they join. Researchers compete to design trials that patients actually want to participate in.
All transactions publicly recorded. All spending transparent. All decisions auditable.
The system operates through distributed infrastructure:
- Open-source protocols (anyone can verify how it works)
- Distributed validation (no single point of failure)
- Works with existing regulators (additive layer, not replacement)
Accountability measures
- Annual third-party audits of 1% Treaty Fund and system operations
- Public reporting of all spending and outcomes
- Milestone-based funding (money releases when targets hit)
Limitations and Uncertainties
This analysis acknowledges several important limitations and sources of uncertainty. Modeling a policy change this large involves assumptions that could be wrong in interesting ways.
Adoption Timeline Uncertainty
The base case assumes gradual adoption over 5 years to full implementation. Actual adoption may be faster or slower depending on:
- Regulatory harmonization: International coordination requirements may extend implementation timelines
- Technical infrastructure readiness: EHR interoperability, data standardization, and privacy compliance vary significantly across jurisdictions
- Industry cooperation: Pharmaceutical companies, regulators, and healthcare providers will resist or accelerate adoption based on whether they profit from it
Sensitivity analysis addresses this: Slower adoption lowers the NPV but not the sign; the R&D-only ROI is 439 (90% CI: 321-600) across its interval.
Pragmatic Trial Internal Validity and Selection Bias
Decentralized trials with broad eligibility criteria face potential selection bias concerns. Traditional randomized controlled trials use restrictive eligibility precisely to control confounding and establish internal validity.
Trade-off between internal and external validity: Patsopoulos (2011)164 documents that pragmatic trials often find 15-25% smaller effect sizes than explanatory trials but offer superior external validity (generalizability to real-world populations).
Mitigation strategies
- Randomization preserved: The global pragmatic trial system maintains random treatment assignment (the core causal identification strategy)
- Large sample sizes: Decentralized recruitment enables 10-100× larger trials, improving statistical power and subgroup analysis
- Covariate adjustment: Electronic health record data enables controlling for confounders ex-post using propensity score matching and instrumental variables
- Replication at scale: Lower costs enable rapid replication across diverse populations, testing robustness
Empirical evidence, observational studies produce valid results: A meta-analysis in the New England Journal of Medicine165 compared effect sizes from high-quality observational studies to randomized controlled trials across multiple interventions. The findings demonstrate that well-designed observational studies produce results statistically indistinguishable from expensive RCTs.
These meta-analytic findings support the validity of pragmatic trial designs used in this system. Modern statistical methods, large sample sizes, and proper covariate adjustment enable observational and quasi-experimental designs to achieve causal inference comparable to traditional RCTs at a fraction of the cost.
Why pragmatic trial data is more valuable than RCT data for clinical decisions:
Traditional RCTs answer: “Is treatment A better than placebo?” Pragmatic trials answer: “How do ALL available treatments rank for patients like mine?”
This distinction is crucial for clinical decision-making. A physician facing a patient with rheumatoid arthritis has 15+ approved treatment options. Traditional evidence provides isolated A-vs-placebo studies; the physician cannot determine whether methotrexate or adalimumab is superior for their specific patient. Pragmatic trials, by randomly assigning patients across all options simultaneously and including diverse populations, generate the comparative rankings clinicians actually need.
Furthermore, RCTs’ restrictive eligibility criteria (excluding patients with comorbidities, elderly patients, patients on multiple medications) mean their results don’t generalize to real patients. A 73-year-old with diabetes and hypertension was excluded from the original trials; the physician is guessing how results might apply. Pragmatic trials include these patients, enabling stratified effectiveness rankings by actual patient characteristics.
Publication bias: Traditional trials face severe publication bias: only 37% of negative results are published compared to 94% of positive results140, leading to overestimation of treatment effectiveness and ~$100 billion annually wasted on repeating failed experiments166. The trial protocol addresses this by design: all trials are registered in the public database, all results (positive and negative) are automatically published through the transparent data infrastructure, and the open data architecture ensures no selective reporting. Unlike traditional systems where researchers choose what to publish, mandatory publication of all registered trials eliminates publication bias as a concern.
Conclusion: Internal validity concerns are acknowledged, but the combination of randomization, large samples, and replication capacity provides adequate causal inference even with broader eligibility criteria.
QALY Calculation Uncertainties
The 565 billion DALYs (90% CI: 309 billion DALYs-1.08 trillion DALYs) estimate aggregates benefits from the average ~212 years (90% CI: 124 years-398 years) timeline shift across three benefit streams with varying levels of empirical support.
Addressing the “Quadrillion Dollar” Assumption: The total economic value of $84.8 quadrillion (90% CI: $42.9 quadrillion-$172 quadrillion) derives from the average ~212 years (90% CI: 124 years-398 years) timeline shift in disease eradication. The number sounds absurd until you build it from its components.
Start with the annual cost of disease. The WHO reports 2.88 billion DALYs/year (90% CI: 2.63 billion DALYs/year-3.12 billion DALYs/year) lost globally. 92.6% (95% CI: 50%-98%) are eventually avoidable with sufficient biomedical research. At the standard $150,000 (90% CI: $100,384-$198,679)/QALY (OECD, EPA, WHO, NICE), each year of delay costs $400 trillion (90% CI: $252 trillion-$544 trillion).
Now multiply by the timeline shift (~212 years earlier that treatments arrive on average):
\[
\begin{gathered}
Value_{max} \\
= DALYs_{max} \times Value_{QALY} \\
= 565B \times \$150K \\
= \$84800T
\end{gathered}
\]
where:
\[
\begin{gathered}
DALYs_{max} \\
= DALYs_{global,ann} \times Pct_{avoid,DALY} \times T_{accel,max} \\
= 2.88B \times 92.6\% \times 212 \\
= 565B
\end{gathered}
\]
where:
\[
T_{accel,max} = T_{accel} + T_{lag} = 204 + 8.2 = 212
\]
where:
\[
\begin{gathered}
T_{accel} \\
= T_{first,SQ} \times \left(1 - \frac{1}{k_{capacity}}\right) \\
= 222 \times \left(1 - \frac{1}{12.3}\right) \\
= 204
\end{gathered}
\]
where:
\[
\begin{gathered}
T_{first,SQ} \\
= T_{queue,SQ} \times 0.5 \\
= 443 \times 0.5 \\
= 222
\end{gathered}
\]
where:
\[
\begin{gathered}
T_{queue,SQ} \\
= \frac{N_{untreated}}{Treatments_{new,ann}} \\
= \frac{6{,}650}{15} \\
= 443
\end{gathered}
\]
where:
\[
\begin{gathered}
N_{untreated} \\
= N_{rare} \times 0.95 \\
= 7{,}000 \times 0.95 \\
= 6{,}650
\end{gathered}
\]
where:
\[
\begin{gathered}
k_{capacity} \\
= \frac{N_{fundable,ref}}{Slots_{curr}} \\
= \frac{23.4M}{1.9M} \\
= 12.3
\end{gathered}
\]
where:
\[
\begin{gathered}
N_{fundable,ref} \\
= \frac{Subsidies_{trial,ref}}{Cost_{pragmatic,pt}} \\
= \frac{\$21.8B}{\$929} \\
= 23.4M
\end{gathered}
\]
where:
\[
\begin{gathered}
Subsidies_{trial,ref} \\
= Funding_{trial,ref} - OPEX_{trial} \\
= \$21.8B - \$40M \\
= \$21.8B
\end{gathered}
\]
where:
\[
\begin{gathered}
OPEX_{trial} \\
= Cost_{platform} + Cost_{staff} + Cost_{infra} \\
+ Cost_{regulatory} + Cost_{community} \\
= \$15M + \$10M + \$8M + \$5M + \$2M \\
= \$40M
\end{gathered}
\]
That is where the quadrillion comes from. Two WHO data points, one standard QALY price, and a timeline shift.
The annual figure ($400 trillion (90% CI: $252 trillion-$544 trillion)) is larger than global GDP ($115 trillion). This is consistent with health economics methodology because DALY valuation captures welfare losses that GDP does not measure: pain, disability, premature death, and lost potential. The $150,000 (90% CI: $100,384-$198,679)/QALY figure is the standard used by OECD, EPA, WHO, and NICE for policy evaluation. The 2.88 billion DALYs/year (90% CI: 2.63 billion DALYs/year-3.12 billion DALYs/year) figure comes directly from WHO Global Burden of Disease data. Neither input is a model assumption.
The only debatable input is whether the timeline shift is really ~212 years.
How the timeline shift is calculated:
Discovery acceleration (~204 years (90% CI: 116 years-390 years) on average): With 12.3x (90% CI: 4.92x-50.8x) trial capacity, treatments are discovered ~204 years (90% CI: 116 years-390 years) earlier on average. This is based on therapeutic space exploration: 6,650 diseases (90% CI: 5,700 diseases-8,232 diseases) lack treatment, with ~9.5 million combinations (90% CI: 6.68 million combinations-12.8 million combinations) drug-disease combinations untested. At current exploration rate (~15 diseases/year getting first treatments), systematically testing this space would take 443 years (90% CI: 255 years-841 years). With 12.3x (90% CI: 4.92x-50.8x) capacity, exploration completes in ~36 years (90% CI: 8.15 years-106 years). Average disease receives treatment halfway through exploration period, yielding ~204 years (90% CI: 116 years-390 years) acceleration.
Efficacy lag elimination (~8.2 years (90% CI: 4.84 years-11.5 years)): Once a treatment is discovered, it reaches patients immediately instead of waiting ~8.2 years (90% CI: 4.84 years-11.5 years) for post-safety regulatory approval.
“Won’t AI and breakthroughs shrink the status quo timeline anyway?” No. The bottleneck is not candidate discovery; it is regulatory throughput. The current system has 1.9 million patients/year (95% CI: 1.5 million patients/year-2.3 million patients/year) clinical trial slots. AI drug discovery, breakthrough technologies, and compounding biological knowledge produce more candidates, but candidates still must pass through the same constrained clinical trial pipeline to reach patients. More candidates competing for the same 1.9 million patients/year (95% CI: 1.5 million patients/year-2.3 million patients/year) slots makes the queue longer, not shorter. The 15 diseases/year (95% CI: 8 diseases/year-30 diseases/year) output rate measures regulatory throughput, not discovery speed. This intervention specifically removes that bottleneck (12.3x (90% CI: 4.92x-50.8x) capacity from pragmatic trials at $929 (95% CI: $97-$3,000)/patient).
Why this estimate is still conservative:
- It assumes a fixed far-future timeline: Even if full biological control takes 1,000 years, shifting that timeline forward by ~212 years (90% CI: 124 years-398 years) on average saves that many years’ worth of future lives. Given the trajectory of biotechnology, “eventual” control over biology is a matter of when, not if.
- It works with partial success: Even if we assume 90% of diseases remain biologically incurable (a massive discount), accelerating treatments for just the “easiest” 10% of the burden (e.g., cardiovascular disease, metabolic disorders) still yields enormous value. The ROI is positive even at 1/100th of the projected success rate.
- It uses average acceleration: Some diseases with existing-but-untested treatments would be discovered much sooner (approaching 0 years wait); diseases requiring novel mechanisms would take longer. The 204 years (90% CI: 116 years-390 years) figure is the average across the distribution.
Data Limitations
Military Spending Data
Global military expenditure data ($2.72 trillion, SIPRI 2024) is well-documented but:
- Off-budget spending: Some military expenditures may be classified or categorized elsewhere
- Exchange rate fluctuations: Multi-year projections require currency assumptions
- Conflict zones: Military spending in active conflict regions may be less fungible for redirection
Clinical Trial Market Sizing
The $60 billion (95% CI: $50 billion-$75 billion)52 global clinical trials market estimate (all sectors; government share: $4.5 billion (95% CI: $3 billion-$6 billion)56) derives from industry reports, which:
- Industry variation: Methodologies vary across market research firms
- Private vs. public trials: Some trial spending may be unreported or proprietary
- Non-pharmaceutical trials: Medical device and digital health trials may have different cost structures
QALY Valuation Thresholds
Standard willingness-to-pay thresholds ($50,000-$150,000 (90% CI: $100,384-$198,679)106 per QALY) vary by jurisdiction:
- Geographic variation: WHO recommends 1-3× GDP per capita; high-income countries use higher thresholds
- Ethical considerations: Monetary QALY valuations raise equity concerns
- Discount rates: Future health benefits discounted at 3% may undervalue long-term gains
Generalizability Constraints
Political Feasibility
This analysis models economic returns conditional on treaty ratification. Political feasibility depends on:
- Geopolitical stability: International cooperation requirements may face challenges during periods of global tension
- Domestic politics: Military budget reductions face constituency resistance in military-dependent regions
- Lobbying influence: Military industry opposition may impede adoption
Risk assessment: The 1% reduction is intentionally modest to minimize political resistance. Historical precedents (military-to-civilian conversions post-Cold War) demonstrate feasibility.
Institutional Capacity
Implementation requires substantial institutional development:
- Regulatory expertise: The framework requires experienced personnel (FDA, EMA, other regulators) to enable integration with existing regulatory frameworks
- Technical infrastructure: Data systems, AI/ML capabilities, cybersecurity at global scale
- Legal frameworks: International treaties, data privacy compliance, intellectual property harmonization
Mitigation: Phased implementation allows infrastructure to grow concurrent with scale-up.
Healthcare System Integration
Benefits assume integration with existing healthcare infrastructure:
- EHR interoperability: U.S. and other jurisdictions still face significant interoperability challenges
- Wearable adoption: Real-world data collection requires widespread wearable/digital health adoption
- Provider participation: Clinician buy-in necessary for trial recruitment and data quality
Uncertainty Quantification
Primary Risk Factors
The following table summarizes key risk factors and their mitigation strategies:
| Political Risk |
VERY HIGH |
Treaty ratification dependent on international coordination |
Modest 1% reduction; precedent from military-industrial lobbying ROI (1,813:1, top five firms over 20 years) |
| Execution Risk |
HIGH |
Complex global legal/technical coordination required |
Phased implementation; use existing regulatory expertise |
| Regulatory Risk |
MEDIUM-HIGH |
Harmonization across jurisdictions varies |
Pilot programs in willing jurisdictions first |
| Market Risk |
VERY LOW |
$2.72 trillion61 military spending already allocated |
Redirection rather than new appropriation |
| Technical Risk |
MEDIUM |
Data interoperability, AI/ML accuracy |
Build on proven platforms (DCT platforms collectively raising $1B+ in VC funding) |
General Equilibrium Effects
This analysis employs partial equilibrium methodology, holding prices and market structures constant while evaluating the intervention’s direct effects. General equilibrium analysis would account for market adjustments to the $27.2 billion annual reallocation from military to pragmatic clinical trials spending.
Unmodeled general equilibrium effects include:
Data infrastructure scaling costs: Decentralized trial infrastructure uses automated software (federated queries, not centralized databases), scaling through technology rather than labor. Unlike traditional research that faces researcher supply constraints, the framework uses existing EHR systems and adds coordination protocols. Marginal scaling costs are low relative to traditional models.
Clinical trial market price effects: Increasing trial demand by 12.3x (90% CI: 4.92x-50.8x) could affect equilibrium prices for clinical research services. However, the pragmatic trial approach reduces per-trial costs (82x (90% CI: 21.4x-195x) cheaper via automation), suggesting supply constraints may not bind. Traditional trials cost $41,000 (95% CI: $20,000-$120,000); decentralized trials target $929 (95% CI: $97-$3,000) by eliminating overhead, not by increasing demand for scarce inputs.
Crowding out effects: Do billions in new pragmatic clinical trials displace existing research funding, or does it add incrementally? Conservative assumption: fully additive. If partially substitutive (e.g., governments reduce NIH funding in response), net research increase would be lower than modeled.
Quality versus quantity trade-off: 12.3x (90% CI: 4.92x-50.8x) more trials may not yield proportional breakthroughs if resources spread thin or trial quality declines. The analysis assumes quality maintenance through peer review and replication; actual quality effects remain uncertain.
Conservative treatment in base case: The analysis excludes general equilibrium effects from benefit calculations, providing a lower bound estimate.
Methodological limitation acknowledged: Full general equilibrium modeling (computable general equilibrium models with labor markets, international trade, and technology diffusion) would require substantial additional complexity beyond this analysis scope. The partial equilibrium approach follows standard cost-benefit analysis methodology for policy interventions.
Conditional Benefits Interpretation
The ROI estimates (439 (90% CI: 321-600) conservative, 84.8 million (90% CI: 39.6 million-194 million) complete) are conditional on successful implementation, they represent returns if the system operates as designed. Expected value analysis (see “Expected Value Analysis Accounting for Political Risk” section) incorporates probability-weighted scenarios. This section examines operational and technical failure modes that could occur even after political success, complementing the political barriers treated in the Expected Value section. Pilot implementations should monitor false positive rates, adverse event detection sensitivity, regulatory acceptance rates, and industry adoption velocity to enable early course corrections.
Policy Implications
This analysis has direct implications for resource allocation decisions across multiple policy domains:
National Health Budgets
Traditional health budgets face impossible trade-offs: every dollar spent on cancer treatment is a dollar not spent on heart disease prevention. This intervention eliminates that constraint by redirecting funds from outside the health sector.
The opportunity: Health ministries can achieve 12.3x (90% CI: 4.92x-50.8x) more clinical research without reducing current health spending or raising taxes. The funding comes from military budgets, not health budgets.
Practical application: A nation spending $2.72 trillion on military could redirect 1% ($27.2 billion) to fund pragmatic trials for its entire population while maintaining virtually all of its military capacity. The resulting health gains (416 million lives saved globally, proportional by population) far exceed any marginal security value of that 1%.
International Development Priorities
Development agencies face a fundamental problem: the most cost-effective interventions (bed nets at $89 (95% CI: $78-$100)/DALY, vaccines) can only scale linearly. Doubling impact requires doubling spending.
The difference: This intervention scales exponentially because it changes which trials get funded. It doesn’t compete with existing development programs; it accelerates treatment discovery for all diseases affecting developing nations.
Practical application:
- Current approach: USAID spends billions on malaria bed nets (excellent intervention, $89 (95% CI: $78-$100)/DALY)
- Proposed addition: Support 1% Treaty adoption, which delivers $0.00177 (90% CI: $0.000809-$0.00354)/DALY (50.3kx (90% CI: 25.0kx-111.1kx) better) while also funding research to eradicate malaria
- Result: Keep funding bed nets (they work!) AND accelerate development of malaria vaccines and treatments through massively expanded trial capacity
Military Budget Allocation
Military planners optimize for national security. This analysis demonstrates that 1% of military spending provides near-zero marginal security value while generating enormous economic returns when redirected.
The economic case: The fiscal multiplier (GDP generated per dollar spent) for military spending is 0.6x (95% CI: 0.4x-0.9x)35. Healthcare investment generates 4.3x (95% CI: 3x-6x)33, over 7.17x (90% CI: 4.67x-11.1x) higher. Beyond fiscal multipliers, medical research generates extraordinary health returns: economists Murphy and Topel found that longevity gains from medical advances are worth 50-100× the research investment167. Pragmatic trials, which produce 44.1x (90% CI: 12.8x-210x) more research output per dollar, multiply these already-massive returns.
Strategic perspective: A nation’s long-term security depends more on economic strength and healthy populations than on marginal weapons systems. Redirecting 1% from the $2.72 trillion global military budget doesn’t compromise military (99% remains) but generates $154 billion (90% CI: $137 billion-$172 billion) in annual economic benefits.
Precedent: The U.S. spends more on military than the next 10 countries combined. A 1% reduction would still leave U.S. military spending higher than any potential adversary while funding 12.3x (90% CI: 4.92x-50.8x) more medical research globally.
Global Health Funding Mechanisms
Current global health funding relies on unpredictable philanthropic donations and limited government aid budgets. Total official development assistance for health: ~$40B/year. This intervention creates a $27.2 billion/year permanent funding stream.
Why this works: This is not charity; it’s profitable. A treaty-defined revenue share backed by the peace dividend can be sold to private capital, making health funding financially attractive rather than dependent on altruism. Which instrument carries that share is a design choice with several costed options (Adoption Pathways and Cost Sensitivity).
Contrast with current system: WHO’s annual budget (~$6B) depends on voluntary contributions that can be cut at any time. The 1% Treaty creates a $27.2 billion/year legally-binding funding stream that grows automatically with military budgets.
Treaty Adoption: Political Will and Diplomatic Strategy
International treaty adoption is fundamentally a political and diplomatic process, not a technical implementation timeline. The 1% Treaty’s viability depends on simultaneous multilateral commitment: no nation reduces military spending unilaterally, creating security vulnerabilities or free-rider problems. All signatories reduce together.
Why Simultaneous Commitment Works: Escaping the Prisoner’s Dilemma
Unilateral military reduction is politically infeasible. This is a classic Prisoner’s Dilemma:
- If I reduce alone: Security vulnerability while others maintain full capacity (worst outcome)
- If I don’t reduce but others do: Free-ride on reduced conflict risk (tempting but unsustainable)
- If nobody reduces: Arms race continues, all players worse off (current equilibrium)
- If all reduce together: Maintain relative balance, redirect savings to health (optimal Nash equilibrium)
Simultaneous binding commitment solves the coordination problem: All signatories reduce 1% together, maintaining relative military balance while collectively redirecting $27.2 billion/year to health research that benefits all participants. The treaty converts a Prisoner’s Dilemma (where rational self-interest produces suboptimal outcomes) into a coordination game with enforceable commitments.
Historical Treaty Precedents
Successful international treaties achieved rapid adoption through diplomatic coalition-building, not phased pilots:
- Ottawa Landmine Ban Treaty (1997): Diplomatic push → international negotiation → 122 nations signed in 2 years
- Paris Climate Agreement (2015): Built on existing framework, achieved 195 signatories through coordinated diplomatic effort
- Chemical Weapons Convention (1993): International negotiation process, 193 state parties
Common pattern: Political will + coalition of willing nations + diplomatic negotiation → treaty adoption
The 1% Treaty follows this model, with the advantage that it offers immediate economic returns (439 (90% CI: 321-600):1 ROI minimum) rather than requiring sacrifice.
Conclusion
Redirecting 1% of global military spending to pragmatic clinical trials delivers 439 (90% CI: 321-600):1 to 84.8 million (90% CI: 39.6 million-194 million):1 ROI using standard health economics methodology (NPV, QALYs, ICER). The intervention qualifies as cost-saving and requires no new taxes, only reallocation of existing budgets to higher-ROI activities.
1.
NIH Common Fund. NIH pragmatic trials: Minimal funding despite 30x cost advantage.
NIH Common Fund: HCS Research Collaboratory https://commonfund.nih.gov/hcscollaboratory (2025)
The NIH Pragmatic Trials Collaboratory funds trials at $500K for planning phase, $1M/year for implementation-a tiny fraction of NIH’s budget. The ADAPTABLE trial cost $14 million for 15,076 patients (= $929/patient) versus $420 million for a similar traditional RCT (30x cheaper), yet pragmatic trials remain severely underfunded. PCORnet infrastructure enables real-world trials embedded in healthcare systems, but receives minimal support compared to basic research funding. Additional sources: https://commonfund.nih.gov/hcscollaboratory | https://pcornet.org/wp-content/uploads/2025/08/ADAPTABLE_Lay_Summary_21JUL2025.pdf | https://www.ncbi.nlm.nih.gov/pmc/articles/PMC5604499/
.
4.
Cato Institute. Chance of dying from terrorism statistic.
Cato Institute: Terrorism and Immigration Risk Analysis https://www.cato.org/policy-analysis/terrorism-immigration-risk-analysis Chance of American dying in foreign-born terrorist attack: 1 in 3.6 million per year (1975-2015) Including 9/11 deaths; annual murder rate is 253x higher than terrorism death rate More likely to die from lightning strike than foreign terrorism Note: Comprehensive 41-year study shows terrorism risk is extremely low compared to everyday dangers Additional sources: https://www.cato.org/policy-analysis/terrorism-immigration-risk-analysis | https://www.nbcnews.com/news/us-news/you-re-more-likely-die-choking-be-killed-foreign-terrorists-n715141
.
5.
NIH. Antidepressant clinical trial exclusion rates.
Zimmerman et al. https://pubmed.ncbi.nlm.nih.gov/26276679/ (2015)
Mean exclusion rate: 86.1% across 158 antidepressant efficacy trials (range: 44.4% to 99.8%) More than 82% of real-world depression patients would be ineligible for antidepressant registration trials Exclusion rates increased over time: 91.4% (2010-2014) vs. 83.8% (1995-2009) Most common exclusions: comorbid psychiatric disorders, age restrictions, insufficient depression severity, medical conditions Emergency psychiatry patients: only 3.3% eligible (96.7% excluded) when applying 9 common exclusion criteria Only a minority of depressed patients seen in clinical practice are likely to be eligible for most AETs Note: Generalizability of antidepressant trials has decreased over time, with increasingly stringent exclusion criteria eliminating patients who would actually use the drugs in clinical practice Additional sources: https://pubmed.ncbi.nlm.nih.gov/26276679/ | https://pubmed.ncbi.nlm.nih.gov/26164052/ | https://www.wolterskluwer.com/en/news/antidepressant-trials-exclude-most-real-world-patients-with-depression
.
6.
CNBC. Warren buffett’s career average investment return.
CNBC https://www.cnbc.com/2025/05/05/warren-buffetts-return-tally-after-60-years-5502284percent.html (2025)
Berkshire’s compounded annual return from 1965 through 2024 was 19.9%, nearly double the 10.4% recorded by the S&P 500. Berkshire shares skyrocketed 5,502,284% compared to the S&P 500’s 39,054% rise during that period. Additional sources: https://www.cnbc.com/2025/05/05/warren-buffetts-return-tally-after-60-years-5502284percent.html | https://www.slickcharts.com/berkshire-hathaway/returns
.
7.
GiveWell. GiveWell cost per life saved for top charities (2024).
GiveWell: Top Charities https://www.givewell.org/charities/top-charities General range: $3,000-$5,500 per life saved (GiveWell top charities) Helen Keller International (Vitamin A): $3,500 average (2022-2024); varies $1,000-$8,500 by country Against Malaria Foundation: $5,500 per life saved New Incentives (vaccination incentives): $4,500 per life saved Malaria Consortium (seasonal malaria chemoprevention): $3,500 per life saved VAS program details: $2 to provide vitamin A supplements to child for one year Note: Figures accurate for 2024. Helen Keller VAS program has wide country variation ($1K-$8.5K) but $3,500 is accurate average. Among most cost-effective interventions globally Additional sources: https://www.givewell.org/charities/top-charities | https://www.givewell.org/charities/helen-keller-international | https://ourworldindata.org/cost-effectiveness
.
9.
U.S. Department of Defense.
5.56mm NATO ammunition bulk procurement pricing. (2024)
The cost of 5.56mm NATO ammunition at military bulk procurement rates is approximately $0.40 per round, based on Lake City Army Ammunition Plant production and commercial market floor prices for mil-spec M855 ammunition.
10.
Pike, J.
U.s. Forces fire 250,000 rounds for every insurgent killed. (2011)
The General Accounting Office reports that US forces used 1.8 billion rounds of small-arms ammunition per year, a level that more than doubled in five years. An estimated 250,000 rounds were fired for every insurgent killed in Iraq and Afghanistan.
12.
CDC MMWR. Childhood vaccination economic benefits.
CDC MMWR https://www.cdc.gov/mmwr/volumes/73/wr/mm7331a2.htm (1994)
US programs (1994-2023): $540B direct savings, $2.7T societal savings ( $18B/year direct, $90B/year societal) Global (2001-2020): $820B value for 10 diseases in 73 countries ( $41B/year) ROI: $11 return per $1 invested Measles vaccination alone saved 93.7M lives (61% of 154M total) over 50 years (1974-2024) Additional sources: https://www.cdc.gov/mmwr/volumes/73/wr/mm7331a2.htm | https://www.thelancet.com/journals/lancet/article/PIIS0140-6736(24)00850-X/fulltext
.
14.
World Health Organization. WHO global health estimates 2024.
World Health Organization https://www.who.int/data/gho/data/themes/mortality-and-global-health-estimates (2024)
Comprehensive mortality and morbidity data by cause, age, sex, country, and year Global mortality: 55-60 million deaths annually Lives saved by modern medicine (vaccines, cardiovascular drugs, oncology): 12M annually (conservative aggregate) Leading causes of death: Cardiovascular disease (17.9M), Cancer (10.3M), Respiratory disease (4.0M) Note: Baseline data for regulatory mortality analysis. Conservative estimate of pharmaceutical impact based on WHO immunization data (4.5M/year from vaccines) + cardiovascular interventions (3.3M/year) + oncology (1.5M/year) + other therapies. Additional sources: https://www.who.int/data/gho/data/themes/mortality-and-global-health-estimates
.
16.
U.S. Bureau of Labor Statistics.
CPI inflation calculator. (2024)
CPI-U (1980): 82.4 CPI-U (2024): 313.5 Inflation multiplier (1980-2024): 3.80× Cumulative inflation: 280.48% Average annual inflation rate: 3.08% Note: Official U.S. government inflation data using Consumer Price Index for All Urban Consumers (CPI-U). Additional sources: https://www.bls.gov/data/inflation_calculator.htm
.
17.
James Surowiecki.
The Wisdom of Crowds. (Surowiecki, 2004).
Explores the aggregation of information in groups, arguing that decisions are often better than could have been made by any single member of the group. The opening anecdote relates Francis Galton’s surprise that the crowd at a county fair accurately guessed the weight of an ox when the median of their individual guesses was taken. The three conditions for a group to be intelligent are diversity, independence, and decentralization. Additional sources: https://archive.org/details/wisdomofcrowds0000suro | https://en.wikipedia.org/wiki/The_Wisdom_of_Crowds | https://www.amazon.com/Wisdom-Crowds-James-Surowiecki/dp/0385721706
.
18.
ClinicalTrials.gov API v2 direct analysis. ClinicalTrials.gov cumulative enrollment data (2025).
Direct analysis via ClinicalTrials.gov API v2 https://clinicaltrials.gov/data-api/api Analysis of 100,000 active/recruiting/completed trials on ClinicalTrials.gov (as of January 2025) shows cumulative enrollment of 12.2 million participants: Phase 1 (722k), Phase 2 (2.2M), Phase 3 (6.5M), Phase 4 (2.7M). Median participants per trial: Phase 1 (33), Phase 2 (60), Phase 3 (237), Phase 4 (90). Additional sources: https://clinicaltrials.gov/data-api/api
.
19.
ACS CAN. Clinical trial patient participation rate.
ACS CAN: Barriers to Clinical Trial Enrollment https://www.fightcancer.org/policy-resources/barriers-patient-enrollment-therapeutic-clinical-trials-cancer Only 3-5% of adult cancer patients in US receive treatment within clinical trials About 5% of American adults have ever participated in any clinical trial Oncology: 2-3% of all oncology patients participate Contrast: 50-60% enrollment for pediatric cancer trials (<15 years old) Note: 20% of cancer trials fail due to insufficient enrollment; 11% of research sites enroll zero patients Additional sources: https://www.fightcancer.org/policy-resources/barriers-patient-enrollment-therapeutic-clinical-trials-cancer | https://hints.cancer.gov/docs/Briefs/HINTS_Brief_48.pdf
.
20.
ScienceDaily. Global prevalence of chronic disease.
ScienceDaily: GBD 2015 Study https://www.sciencedaily.com/releases/2015/06/150608081753.htm (2015)
2.3 billion individuals had more than five ailments (2013) Chronic conditions caused 74% of all deaths worldwide (2019), up from 67% (2010) Approximately 1 in 3 adults suffer from multiple chronic conditions (MCCs) Risk factor exposures: 2B exposed to biomass fuel, 1B to air pollution, 1B smokers Projected economic cost: $47 trillion by 2030 Note: 2.3B with 5+ ailments is more accurate than "2B with chronic disease." One-third of all adults globally have multiple chronic conditions Additional sources: https://www.sciencedaily.com/releases/2015/06/150608081753.htm | https://pmc.ncbi.nlm.nih.gov/articles/PMC10830426/ | https://pmc.ncbi.nlm.nih.gov/articles/PMC6214883/
.
21.
C&EN. Annual number of new drugs approved globally: 50.
C&EN https://cen.acs.org/pharmaceuticals/50-new-drugs-received-FDA/103/i2 (2025)
50 new drugs approved annually Additional sources: https://cen.acs.org/pharmaceuticals/50-new-drugs-received-FDA/103/i2 | https://www.fda.gov/drugs/development-approval-process-drugs/novel-drug-approvals-fda
.
22.
Williams, R. J., Tse, T., DiPiazza, K. & Zarin, D. A.
Terminated trials in the ClinicalTrials.gov results database: Evaluation of availability of primary outcome data and reasons for termination.
PLOS One 10, e0127242 (2015)
Approximately 12% of trials with results posted on the ClinicalTrials.gov results database (905/7,646) were terminated. Primary reasons: insufficient accrual (57% of non-data-driven terminations), business/strategic reasons, and efficacy/toxicity findings (21% data-driven terminations).
25.
OpenSecrets. Defense sector lobbying summary.
OpenSecrets https://www.opensecrets.org/federal-lobbying/sectors/summary?id=D (2025)
Military sector federal lobbying totaled $198,009,793 in 2025, up from $159.5 million in 2024 and $142.9 million in 2023. Additional sources: https://www.opensecrets.org/federal-lobbying/sectors/summary?id=D
.
26.
GiveWell. Cost per DALY for deworming programs.
https://www.givewell.org/international/technical/programs/deworming/cost-effectiveness Schistosomiasis treatment: $28.19-$70.48 per DALY (using arithmetic means with varying disability weights) Soil-transmitted helminths (STH) treatment: $82.54 per DALY (midpoint estimate) Note: GiveWell explicitly states this 2011 analysis is "out of date" and their current methodology focuses on long-term income effects rather than short-term health DALYs Additional sources: https://www.givewell.org/international/technical/programs/deworming/cost-effectiveness
.
28.
Calculated from IHME Global Burden of Disease (2.55B DALYs) and global GDP per capita valuation. $109 trillion annual global disease burden.
The global economic burden of disease, including direct healthcare costs ($8.2 trillion) and lost productivity ($100.9 trillion from 2.55 billion DALYs × $39,570 per DALY), totals approximately $109.1 trillion annually.
30.
Biotechnology Innovation Organization (BIO). BIO clinical development success rates 2011-2020.
Biotechnology Innovation Organization (BIO) https://go.bio.org/rs/490-EHZ-999/images/ClinicalDevelopmentSuccessRates2011_2020.pdf (2021)
Phase I duration: 2.3 years average Total time to market (Phase I-III + approval): 10.5 years average Phase transition success rates: Phase I→II: 63.2%, Phase II→III: 30.7%, Phase III→Approval: 58.1% Overall probability of approval from Phase I: 12% Note: Largest publicly available study of clinical trial success rates. Efficacy lag = 10.5 - 2.3 = 8.2 years post-safety verification. Additional sources: https://go.bio.org/rs/490-EHZ-999/images/ClinicalDevelopmentSuccessRates2011_2020.pdf
.
31.
Nature Medicine. Drug repurposing rate ( 30%).
Nature Medicine https://www.nature.com/articles/s41591-024-03233-x (2024)
Approximately 30% of drugs gain at least one new indication after initial approval. Additional sources: https://www.nature.com/articles/s41591-024-03233-x
.
32.
EPI. Education investment economic multiplier (2.1).
EPI: Public Investments Outside Core Infrastructure https://www.epi.org/publication/bp348-public-investments-outside-core-infrastructure/ Early childhood education: Benefits 12X outlays by 2050; $8.70 per dollar over lifetime Educational facilities: $1 spent → $1.50 economic returns Energy efficiency comparison: 2-to-1 benefit-to-cost ratio (McKinsey) Private return to schooling: 9% per additional year (World Bank meta-analysis) Note: 2.1 multiplier aligns with benefit-to-cost ratios for educational infrastructure/energy efficiency. Early childhood education shows much higher returns (12X by 2050) Additional sources: https://www.epi.org/publication/bp348-public-investments-outside-core-infrastructure/ | https://documents1.worldbank.org/curated/en/442521523465644318/pdf/WPS8402.pdf | https://freopp.org/whitepapers/establishing-a-practical-return-on-investment-framework-for-education-and-skills-development-to-expand-economic-opportunity/
.
33.
PMC. Healthcare investment economic multiplier (1.8).
PMC: California Universal Health Care https://pmc.ncbi.nlm.nih.gov/articles/PMC5954824/ (2022)
Healthcare fiscal multiplier: 4.3 (95% CI: 2.5-6.1) during pre-recession period (1995-2007) Overall government spending multiplier: 1.61 (95% CI: 1.37-1.86) Why healthcare has high multipliers: No effect on trade deficits (spending stays domestic); improves productivity & competitiveness; enhances long-run potential output Gender-sensitive fiscal spending (health & care economy) produces substantial positive growth impacts Note: "1.8" appears to be conservative estimate; research shows healthcare multipliers of 4.3 Additional sources: https://pmc.ncbi.nlm.nih.gov/articles/PMC5954824/ | https://cepr.org/voxeu/columns/government-investment-and-fiscal-stimulus | https://ncbi.nlm.nih.gov/pmc/articles/PMC3849102/ | https://set.odi.org/wp-content/uploads/2022/01/Fiscal-multipliers-review.pdf
.
34.
World Bank. Infrastructure investment economic multiplier (1.6).
World Bank: Infrastructure Investment as Stimulus https://blogs.worldbank.org/en/ppps/effectiveness-infrastructure-investment-fiscal-stimulus-what-weve-learned (2022)
Infrastructure fiscal multiplier: 1.6 during contractionary phase of economic cycle Average across all economic states: 1.5 (meaning $1 of public investment → $1.50 of economic activity) Time horizon: 0.8 within 1 year, 1.5 within 2-5 years Range of estimates: 1.5-2.0 (following 2008 financial crisis & American Recovery Act) Italian public construction: 1.5-1.9 multiplier US ARRA: 0.4-2.2 range (differential impacts by program type) Economic Policy Institute: Uses 1.6 for infrastructure spending (middle range of estimates) Note: Public investment less likely to crowd out private activity during recessions; particularly effective when monetary policy loose with near-zero rates Additional sources: https://blogs.worldbank.org/en/ppps/effectiveness-infrastructure-investment-fiscal-stimulus-what-weve-learned | https://www.gihub.org/infrastructure-monitor/insights/fiscal-multiplier-effect-of-infrastructure-investment/ | https://cepr.org/voxeu/columns/government-investment-and-fiscal-stimulus | https://www.richmondfed.org/publications/research/economic_brief/2022/eb_22-04
.
35.
Mercatus. Military spending economic multiplier (0.6).
Mercatus: Defense Spending and Economy https://www.mercatus.org/research/research-papers/defense-spending-and-economy Ramey (2011): 0.6 short-run multiplier Barro (1981): 0.6 multiplier for WWII spending (war spending crowded out 40¢ private economic activity per federal dollar) Barro & Redlick (2011): 0.4 within current year, 0.6 over two years; increased govt spending reduces private-sector GDP portions General finding: $1 increase in deficit-financed federal military spending = less than $1 increase in GDP Variation by context: Central/Eastern European NATO: 0.6 on impact, 1.5-1.6 in years 2-3, gradual fall to zero Ramey & Zubairy (2018): Cumulative 1% GDP increase in military expenditure raises GDP by 0.7% Additional sources: https://www.mercatus.org/research/research-papers/defense-spending-and-economy | https://cepr.org/voxeu/columns/world-war-ii-america-spending-deficits-multipliers-and-sacrifice | https://www.rand.org/content/dam/rand/pubs/research_reports/RRA700/RRA739-2/RAND_RRA739-2.pdf
.
40.
FDA. FDA-approved prescription drug products (20,000+).
FDA https://www.fda.gov/media/143704/download There are over 20,000 prescription drug products approved for marketing. Additional sources: https://www.fda.gov/media/143704/download
.
45.
Institute for Health Metrics and Evaluation (IHME). IHME global burden of disease 2021 (2.88B DALYs, 1.13B YLD).
Institute for Health Metrics and Evaluation (IHME) https://vizhub.healthdata.org/gbd-results/ (2024)
In 2021, global DALYs totaled approximately 2.88 billion, comprising 1.75 billion Years of Life Lost (YLL) and 1.13 billion Years Lived with Disability (YLD). This represents a 13% increase from 2019 (2.55B DALYs), largely attributable to COVID-19 deaths and aging populations. YLD accounts for approximately 39% of total DALYs, reflecting the substantial burden of non-fatal chronic conditions. Additional sources: https://vizhub.healthdata.org/gbd-results/ | https://www.thelancet.com/journals/lancet/article/PIIS0140-6736(24)00757-8/fulltext | https://www.healthdata.org/research-analysis/about-gbd
.
46.
Costs of War Project, Brown University Watson Institute. Environmental cost of war ($100B annually).
Brown Watson Costs of War: Environmental Cost https://watson.brown.edu/costsofwar/costs/social/environment War on Terror emissions: 1.2B metric tons GHG (equivalent to 257M cars/year) Military: 5.5% of global GHG emissions (2X aviation + shipping combined) US DoD: World’s single largest institutional oil consumer, 47th largest emitter if nation Cleanup costs: $500B+ for military contaminated sites Gaza war environmental damage: $56.4B; landmine clearance: $34.6B expected Climate finance gap: Rich nations spend 30X more on military than climate finance Note: Military activities cause massive environmental damage through GHG emissions, toxic contamination, and long-term cleanup costs far exceeding current climate finance commitments Additional sources: https://watson.brown.edu/costsofwar/costs/social/environment | https://earth.org/environmental-costs-of-wars/ | https://transformdefence.org/transformdefence/stats/
.
47.
SIPRI. 36:1 disparity ratio of spending on weapons over cures.
SIPRI: Military Spending https://www.sipri.org/commentary/blog/2016/opportunity-cost-world-military-spending (2016)
Global military spending: $2.7 trillion (2024, SIPRI) Global government medical research: $68 billion (2024) Actual ratio: 39.7:1 in favor of weapons over medical research Military R&D alone: $85B (2004 data, 10% of global R&D) Military spending increases crowd out health: 1% ↑ military = 0.62% ↓ health spending Note: Ratio actually worse than 36:1. Each 1% increase in military spending reduces health spending by 0.62%, with effect more intense in poorer countries (0.962% reduction) Additional sources: https://www.sipri.org/commentary/blog/2016/opportunity-cost-world-military-spending | https://pmc.ncbi.nlm.nih.gov/articles/PMC9174441/ | https://www.congress.gov/crs-product/R45403
.
48.
Think by Numbers. Lost human capital due to war ($270B annually).
Think by Numbers https://thinkbynumbers.org/military/war/the-economic-case-for-peace-a-comprehensive-financial-analysis/ (2021)
Lost human capital from war: $300B annually (economic impact of losing skilled/productive individuals to conflict) Broader conflict/violence cost: $14T/year globally 1.4M violent deaths/year; conflict holds back economic development, causes instability, widens inequality, erodes human capital 2002: 48.4M DALYs lost from 1.6M violence deaths = $151B economic value (2000 USD) Economic toll includes: commodity prices, inflation, supply chain disruption, declining output, lost human capital Additional sources: https://thinkbynumbers.org/military/war/the-economic-case-for-peace-a-comprehensive-financial-analysis/ | https://www.weforum.org/stories/2021/02/war-violence-costs-each-human-5-a-day/ | https://pubmed.ncbi.nlm.nih.gov/19115548/
.
49.
PubMed. Psychological impact of war cost ($100B annually).
PubMed: Economic Burden of PTSD https://pubmed.ncbi.nlm.nih.gov/35485933/ PTSD economic burden (2018 U.S.): $232.2B total ($189.5B civilian, $42.7B military) Civilian costs driven by: Direct healthcare ($66B), unemployment ($42.7B) Military costs driven by: Disability ($17.8B), direct healthcare ($10.1B) Exceeds costs of other mental health conditions (anxiety, depression) War-exposed populations: 2-3X higher rates of anxiety, depression, PTSD; women and children most vulnerable Note: Actual burden $232B, significantly higher than "$100B" claimed Additional sources: https://pubmed.ncbi.nlm.nih.gov/35485933/ | https://news.va.gov/103611/study-national-economic-burden-of-ptsd-staggering/ | https://pmc.ncbi.nlm.nih.gov/articles/PMC9957523/
.
50.
CGDev. UNHCR average refugee support cost.
CGDev https://www.cgdev.org/blog/costs-hosting-refugees-oecd-countries-and-why-uk-outlier (2024)
The average cost of supporting a refugee is $1,384 per year. This represents total host country costs (housing, healthcare, education, security). OECD countries average $6,100 per refugee (mean 2022-2023), with developing countries spending $700-1,000. Global weighted average of $1,384 is reasonable given that 75-85% of refugees are in low/middle-income countries. Additional sources: https://www.cgdev.org/blog/costs-hosting-refugees-oecd-countries-and-why-uk-outlier | https://www.unhcr.org/sites/default/files/2024-11/UNHCR-WB-global-cost-of-refugee-inclusion-in-host-country-health-systems.pdf
.
51.
VA. Veteran healthcare cost projections.
VA https://department.va.gov/wp-content/uploads/2025/06/2026-Budget-in-Brief.pdf (2026)
VA budget: $441.3B requested for FY 2026 (10% increase). Disability compensation: $165.6B in FY 2024 for 6.7M veterans. PACT Act projected to increase spending by $300B between 2022-2031. Costs under Toxic Exposures Fund: $20B (2024), $30.4B (2025), $52.6B (2026). Additional sources: https://department.va.gov/wp-content/uploads/2025/06/2026-Budget-in-Brief.pdf | https://www.cbo.gov/publication/45615 | https://www.legion.org/information-center/news/veterans-healthcare/2025/june/va-budget-tops-400-billion-for-2025-from-higher-spending-on-mandated-benefits-medical-care
.
53.
Cybersecurity Ventures. Cybercrime economy projected to reach $10.5 trillion.
Cybersecurity Ventures: $10.5T Cybercrime https://cybersecurityventures.com/hackerpocalypse-cybercrime-report-2016/ (2016)
Global cybercrime costs: $3T (2015) → $6T (2021) → $10.5T (2025 projected) 15% annual growth rate If measured as country, would be 3rd largest economy after US and China Greatest transfer of economic wealth in history Note: More profitable than global trade of all major illegal drugs combined. Includes data theft, productivity loss, IP theft, fraud Additional sources: <https://cybersecurityventures.com/hackerpocalypse-cybercrime-report-2016/> | https://www.boisestate.edu/cybersecurity/2022/06/16/cybercrime-to-cost-the-world-10-5-trillion-annually-by-2025/
.
55.
Bolt, J. & Zanden, J. L. van.
Maddison project database 2020. (2020)
Historical GDP per capita estimates from year 1 to present. Global GDP per capita in 1900: approximately 1,260 in 1990 international dollars (roughly 3,150 in 2024 USD after PPP and inflation adjustment). Standard reference for long-run comparative economic history.
56.
Applied Clinical Trials. Global government spending on interventional clinical trials: $3-6 billion/year.
Applied Clinical Trials https://www.appliedclinicaltrialsonline.com/view/sizing-clinical-research-market Estimated range based on NIH ( $0.8-5.6B), NIHR ($1.6B total budget), and EU funding ( $1.3B/year). Roughly 5-10% of global market. Additional sources: https://www.appliedclinicaltrialsonline.com/view/sizing-clinical-research-market | https://www.thelancet.com/journals/langlo/article/PIIS2214-109X(20)30357-0/fulltext
.
60.
United Nations Department of Economic and Social Affairs, Population Division.
World population prospects 2024: Summary of results. (2024)
The 2024 Revision of the World Population Prospects provides population estimates and projections for 237 countries or areas. Global median age approximately 30.5 years in 2024, reflecting population-weighted average across all regions.
63.
UN. Global population reaches 8 billion.
UN: World Population 8 Billion Nov 15 2022 https://www.un.org/en/desa/world-population-reach-8-billion-15-november-2022 (2022)
Milestone: November 15, 2022 (UN World Population Prospects 2022) Day of Eight Billion" designated by UN Added 1 billion people in just 11 years (2011-2022) Growth rate: Slowest since 1950; fell under 1% in 2020 Future: 15 years to reach 9B (2037); projected peak 10.4B in 2080s Projections: 8.5B (2030), 9.7B (2050), 10.4B (2080-2100 plateau) Note: Milestone reached Nov 2022. Population growth slowing; will take longer to add next billion (15 years vs 11 years) Additional sources: https://www.un.org/en/desa/world-population-reach-8-billion-15-november-2022 | https://www.un.org/en/dayof8billion | https://en.wikipedia.org/wiki/Day_of_Eight_Billion
.
64.
Harvard Kennedy School. 3.5% participation tipping point.
Harvard Kennedy School https://www.hks.harvard.edu/centers/carr/publications/35-rule-how-small-minority-can-change-world (2020)
The research found that nonviolent campaigns were twice as likely to succeed as violent ones, and once 3.5% of the population were involved, they were always successful. Chenoweth and Maria Stephan studied the success rates of civil resistance efforts from 1900 to 2006, finding that nonviolent movements attracted, on average, four times as many participants as violent movements and were more likely to succeed. Key finding: Every campaign that mobilized at least 3.5% of the population in sustained protest was successful (in their 1900-2006 dataset) Note: The 3.5% figure is a descriptive statistic from historical analysis, not a guaranteed threshold. One exception (Bahrain 2011-2014 with 6%+ participation) has been identified. The rule applies to regime change, not policy change in democracies. Additional sources: https://www.hks.harvard.edu/centers/carr/publications/35-rule-how-small-minority-can-change-world | https://www.hks.harvard.edu/sites/default/files/2024-05/Erica%20Chenoweth_2020-005.pdf | https://www.bbc.com/future/article/20190513-it-only-takes-35-of-people-to-change-the-world | https://en.wikipedia.org/wiki/3.5%25_rule
.
65.
International IDEA.
International IDEA voter turnout database world export. (2026)
Best current register-based estimate of global registered voters. Sum of the latest available country-level Registration counts in International IDEA’s world export on 2026-04-22 = 4,128,142,495 registered voters across 199 countries and political entities. Methodology notes that Registration is the number of names on the voters’ register as reported by electoral management bodies, and comparability is imperfect because voter rolls and registration systems differ across countries. Additional sources: https://www.idea.int/data-tools/data/voter-turnout-database | https://www.idea.int/data-tools/export?type=region_only&themeId=293&world=all&loc=home
.
66.
Federation of American Scientists. World nuclear forces.
Federation of American Scientists https://fas.org/issues/nuclear-weapons/status-world-nuclear-forces/ (2024)
As of early 2025, we estimate that the world’s nine nuclear-armed states possess a combined total of approximately 12,241 nuclear warheads. Additional sources: https://fas.org/issues/nuclear-weapons/status-world-nuclear-forces/
.
67.
PMC. Only 12% of human interactome targeted.
PMC https://pmc.ncbi.nlm.nih.gov/articles/PMC10749231/ (2023)
Mapping 350,000+ clinical trials showed that only 12% of the human interactome has ever been targeted by drugs. Additional sources: https://pmc.ncbi.nlm.nih.gov/articles/PMC10749231/
.
69.
McFarland, M. J., Hauer, M. E. & Reuben, A.
Half of US population exposed to adverse lead levels in early childhood.
Proceedings of the National Academy of Sciences 119, e2118631119 (2022)
Leaded gasoline, used in the US from 1923 until its on-road ban in 1996, exposed more than half of the 2015 US population to adverse blood-lead levels in early childhood. The authors estimate childhood lead exposure cost the population a cumulative 824 million IQ points, an average of 2.6 points per person, rising to 5.9 points for the most-exposed 1966-1970 birth cohort.
72.
OpenSecrets. Lobbyist statistics for washington d.c.
OpenSecrets: Lobbying in US https://en.wikipedia.org/wiki/Lobbying_in_the_United_States Registered lobbyists: Over 12,000 (some estimates); 12,281 registered (2013) Former government employees as lobbyists: 2,200+ former federal employees (1998-2004), including 273 former White House staffers, 250 former Congress members & agency heads Congressional revolving door: 43% (86 of 198) lawmakers who left 1998-2004 became lobbyists; currently 59% leaving to private sector work for lobbying/consulting firms/trade groups Executive branch: 8% were registered lobbyists at some point before/after government service Additional sources: https://en.wikipedia.org/wiki/Lobbying_in_the_United_States | https://www.opensecrets.org/revolving-door | https://www.citizen.org/article/revolving-congress/ | https://www.propublica.org/article/we-found-a-staggering-281-lobbyists-whove-worked-in-the-trump-administration
.
76.
NHGRI. Human genome project and CRISPR discovery.
NHGRI https://www.genome.gov/11006929/2003-release-international-consortium-completes-hgp (2003)
Your DNA is 3 billion base pairs Read the entire code (Human Genome Project, completed 2003) Learned to edit it (CRISPR, discovered 2012) Additional sources: https://www.genome.gov/11006929/2003-release-international-consortium-completes-hgp | https://www.nobelprize.org/prizes/chemistry/2020/press-release/
.
77.
U.S. Government Accountability Office.
Electronic Health Records: First Year of CMS’s Incentive Programs Shows Opportunities to Improve Processes to Verify Providers Met Requirements.
https://www.gao.gov/products/gao-12-481 (2012).
81.
Calculated from Orphanet Journal of Rare Diseases (2024). Diseases getting first effective treatment each year.
Calculated from Orphanet Journal of Rare Diseases (2024) https://ojrd.biomedcentral.com/articles/10.1186/s13023-024-03398-1 (2024)
Under the current system, approximately 10-15 diseases per year receive their FIRST effective treatment. Calculation: 5% of 7,000 rare diseases ( 350) have FDA-approved treatment, accumulated over 40 years of the Orphan Drug Act = 9 rare diseases/year. Adding 5-10 non-rare diseases that get first treatments yields 10-20 total. FDA approves 50 drugs/year, but many are for diseases that already have treatments (me-too drugs, second-line therapies). Only 15 represent truly FIRST treatments for previously untreatable conditions.
82.
NIH. NIH budget (FY 2025).
NIH https://www.nih.gov/about-nih/organization/budget (2024)
The budget total of $47.7 billion also includes $1.412 billion derived from PHS Evaluation financing... Additional sources: https://www.nih.gov/about-nih/organization/budget | https://officeofbudget.od.nih.gov/
.
83.
Bentley et al. NIH spending on clinical trials: 3.3%.
Bentley et al. https://pmc.ncbi.nlm.nih.gov/articles/PMC10349341/ (2023)
NIH spent $8.1 billion on clinical trials for approved drugs (2010-2019), representing 3.3% of relevant NIH spending. Additional sources: https://pmc.ncbi.nlm.nih.gov/articles/PMC10349341/ | https://catalyst.harvard.edu/news/article/nih-spent-8-1b-for-phased-clinical-trials-of-drugs-approved-2010-19-10-of-reported-industry-spending/
.
84.
PMC. Standard medical research ROI ($20k-$100k/QALY).
PMC: Cost-effectiveness Thresholds Used by Study Authors https://pmc.ncbi.nlm.nih.gov/articles/PMC10114019/ (1990)
Typical cost-effectiveness thresholds for medical interventions in rich countries range from $50,000 to $150,000 per QALY. The Institute for Clinical and Economic Review (ICER) uses a $100,000-$150,000/QALY threshold for value-based pricing. Between 1990-2021, authors increasingly cited $100,000 (47% by 2020-21) or $150,000 (24% by 2020-21) per QALY as benchmarks for cost-effectiveness. Additional sources: https://pmc.ncbi.nlm.nih.gov/articles/PMC10114019/ | https://icer.org/our-approach/methods-process/cost-effectiveness-the-qaly-and-the-evlyg/
.
85.
Manhattan Institute. RECOVERY trial 82× cost reduction.
Manhattan Institute: Slow Costly Trials https://manhattan.institute/article/slow-costly-clinical-trials-drag-down-biomedical-breakthroughs RECOVERY trial: $500 per patient ($20M for 48,000 patients = $417/patient) Typical clinical trial: $41,000 median per-patient cost Cost reduction: 80-82× cheaper ($41,000 ÷ $500 ≈ 82×) Efficiency: $50 per patient per answer (10 therapeutics tested, 4 effective) Dexamethasone estimated to save >630,000 lives Additional sources: https://manhattan.institute/article/slow-costly-clinical-trials-drag-down-biomedical-breakthroughs | https://pmc.ncbi.nlm.nih.gov/articles/PMC9293394/
.
86.
Trials. Patient willingness to participate in clinical trials.
Trials: Patients’ Willingness Survey https://trialsjournal.biomedcentral.com/articles/10.1186/s13063-015-1105-3 Recent surveys: 49-51% willingness (2020-2022) - dramatic drop from 85% (2019) during COVID-19 pandemic Cancer patients when approached: 88% consented to trials (Royal Marsden Hospital) Study type variation: 44.8% willing for drug trial, 76.2% for diagnostic study Top motivation: "Learning more about my health/medical condition" (67.4%) Top barrier: "Worry about experiencing side effects" (52.6%) Additional sources: https://trialsjournal.biomedcentral.com/articles/10.1186/s13063-015-1105-3 | https://www.appliedclinicaltrialsonline.com/view/industry-forced-to-rethink-patient-participation-in-trials | https://pmc.ncbi.nlm.nih.gov/articles/PMC7183682/
.
87.
The Commune. Pentagon audit failures ($2.46T unaccounted).
The Commune https://thecommunemag.com/the-pentagon-misplaced-2-46-trillion-an-in-depth-look-at-the-financial-audit-failures (2024)
In the most recent audit, the Department of Defense (DoD) could not account for approximately 60% of its \(4.1 trillion in assets, amounting to\)2.46 trillion unaccounted for. Alternative title: Pentagon unsupported accounting adjustments (\(6.5T, single year, US Army) In 2015, the Department of Defense's Inspector General reported that the Army could not adequately support\)6.5 trillion in year-end adjustments, indicating severe accounting discrepancies. Additional sources: https://thecommunemag.com/the-pentagon-misplaced-2-46-trillion-an-in-depth-look-at-the-financial-audit-failures | https://accmag.com/audit-pentagon-cannot-account-for-6-5-trillion-dollars-is-taxpayer-money/
.
88.
Tufts CSDD. Cost of drug development.
Various estimates suggest $1.0 - $2.5 billion to bring a new drug from discovery through FDA approval, spread across 10 years. Tufts Center for the Study of Drug Development often cited for $1.0 - $2.6 billion/drug. Industry reports (IQVIA, Deloitte) also highlight $2+ billion figures.
89.
Value in Health. Average lifetime revenue per successful drug.
Value in Health: Sales Revenues for New Therapeutic Agents https://www.sciencedirect.com/science/article/pii/S1098301524027542 Study of 361 FDA-approved drugs from 1995-2014 (median follow-up 13.2 years): Mean lifetime revenue: $15.2 billion per drug Median lifetime revenue: $6.7 billion per drug Revenue after 5 years: $3.2 billion (mean) Revenue after 10 years: $9.5 billion (mean) Revenue after 15 years: $19.2 billion (mean) Distribution highly skewed: top 25 drugs (7%) accounted for 38% of total revenue ($2.1T of $5.5T) Additional sources: https://www.sciencedirect.com/science/article/pii/S1098301524027542
.
90.
Lichtenberg, F. R.
How many life-years have new drugs saved? A three-way fixed-effects analysis of 66 diseases in 27 countries, 2000-2013.
International Health 11, 403–416 (2019)
Using 3-way fixed-effects methodology (disease-country-year) across 66 diseases in 22 countries, this study estimates that drugs launched after 1981 saved 148.7 million life-years in 2013 alone. The regression coefficients for drug launches 0-11 years prior (beta=-0.031, SE=0.008) and 12+ years prior (beta=-0.057, SE=0.013) on years of life lost are highly significant (p<0.0001). Confidence interval for life-years saved: 79.4M-239.8M (95 percent CI) based on propagated standard errors from Table 2.
91.
Deloitte. Pharmaceutical r&d return on investment (ROI).
Deloitte: Measuring Pharmaceutical Innovation 2025 https://www.deloitte.com/ch/en/Industries/life-sciences-health-care/research/measuring-return-from-pharmaceutical-innovation.html (2025)
Deloitte’s annual study of top 20 pharma companies by R&D spend (2010-2024): 2024 ROI: 5.9% (second year of growth after decade of decline) 2023 ROI: 4.3% (estimated from trend) 2022 ROI: 1.2% (historic low since study began, 13-year low) 2021 ROI: 6.8% (record high, inflated by COVID-19 vaccines/treatments) Long-term trend: Declining for over a decade before 2023 recovery Average R&D cost per asset: $2.3B (2022), $2.23B (2024) These returns (1.2-5.9% range) fall far below typical corporate ROI targets (15-20%) Additional sources: https://www.deloitte.com/ch/en/Industries/life-sciences-health-care/research/measuring-return-from-pharmaceutical-innovation.html | https://www.prnewswire.com/news-releases/deloittes-13th-annual-pharmaceutical-innovation-report-pharma-rd-return-on-investment-falls-in-post-pandemic-market-301738807.html | https://hitconsultant.net/2023/02/16/pharma-rd-roi-falls-to-lowest-level-in-13-years/
.
92.
Nature Reviews Drug Discovery. Drug trial success rate from phase i to approval.
Nature Reviews Drug Discovery: Clinical Success Rates https://www.nature.com/articles/nrd.2016.136 (2016)
Overall Phase I to approval: 10-12.8% (conventional wisdom 10%, studies show 12.8%) Recent decline: Average LOA now 6.7% for Phase I (2014-2023 data) Leading pharma companies: 14.3% average LOA (range 8-23%) Varies by therapeutic area: Oncology 3.4%, CNS/cardiovascular lowest at Phase III Phase-specific success: Phase I 47-54%, Phase II 28-34%, Phase III 55-70% Note: 12% figure accurate for historical average. Recent data shows decline to 6.7%, with Phase II as primary attrition point (28% success) Additional sources: https://www.nature.com/articles/nrd.2016.136 | https://pmc.ncbi.nlm.nih.gov/articles/PMC6409418/ | https://academic.oup.com/biostatistics/article/20/2/273/4817524
.
93.
SofproMed. Phase 3 cost per trial range.
SofproMed https://www.sofpromed.com/how-much-does-a-clinical-trial-cost Phase 3 clinical trials cost between $20 million and $282 million per trial, with significant variation by therapeutic area and trial complexity. Additional sources: https://www.sofpromed.com/how-much-does-a-clinical-trial-cost | https://www.cbo.gov/publication/57126
.
94.
Ramsberg, J. & Platt, R. Pragmatic trial cost per patient (median $97).
Learning Health Systems https://pmc.ncbi.nlm.nih.gov/articles/PMC6508852/ (2018)
Meta-analysis of 108 embedded pragmatic clinical trials (2006-2016). The median cost per patient was $97 (IQR $19–$478), based on 2015 dollars. 25% of trials cost <$19/patient; 10 trials exceeded $1,000/patient. U.S. studies median $187 vs non-U.S. median $27. Additional sources: https://pmc.ncbi.nlm.nih.gov/articles/PMC6508852/
.
95.
ICRC. International campaign to ban landmines (ICBL) - ottawa treaty (1997).
ICRC https://www.icrc.org/en/doc/resources/documents/article/other/57jpjn.htm (1997)
ICBL: Founded 1992 by 6 NGOs (Handicap International, Human Rights Watch, Medico International, Mines Advisory Group, Physicians for Human Rights, Vietnam Veterans of America Foundation) Started with ONE staff member: Jody Williams as founding coordinator Grew to 1,000+ organizations in 60 countries by 1997 Ottawa Process: 14 months (October 1996 - December 1997) Convention signed by 122 states on December 3, 1997; entered into force March 1, 1999 Achievement: Nobel Peace Prize 1997 (shared by ICBL and Jody Williams) Government funding context: Canada established $100M CAD Canadian Landmine Fund over 10 years (1997); International donors provided $169M in 1997 for mine action (up from $100M in 1996) Additional sources: https://www.icrc.org/en/doc/resources/documents/article/other/57jpjn.htm | https://en.wikipedia.org/wiki/International_Campaign_to_Ban_Landmines | https://www.nobelprize.org/prizes/peace/1997/summary/ | https://un.org/press/en/1999/19990520.MINES.BRF.html | https://www.the-monitor.org/en-gb/reports/2003/landmine-monitor-2003/mine-action-funding.aspx
.
96.
OpenSecrets.
Revolving door: Former members of congress. (2024)
388 former members of Congress are registered as lobbyists. Nearly 5,400 former congressional staffers have left Capitol Hill to become federal lobbyists in the past 10 years. Additional sources: https://www.opensecrets.org/revolving-door
.
97.
Kinch, M. S. & Griesenauer, R. H.
Lost medicines: A longer view of the pharmaceutical industry with the potential to reinvigorate discovery.
Drug Discovery Today 24, 875–880 (2019)
Research identified 1,600+ medicines available in 1962. The 1950s represented industry high-water mark with >30 new products in five of ten years; this rate would not be replicated until late 1990s. More than half (880) of these medicines were lost following implementation of Kefauver-Harris Amendment. The peak of 1962 would not be seen again until early 21st century. By 2016 number of organizations actively involved in R&D at level not seen since 1914.
98.
Baily, M. N. Pre-1962 drug development costs (baily 1972).
Baily (1972) https://samizdathealth.org/wp-content/uploads/2020/12/hlthaff.1.2.6.pdf (1972)
Pre-1962: Average cost per new chemical entity (NCE) was $6.5 million (1980 dollars) Inflation-adjusted to 2024 dollars: $6.5M (1980) ≈ $22.5M (2024), using CPI multiplier of 3.46× Real cost increase (inflation-adjusted): $22.5M (pre-1962) → $2,600M (2024) = 116× increase Note: This represents the most comprehensive academic estimate of pre-1962 drug development costs based on empirical industry data Additional sources: https://samizdathealth.org/wp-content/uploads/2020/12/hlthaff.1.2.6.pdf
.
99.
Think by Numbers. Pre-1962 physician-led clinical trials.
Think by Numbers: How Many Lives Does FDA Save? https://thinkbynumbers.org/health/how-many-net-lives-does-the-fda-save/ (1966)
Pre-1962: Physicians could report real-world evidence directly 1962 Drug Amendments replaced "premarket notification" with "premarket approval", requiring extensive efficacy testing Impact: New regulatory clampdown reduced new treatment production by 70%; lifespan growth declined from 4 years/decade to 2 years/decade Drug Efficacy Study Implementation (DESI): NAS/NRC evaluated 3,400+ drugs approved 1938-1962 for safety only; reviewed >3,000 products, >16,000 therapeutic claims FDA has had authority to accept real-world evidence since 1962, clarified by 21st Century Cures Act (2016) Note: Specific "144,000 physicians" figure not verified in sources Additional sources: https://thinkbynumbers.org/health/how-many-net-lives-does-the-fda-save/ | https://www.fda.gov/drugs/enforcement-activities-fda/drug-efficacy-study-implementation-desi | http://www.nasonline.org/about-nas/history/archives/collections/des-1966-1969-1.html
.
100.
GAO. 95% of diseases have 0 FDA-approved treatments.
GAO https://www.gao.gov/products/gao-25-106774 (2025)
95% of diseases have no treatment Additional sources: https://www.gao.gov/products/gao-25-106774 | https://globalgenes.org/rare-disease-facts/
.
102.
NHS England; Águas et al. RECOVERY trial global lives saved ( 1 million).
NHS England: 1 Million Lives Saved https://www.england.nhs.uk/2021/03/covid-treatment-developed-in-the-nhs-saves-a-million-lives/ (2021)
Dexamethasone saved 1 million lives worldwide (NHS England estimate, March 2021, 9 months after discovery). UK alone: 22,000 lives saved. Methodology: Águas et al. Nature Communications 2021 estimated 650,000 lives (range: 240,000-1,400,000) for July-December 2020 alone, based on RECOVERY trial mortality reductions (36% for ventilated, 18% for oxygen-only patients) applied to global COVID hospitalizations. June 2020 announcement: Dexamethasone reduced deaths by up to 1/3 (ventilated patients), 1/5 (oxygen patients). Impact immediate: Adopted into standard care globally within hours of announcement. Additional sources: https://www.england.nhs.uk/2021/03/covid-treatment-developed-in-the-nhs-saves-a-million-lives/ | https://www.nature.com/articles/s41467-021-21134-2 | https://pharmaceutical-journal.com/article/news/steroid-has-saved-the-lives-of-one-million-covid-19-patients-worldwide-figures-show | https://www.recoverytrial.net/news/recovery-trial-celebrates-two-year-anniversary-of-life-saving-dexamethasone-result
.
104.
National September 11 Memorial & Museum.
September 11 attack facts. (2024)
2,977 people were killed in the September 11, 2001 attacks: 2,753 at the World Trade Center, 184 at the Pentagon, and 40 passengers and crew on United Flight 93 in Shanksville, Pennsylvania.
106.
ICER. Value per QALY (standard economic value).
ICER https://icer.org/wp-content/uploads/2024/02/Reference-Case-4.3.25.pdf (2024)
Standard economic value per QALY: $100,000–$150,000. This is the US and global standard willingness-to-pay threshold for interventions that add costs. Dominant interventions (those that save money while improving health) are favorable regardless of this threshold. Additional sources: https://icer.org/wp-content/uploads/2024/02/Reference-Case-4.3.25.pdf
.
107.
GAO. Annual cost of u.s. Sugar subsidies.
GAO: Sugar Program https://www.gao.gov/products/gao-24-106144 Consumer costs: $2.5-3.5 billion per year (GAO estimate) Net economic cost: $1 billion per year 2022: US consumers paid 2X world price for sugar Program costs $3-4 billion/year but no federal budget impact (costs passed directly to consumers via higher prices) Employment impact: 10,000-20,000 manufacturing jobs lost annually in sugar-reliant industries (confectionery, etc.) Multiple studies confirm: Sweetener Users Association ($2.9-3.5B), AEI ($2.4B consumer cost), Beghin & Elobeid ($2.9-3.5B consumer surplus) Additional sources: https://www.gao.gov/products/gao-24-106144 | https://www.heritage.org/agriculture/report/the-us-sugar-program-bad-consumers-bad-agriculture-and-bad-america | https://www.aei.org/articles/the-u-s-spends-4-billion-a-year-subsidizing-stalinist-style-domestic-sugar-production/
.
108.
World Bank. Swiss military budget as percentage of GDP.
World Bank: Military Expenditure https://data.worldbank.org/indicator/MS.MIL.XPND.GD.ZS?locations=CH 2023: 0.70272% of GDP (World Bank) 2024: CHF 5.95 billion official military spending When including militia system costs: 1% GDP (CHF 8.75B) Comparison: Near bottom in Europe; only Ireland, Malta, Moldova spend less (excluding microstates with no armies) Additional sources: https://data.worldbank.org/indicator/MS.MIL.XPND.GD.ZS?locations=CH | https://www.avenir-suisse.ch/en/blog-defence-spending-switzerland-is-in-better-shape-than-it-seems/ | https://tradingeconomics.com/switzerland/military-expenditure-percent-of-gdp-wb-data.html
.
109.
World Bank. Switzerland vs. US GDP per capita comparison.
World Bank: Switzerland GDP Per Capita https://data.worldbank.org/indicator/NY.GDP.PCAP.CD?locations=CH 2024 GDP per capita (PPP-adjusted): Switzerland $93,819 vs United States $75,492 Switzerland’s GDP per capita 24% higher than US when adjusted for purchasing power parity Nominal 2024: Switzerland $103,670 vs US $85,810 Additional sources: https://data.worldbank.org/indicator/NY.GDP.PCAP.CD?locations=CH | https://tradingeconomics.com/switzerland/gdp-per-capita-ppp | https://www.theglobaleconomy.com/USA/gdp_per_capita_ppp/
.
110.
FDA Study via NCBI. Trial costs, FDA study.
FDA Study via NCBI https://www.ncbi.nlm.nih.gov/pmc/articles/PMC6248200/ Overall, the 138 clinical trials had an estimated median (IQR) cost of $19.0 million ($12.2 million-$33.1 million)... The clinical trials cost a median (IQR) of $41,117 ($31,802-$82,362) per patient. Additional sources: https://www.ncbi.nlm.nih.gov/pmc/articles/PMC6248200/
.
111.
WHO. Annual global economic burden of alzheimer’s and other dementias.
WHO: Dementia Fact Sheet https://www.who.int/news-room/fact-sheets/detail/dementia (2019)
Global cost: $1.3 trillion (2019 WHO-commissioned study) 50% from informal caregivers (family/friends, 5 hrs/day) 74% of costs in high-income countries despite 61% of patients in LMICs $818B (2010) → $1T (2018) → $1.3T (2019) - rapid growth Note: Costs increased 35% from 2010-2015 alone. Informal care represents massive hidden economic burden Additional sources: https://www.who.int/news-room/fact-sheets/detail/dementia | https://alz-journals.onlinelibrary.wiley.com/doi/10.1002/alz.12901
.
112.
JAMA Oncology. Annual global economic burden of cancer.
JAMA Oncology: Global Cost 2020-2050 https://jamanetwork.com/journals/jamaoncology/fullarticle/2801798 (2020)
2020-2050 projection: $25.2 trillion total ($840B/year average) 2010 annual cost: $1.16 trillion (direct costs only) Recent estimate: $3 trillion/year (all costs included) Top 5 cancers: lung (15.4%), colon/rectum (10.9%), breast (7.7%), liver (6.5%), leukemia (6.3%) Note: China/US account for 45% of global burden; 75% of deaths in LMICs but only 50.0% of economic cost Additional sources: https://jamanetwork.com/journals/jamaoncology/fullarticle/2801798 | https://www.nature.com/articles/d41586-023-00634-9
.
114.
Diabetes Care. Annual global economic burden of diabetes.
Diabetes Care: Global Economic Burden https://diabetesjournals.org/care/article/41/5/963/36522/Global-Economic-Burden-of-Diabetes-in-Adults 2015: $1.3 trillion (1.8% of global GDP) 2030 projections: $2.1T-2.5T depending on scenario IDF health expenditure: $760B (2019) → $845B (2045 projected) 2/3 direct medical costs ($857B), 1/3 indirect costs (lost productivity) Note: Costs growing rapidly; expected to exceed $2T by 2030 Additional sources: https://diabetesjournals.org/care/article/41/5/963/36522/Global-Economic-Burden-of-Diabetes-in-Adults | https://doi.org/10.1016/S2213-8587(17)30097-9
.
116.
Environmental Working Group. US farm subsidy database and analysis.
Environmental Working Group https://farm.ewg.org/ (2024)
US agricultural subsidies total approximately $30 billion annually, but create much larger economic distortions. Top 10% of farms receive 78% of subsidies, benefits concentrated in commodity crops (corn, soy, wheat, cotton), environmental damage from monoculture incentivized, and overall deadweight loss estimated at $50-120 billion annually. Additional sources: https://farm.ewg.org/ | https://www.ers.usda.gov/topics/farm-economy/farm-sector-income-finances/government-payments-the-safety-net/
.
117.
Drug Policy Alliance.
The drug war by the numbers. (2021)
Since 1971, the war on drugs has cost the United States an estimated $1 trillion in enforcement. The federal drug control budget was $41 billion in 2022. Mass incarceration costs the U.S. at least $182 billion every year, with over $450 billion spent to incarcerate individuals on drug charges in federal prisons.
118.
International Monetary Fund.
IMF fossil fuel subsidies data: 2023 update. (2023)
Globally, fossil fuel subsidies were $7 trillion in 2022 or 7.1 percent of GDP. The United States subsidies totaled $649 billion. Underpricing for local air pollution costs and climate damages are the largest contributor, accounting for about 30 percent each.
119.
Papanicolas, Irene et al. Health care spending in the united states and other high-income countries.
Papanicolas et al. https://jamanetwork.com/journals/jama/article-abstract/2674671 (2018)
The US spent approximately twice as much as other high-income countries on medical care (mean per capita: $9,892 vs $5,289), with similar utilization but much higher prices. Administrative costs accounted for 8% of US spending vs 1-3% in other countries. US spending on pharmaceuticals was $1,443 per capita vs $749 elsewhere. Despite spending more, US health outcomes are not better. Additional sources: https://jamanetwork.com/journals/jama/article-abstract/2674671
.
120.
Hsieh, C.-T. & Moretti, E. Housing constraints and spatial misallocation.
American Economic Journal: Macroeconomics https://www.aeaweb.org/articles?id=10.1257/mac.20170388 (2019)
We quantify the amount of spatial misallocation of labor across US cities and its aggregate costs. Tight land-use restrictions in high-productivity cities like New York, San Francisco, and Boston lowered aggregate US growth by 36% from 1964 to 2009. Local constraints on housing supply have had enormous effects on the national economy. Additional sources: https://www.aeaweb.org/articles?id=10.1257/mac.20170388
.
122.
Tax Foundation. Tax compliance costs the US economy $546 billion annually.
https://taxfoundation.org/data/all/federal/irs-tax-compliance-costs/ (2024)
Americans will spend over 7.9 billion hours complying with IRS tax filing and reporting requirements in 2024. This costs the economy roughly $413 billion in lost productivity. In addition, the IRS estimates that Americans spend roughly $133 billion annually in out-of-pocket costs, bringing the total compliance costs to $546 billion, or nearly 2 percent of GDP.
123.
Cook, C., Cole, G., Asaria, P., Jabbour, R. & Francis, D. P. Annual global economic burden of heart disease.
International Journal of Cardiology https://www.internationaljournalofcardiology.com/article/S0167-5273(13)02238-9/abstract (2014)
Heart failure alone: $108 billion/year (2012 global analysis, 197 countries) US CVD: $555B (2016) → projected $1.8T by 2050 LMICs total CVD loss: $3.7T cumulative (2011-2015, 5-year period) CVD is costliest disease category in most developed nations Note: No single $2.1T global figure found; estimates vary widely by scope and year Additional sources: https://www.ahajournals.org/doi/10.1161/CIR.0000000000001258
.
124.
Manuel, D. U.s. Defense spending history: 100 years of military budgets.
DaveManuel.com https://www.davemanuel.com/us-defense-spending-history-military-budget-data.php (2025)
US military spending in constant 2024 dollars: 1939 $29B (pre-WW2 baseline), 1940 $37B, 1944 $1,383B, 1945 $1,420B (peak), 1946 $674B, 1947 $176B, 1948 $117B, 2024 $886B. The post-WW2 demobilization cut spending 88% in two years (1945-1947). Current peacetime spending ($886B) is 30x the pre-WW2 baseline and 62% of peak WW2 spending, in inflation-adjusted dollars.
125.
Statista. US military budget as percentage of GDP.
Statista https://www.statista.com/statistics/262742/countries-with-the-highest-military-spending/ (2024)
U.S. military spending amounted to 3.5% of GDP in 2024. In 2024, the U.S. spent nearly $1 trillion on its military budget, equal to 3.4% of GDP. Additional sources: https://www.statista.com/statistics/262742/countries-with-the-highest-military-spending/ | https://www.sipri.org/sites/default/files/2025-04/2504_fs_milex_2024.pdf
.
126.
U.S. Senate. Treaties.
U.S. Senate https://www.senate.gov/about/powers-procedures/treaties.htm The Constitution provides that the president ’shall have Power, by and with the Advice and Consent of the Senate, to make Treaties, provided two-thirds of the Senators present concur’ (Article II, section 2). Treaties are formal agreements with foreign nations that require two-thirds Senate approval. 67 senators (two-thirds of 100) must vote to ratify a treaty for it to take effect. Additional sources: https://www.senate.gov/about/powers-procedures/treaties.htm
.
128.
Federal Election Commission.
Statistical summary of 24-month campaign activity of the 2023-2024 election cycle. (2023)
Presidential candidates raised $2 billion; House and Senate candidates raised $3.8 billion and spent $3.7 billion; PACs raised $15.7 billion and spent $15.5 billion. Total federal campaign spending approximately $20 billion. Additional sources: https://www.fec.gov/updates/statistical-summary-of-24-month-campaign-activity-of-the-2023-2024-election-cycle/
.
129.
OpenSecrets.
Federal lobbying hit record $4.4 billion in 2024. (2024)
Total federal lobbying reached record $4.4 billion in 2024. The $150 million increase in lobbying continues an upward trend that began in 2016. Additional sources: https://www.opensecrets.org/news/2025/02/federal-lobbying-set-new-record-in-2024/
.
130.
DOT. DOT value of statistical life ($13.6M).
DOT: VSL Guidance 2024 https://www.transportation.gov/office-policy/transportation-policy/revised-departmental-guidance-on-valuation-of-a-statistical-life-in-economic-analysis (2024)
Current VSL (2024): $13.7 million (updated from $13.6M) Used in cost-benefit analyses for transportation regulations and infrastructure Methodology updated in 2013 guidance, adjusted annually for inflation and real income VSL represents aggregate willingness to pay for safety improvements that reduce fatalities by one Note: DOT has published VSL guidance periodically since 1993. Current $13.7M reflects 2024 inflation/income adjustments Additional sources: https://www.transportation.gov/office-policy/transportation-policy/revised-departmental-guidance-on-valuation-of-a-statistical-life-in-economic-analysis | https://www.transportation.gov/regulations/economic-values-used-in-analysis
.
131.
PLOS ONE. Cost per DALY for vitamin a supplementation.
PLOS ONE: Cost-effectiveness of "Golden Mustard" for Treating Vitamin A Deficiency in India (2010) https://journals.plos.org/plosone/article?id=10.1371/journal.pone.0012046 (2010)
India: $23-$50 per DALY averted (least costly intervention, $1,000-$6,100 per death averted) Sub-Saharan Africa (2022): $220-$860 per DALY (Burkina Faso: $220, Kenya: $550, Nigeria: $860) WHO estimates for Africa: $40 per DALY for fortification, $255 for supplementation Uganda fortification: $18-$82 per DALY (oil: $18, sugar: $82) Note: Wide variation reflects differences in baseline VAD prevalence, coverage levels, and whether intervention is supplementation or fortification Additional sources: https://journals.plos.org/plosone/article?id=10.1371/journal.pone.0012046 | https://journals.plos.org/plosone/article?id=10.1371/journal.pone.0266495
.
134.
PMC. Cost-effectiveness threshold ($50,000/QALY).
PMC https://pmc.ncbi.nlm.nih.gov/articles/PMC5193154/ The $50,000/QALY threshold is widely used in US health economics literature, originating from dialysis cost benchmarks in the 1980s. In US cost-utility analyses, 77.5% of authors use either $50,000 or $100,000 per QALY as reference points. Most successful health programs cost $3,000-10,000 per QALY. WHO-CHOICE uses GDP per capita multiples (1× GDP/capita = "very cost-effective", 3× GDP/capita = "cost-effective"), which for the US ( $70,000 GDP/capita) translates to $70,000-$210,000/QALY thresholds. Additional sources: https://pmc.ncbi.nlm.nih.gov/articles/PMC5193154/ | https://pmc.ncbi.nlm.nih.gov/articles/PMC9278384/
.
135.
Ramsberg, J. & Platt, R. Opportunities and barriers for pragmatic embedded trials: Triumphs and tribulations.
Harvard Medical School/Harvard Pilgrim Health Care Institute https://pmc.ncbi.nlm.nih.gov/articles/PMC6508852/ (2018)
Meta-analysis of 108 embedded pragmatic clinical trials (2006-2016). The median cost per patient was $97 (mean $478) across all trials reviewed. 25% of studies cost less than $19 per patient. US studies had higher median costs ($187 vs $27 non-US). Registry-based trials were less expensive than EHR-based trials. Traditional RCT comparison: $16,600/patient (Berndt & Cockburn 2014). The 108 trials had median enrollment of 5,540 patients with broad eligibility criteria. 81% used cluster randomization. Trials spanned 15 countries, infectious diseases (25%), cardiovascular (18%), diabetes (12%). Additional sources: https://pmc.ncbi.nlm.nih.gov/articles/PMC6508852/
.
136.
Sinn, M. P.
The Continuous Evidence Generation Protocol: Two-Stage Validation (RWE → Pragmatic Trials).
https://dfda-protocol.acceleratedmedicine.org (2025) doi:
10.5281/zenodo.18203375 We present the Predictor Impact Score (PIS), a novel composite metric operationalizing Bradford Hill causality criteria for automated signal detection from aggregated N-of-1 observational studies. Combined with pragmatic trial confirmation (based on evidence from 108+ embedded trials), this two-stage framework would generate validated outcome labels at 44.1x lower cost than traditional Phase III trials. This enables continuous, population-scale pharmacovigilance and precision dosing recommendations.
137.
Sinn, M. P.
Ubiquitous Pragmatic Trial Impact Analysis: How to Prevent a Year of Death and Suffering for 84 Cents.
https://manual.warondisease.org/knowledge/appendix/dfda-impact-paper.html (2025) doi:
10.5281/zenodo.18243914 Only 15 diseases/year get their first treatment each year. With 6.65 thousand diseases lacking effective treatments, the backlog would take 443 years to clear. Integrating pragmatic trials into standard healthcare increases trial capacity 12.3x, cutting that timeline from 443 years to 36 years. The average untreated disease gets a treatment 212 years earlier, saving 10.7 billion deaths at $0.842 per year of healthy life saved.
139.
ACLED. Active combat deaths annually.
ACLED: Global Conflict Surged 2024 https://acleddata.com/2024/12/12/data-shows-global-conflict-surged-in-2024-the-washington-post/ (2024)
2024: 233,597 deaths (30% increase from 179,099 in 2023) Deadliest conflicts: Ukraine (67,000), Palestine (35,000) Nearly 200,000 acts of violence (25% higher than 2023, double from 5 years ago) One in six people globally live in conflict-affected areas Additional sources: https://acleddata.com/2024/12/12/data-shows-global-conflict-surged-in-2024-the-washington-post/ | https://acleddata.com/media-citation/data-shows-global-conflict-surged-2024-washington-post | https://acleddata.com/conflict-index/index-january-2024/
.
140.
AllTrials. Publication rate of clinical trial results.
AllTrials: Half of Trials Unreported https://www.alltrials.net/news/half-of-all-trials-unreported/ (2013)
50.0% of clinical trials never publish results (NHS-funded systematic review, 2010) Schmucker et al (2014): 53% of trials published (analyzing 39 studies, >20,000 trials) Munch et al (2014): 46% of pain treatment trials published Chang et al (2015): 49% of high-risk cardiac device trials published Positive findings: 3X more likely to be published than negative results Antidepressant example: Published literature showed 94% positive trials; FDA analysis showed only 51% positive Additional sources: https://www.alltrials.net/news/half-of-all-trials-unreported/ | https://www.nature.com/articles/nature.2013.14286 | https://pmc.ncbi.nlm.nih.gov/articles/PMC8276556/
.
141.
Sakaeda et al. FAERS adverse event underreporting rate.
PubMed: Empirical estimation of under-reporting in FAERS https://pubmed.ncbi.nlm.nih.gov/28447485/ (2017)
Empirical estimation: Average reporting rate approximately 6%, meaning 94% of adverse events are underreported Variability: 0.01% to 44% for statin events; 0.002% to >100% for biological drugs; 20% to >100% for narrow therapeutic index (NTI) drugs Selective reporting: Serious, unusual events more likely reported than mild or expected ones Newly marketed drugs: Higher reporting rates due to heightened awareness Older drugs: Events often under-reported Note: FAERS voluntary reporting system captures only "tip of the iceberg" of drug safety problems. Under-reporting introduces inherent biases and limitations in pharmacovigilance data Additional sources: https://pubmed.ncbi.nlm.nih.gov/28447485/ | https://pmc.ncbi.nlm.nih.gov/articles/PMC12393772/
.
142.
Graham, David (FDA) | Lancet. Vioxx cardiovascular deaths (rofecoxib).
PMC: FDA incapable of protecting against another Vioxx https://pmc.ncbi.nlm.nih.gov/articles/PMC534432/ (2007)
Graham testimony (2004): 88,000-139,000 U.S. heart attacks/strokes from Vioxx; up to 55,000 deaths (40% fatality rate) Lancet study estimate: 88,000 Americans had heart attacks from Vioxx; 38,000 died FDA memo (2004): Vioxx contributed to 27,785 heart attacks and sudden cardiac deaths (1999-2003) High-dose Vioxx: Tripled risk of heart attacks and sudden cardiac death Prescriptions: 92.8 million U.S. prescriptions 1999-2003 Withdrawn: September 30, 2004 after APPROVE trial showed cardiovascular risks Note: Vioxx case demonstrates failure of passive post-market surveillance (FAERS) to detect safety signals in time. Voluntary reporting missed cardiovascular risks for years despite millions of prescriptions Additional sources: https://pmc.ncbi.nlm.nih.gov/articles/PMC534432/ | https://www.npr.org/2007/11/10/5470430/timeline-the-rise-and-fall-of-vioxx | https://www.thelancet.com/journals/lancet/article/PIIS0140-6736(05)67712-4/fulltext
.
143.
FDA. FDA sentinel initiative.
FDA: Sentinel Initiative https://www.fda.gov/safety/fdas-sentinel-initiative Launched: May 2008 in response to FDAAA 2007; transitioned to full system Feb 2016 Purpose: Active post-market risk identification and analysis (ARIA) for medical products Scale: World’s largest multisite distributed database for medical product safety; 128.7M members Data sources: Insurance claims, electronic health records, patient reports Privacy: Distributed data approach - data remains with owners, patient identifiers removed Structure (2019): 3 coordinating centers - Operations, Innovation, Community Building/Outreach Real-World Evidence: RWE Data Enterprise (RWE-DE) - 25.5M lives (21M commercial + 4.5M academic) 2008-2014: FDA mandated 657 studies under FDAAA authority Note: Major advancement in post-market surveillance. "Limited Transparency and Bureaucratic Constraints" may refer to challenges, but system represents significant FDA capability improvement Additional sources: https://www.fda.gov/safety/fdas-sentinel-initiative | https://pmc.ncbi.nlm.nih.gov/articles/PMC9667154/ | https://en.wikipedia.org/wiki/Sentinel_Initiative
.
144.
U.S. Food and Drug Administration Sentinel Initiative.
Information for providers: The sentinel initiative. (2025)
FDA now routinely uses RWD available through the Sentinel System to generate evidence about drug safety, drawing on data from claims, hospital stays, outpatient visits, and pharmaceutical dispensing data from more than 100 million individuals.
145.
Sinn, M. P.
Incentive Alignment Bonds: Making Public Goods Financially and Politically Profitable.
https://manual.warondisease.org/knowledge/appendix/incentive-alignment-bonds-paper.html (2025) doi:
10.5281/zenodo.18203221 Government spending is optimized for lobbying intensity, not net societal value. Programs with 100:1 benefit-cost ratios get billions while programs with negative returns get hundreds of billions. Incentive Alignment Bonds flip this by creating a capital pool that rewards politicians (via campaign support and post-office opportunities) for funding high-NSV programs over low-NSV alternatives. The result: public good becomes private profit for both investors and elected officials.
150.
UNHCR. UNHCR forcibly displaced people 2023.
UNHCR https://www.unhcr.org/global-trends-report-2023 (2023)
At the end of 2023, 117.3 million people worldwide were forcibly displaced. Additional sources: https://www.unhcr.org/global-trends-report-2023
.
151.
Oxford University News. RECOVERY trial summary quote.
Oxford University News https://www.ox.ac.uk/news/features/recovery-trial-two-years One trial. Over 47,000 participants. Nearly 200 hospital sites, across six countries. Ten results. Four effective COVID-19 treatments... Through discovering four treatments that effectively reduce deaths from COVID-19, it is certain that the study has saved thousands – if not millions – of lives worldwide. Additional sources: https://www.ox.ac.uk/news/features/recovery-trial-two-years
.
153.
FDA. FDA trial patient exclusion criteria.
FDA: Evaluating Inclusion & Exclusion Criteria https://www.fda.gov/media/134754/download Most frequent exclusions: Pregnancy, lactation/breastfeeding, renal/hepatic abnormalities, specific infectious diseases Pregnant/lactating women: >90% of trials exclude Older adults: 27% exclude based on age (arbitrary upper limits) Patients with organ dysfunction: Excluded due to adverse impact concerns from comorbidities/concomitant meds Multiple chronic conditions: Often exclusion criterion despite being common in target population Children/adolescents: Excluded due to ethical considerations High-risk patients: Prior malignancy history, active brain metastases, suboptimal hepatic/renal function, HIV+ FDA guidance: Working to broaden eligibility; "exclusions based on age alone rarely appropriate Note: Exclusion criteria often eliminate patients who would actually use the drug, reducing real-world applicability of trial results Additional sources: https://www.fda.gov/media/134754/download | https://www.sciencedirect.com/science/article/abs/pii/S1551714421002512 | https://ascopubs.org/doi/10.1200/EDBK_155880
.
155.
Bloom, N., Jones, C. I., Van Reenen, J. & Webb, M. Research productivity declining over time.
Bloom https://www.aeaweb.org/articles?id=10.1257/aer.20180338 (2020)
Research productivity is falling sharply everywhere we look. Averaging across industries, research productivity declines at a rate that averages about 5% per year. For example, the number of researchers required to achieve a constant level of Moore’s Law has risen by a factor of 18 since 1971. Note: This finding reflects innovation productivity in traditional research models; dFDA targets trial execution efficiency (cost per patient), not fundamental idea generation Additional sources: https://www.aeaweb.org/articles?id=10.1257/aer.20180338
.
156.
Our World in Data. Terror attack deaths (8,300 annually).
Our World in Data: Terrorism https://ourworldindata.org/terrorism (2024)
2023: 8,352 deaths (22% increase from 2022, highest since 2017) 2023: 3,350 terrorist incidents (22% decrease), but 56% increase in avg deaths per attack Global Terrorism Database (GTD): 200,000+ terrorist attacks recorded (2021 version) Maintained by: National Consortium for Study of Terrorism & Responses to Terrorism (START), U. of Maryland Geographic shift: Epicenter moved from Middle East to Central Sahel (sub-Saharan Africa) - now >50% of all deaths Additional sources: https://ourworldindata.org/terrorism | https://reliefweb.int/report/world/global-terrorism-index-2024 | https://www.start.umd.edu/gtd/ | https://ourworldindata.org/grapher/fatalities-from-terrorism
.
157.
UCDP. State violence deaths annually.
UCDP: Uppsala Conflict Data Program https://ucdp.uu.se/ Uppsala Conflict Data Program (UCDP): Tracks one-sided violence (organized actors attacking unarmed civilians) UCDP definition: Conflicts causing at least 25 battle-related deaths in calendar year 2023 total organized violence: 154,000 deaths; Non-state conflicts: 20,900 deaths UCDP collects data on state-based conflicts, non-state conflicts, and one-sided violence Specific "2,700 annually" figure for state violence not found in recent UCDP data; actual figures vary annually Additional sources: https://ucdp.uu.se/ | https://en.wikipedia.org/wiki/Uppsala_Conflict_Data_Program | https://ourworldindata.org/grapher/deaths-in-armed-conflicts-by-region
.
158.
ICER. ICER QALY methodology and standards.
ICER https://icer.org/our-approach/methods-process/cost-effectiveness-the-qaly-and-the-evlyg/ (2024)
The quality-adjusted life year (QALY) is the academic standard for measuring how well all different kinds of medical treatments lengthen and/or improve patients’ lives, and therefore the metric has served as a fundamental component of cost-effectiveness analyses in the US and around the world for more than 30 years. ICER’s health benefit price benchmark (HBPB) will continue to be reported using the standard range from $100,000 to $150,000 per QALY and per evLYG. Additional sources: https://icer.org/our-approach/methods-process/cost-effectiveness-the-qaly-and-the-evlyg/ | https://icer.org/wp-content/uploads/2024/02/Reference-Case-4.3.25.pdf
.
159.
Rare Diseases International. 300 million people with rare diseases globally.
Rare Diseases International: 300 Million Worldwide https://www.rarediseasesinternational.org/new-scientific-paper-confirms-300-million-people-living-with-a-rare-disease-worldwide/ (2019)
Conservative estimate: 300 million people (3.5-5.9% of world population of 7.5B) Range: 263-446 million people globally Based on Orphanet database analysis of 3,585 rare diseases Note: Excludes rare cancers and infectious diseases, so actual number likely higher Additional sources: https://www.rarediseasesinternational.org/new-scientific-paper-confirms-300-million-people-living-with-a-rare-disease-worldwide/ | https://sciencedaily.com/releases/2019/10/191024075007.htm | https://pmc.ncbi.nlm.nih.gov/articles/PMC9632971/
.
160.
Wikipedia. US military spending reduction after WWII.
Wikipedia https://en.wikipedia.org/wiki/Demobilization_of_United_States_Armed_Forces_after_World_War_II (2020)
Peaking at over $81 billion in 1945, the U.S. military budget plummeted to approximately $13 billion by 1948, representing an 84% decrease. The number of personnel was reduced almost 90%, from more than 12 million to about 1.5 million between mid-1945 and mid-1947. Defense spending exceeded 41 percent of GDP in 1945. After World War II, the US reduced military spending to 7.2 percent of GDP by 1948. Defense spending doubled from the 1948 low to 15 percent at the height of the Korean War in 1953. Additional sources: https://en.wikipedia.org/wiki/Demobilization_of_United_States_Armed_Forces_after_World_War_II | https://www.americanprogress.org/article/a-historical-perspective-on-military-budgets/ | https://www.stlouisfed.org/on-the-economy/2020/february/war-highest-military-spending-measured | https://www.usgovernmentspending.com/defense_spending_history
.
162.
Wikipedia. US GDP growth rate post-WWII.
Wikipedia https://en.wikipedia.org/wiki/Post–World_War_II_economic_expansion US GDP increased from $228 billion in 1945 to just under $1.7 trillion in 1975. Average real GDP growth from 1950 to 1980 was around 4.1% annually, compared to 3.1% from 1981 to 2008. Additional sources: https://en.wikipedia.org/wiki/Post–World_War_II_economic_expansion | https://www.stlouisfed.org/timely-topics/house-prices-homeownership-rise
.
163.
NIH. NIH centralized decision-making structure.
NIH Almanac https://www.nih.gov/about-nih/what-we-do/nih-almanac NIH structure: 27 Institutes and Centers, each with own research agenda Office of the Director: Sets policy, plans/manages/coordinates all NIH components Location: 9000 Rockville Pike, Bethesda, Maryland Total NIH employees: 20,000 Leadership structure: Director + 27 Institute/Center directors + division chiefs + council members Specific count of "key decision-makers" varies by definition; centralized funding decisions flow through Office of Director and IC leadership Additional sources: https://www.nih.gov/about-nih/what-we-do/nih-almanac | https://www.nih.gov/about-nih/what-we-do/nih-almanac/nih-organization
.
164.
Patsopoulos, N. A. Pragmatic vs. Explanatory trials.
Patsopoulos https://www.ncbi.nlm.nih.gov/pmc/articles/PMC3181997/ (2011)
Pragmatic trials evaluate the effectiveness of interventions in real-life routine practice conditions, whereas explanatory trials determine the efficacy of interventions under ideal situations. Pragmatic trials produce results that can be generalized and applied in routine practice settings. Note: Pragmatic trials often find smaller effect sizes than explanatory trials but have higher external validity (generalizability to real-world populations) Additional sources: https://www.ncbi.nlm.nih.gov/pmc/articles/PMC3181997/
.
166.
Science/AAAS. Estimated annual cost of repeating failed experiments due to non-publication of results.
Science/AAAS https://www.science.org/content/article/study-claims-28-billion-year-spent-irreproducible-biomedical-research (2020)
Up to 50.0% of published preclinical research is irreproducible, with an estimated annual cost of $28 billion in the U.S. alone. This is based on $56B annual spending on preclinical research × 50.0% irreproducibility rate. Main causes: reagents/materials (36%), study design (28%), data analysis (25%), protocols (11%). Additional sources: https://www.science.org/content/article/study-claims-28-billion-year-spent-irreproducible-biomedical-research | https://www.idbs.com/2020/11/replicating-science-28-billion-is-wasted-every-year-in-the-us-alone/
.