United States Efficiency Audit
A Systems Analysis of Recoverable Misallocation in U.S. Governance
Abstract
This report applies systems engineering methodology to quantify allocative inefficiency in U.S. governance across four dysfunction categories: direct spending waste, compliance burden on the private sector, policy-induced GDP loss, and system inefficiency. Using Monte Carlo simulation across ten components with OECD benchmarking, we estimate an aggregate efficiency gap of $4.98 trillion (90% CI: $4.39 trillion-$5.61 trillion) annually and recoverable capital of $2.49 trillion (90% CI: $2.19 trillion-$2.81 trillion) if U.S. performance converges toward OECD median efficiency. This categorization distinguishes direct budget waste from broader economic dysfunction, each requiring different solution pathways. We also translate the efficiency gap into QALY and VSL-equivalent welfare terms for interpretability. For global ceiling context, the Optimal Governance Trajectory reaches 56.7x (90% CI: 21x-148x) the Earth baseline after 20 years, raises average income to $1.16 million (90% CI: $429,664-$3.04 million) versus $20,483 on the status-quo path, reaches $10.7 quadrillion (90% CI: $3.95 quadrillion-$28 quadrillion) in total output, and recovers roughly $101 trillion (90% CI: $59.6 trillion-$161 trillion)/year in suppressed value (The Political Dysfunction Tax).
Keywords
allocative efficiency, systems analysis, federal spending, defense spending, healthcare administration, regulatory burden, OECD benchmarking, Monte Carlo simulation
Executive Summary
The United States federal government spends $6.8 trillion per year. It does not know what it gets for this. Nobody does. The Government Accountability Office has tried to find out and has produced 900 reports per year for decades. The departments read some of them. Nothing changed. This is the federal equivalent of a gym membership you pay for but never use, except the gym costs trillions and the treadmill is on fire.
This audit applies engineering systems analysis to federal resource allocation. Rather than treating all “waste” as equivalent, we identify four distinct categories of dysfunction, each requiring different solutions:
Dysfunction Category Breakdown
| Category | Annual Cost | Mechanism | Solution Type |
|---|---|---|---|
| Direct Spending Waste | Federal budget misallocation | Budget reallocation | |
| Compliance Burden | Private sector regulatory friction | Simplification | |
| Policy-Induced GDP Loss | Market constraint policies | Policy reform | |
| System Inefficiency | Structural design failure | System redesign | |
| Total Efficiency Gap | $4.98 trillion (90% CI: $4.39 trillion-$5.61 trillion) | (P5-P95 in variable output) | Multiple pathways |
This categorization matters: calling the entire efficiency gap “federal spending waste” invites justified criticism because only direct spending waste is budget allocations. The remainder reflects compliance burdens, policy-induced GDP losses, and system inefficiency that require different remedies.
Aggregate Metrics
| Metric | U.S. System | OECD Benchmark | Gap |
|---|---|---|---|
| Discretionary Efficiency | 75-85%a | ~34-44 pp | |
| Governance Efficiency (GDP) | 90-95%b | ~7-12 pp | |
| Recoverable Capital | $2.49 trillion (90% CI: $2.19 trillion-$2.81 trillion)/year | N/A | if closed to OECD median |
| Human Cost (QALY equivalents) | 49.8 million QALYs (90% CI: 43.9 million QALYs-56.1 million QALYs) |
N/A | N/A |
| Human Cost (VSL equivalents) | 364 thousand people (90% CI: 320 thousand people-410 thousand people) |
N/A | N/A |
a OECD benchmark derived from comparative per-capita spending analysis: peer nations (Germany, France, UK, Canada, Australia) achieve comparable outcomes with lower discretionary waste rates1.
b OECD governance efficiency benchmark: peer nations achieve comparable median income growth and HALE outcomes with total governance-related losses of 5-10% of GDP rather than 17%.
Interpretation Note
The “human cost” figures are economic equivalents, not epidemiological mortality counts. Dividing the efficiency gap by VSL ($13.7 million) or QALY threshold ($100,000) yields a measure of foregone welfare, not literal deaths prevented.
Methodological Note: Subsystem losses are estimated independently and treated as additive. While some overlap may exist (e.g., housing costs affect health via stress, incarceration overlaps with drug enforcement), excluded categories (state/local inefficiency, implicit subsidies, behavioral effects) likely offset any potential overstatement.
The efficiency gap represents capital that could fund the 1% Treaty2 3 ($27.2 billion/year) 183 (90% CI: 161-206) times over.
Scale note. This audit is the U.S. slice of a much larger ceiling. Under the project’s broader best-case governance model, the recoverable upside is $101 trillion (90% CI: $59.6 trillion-$161 trillion) per year. Over 20 years, the Optimal Governance Trajectory reaches 56.7x (90% CI: 21x-148x) the Earth baseline, raises average income to $1.16 million (90% CI: $429,664-$3.04 million) versus $20,483 on the status-quo path, and reaches $10.7 quadrillion (90% CI: $3.95 quadrillion-$28 quadrillion) in total output. This report is best read as a lower-scope national analog within that broader Political Dysfunction Tax4 framework.
System Specifications
Designed Function
The federal government’s designed function is to convert fiscal inputs (federal outlays and imposed compliance burdens) into citizen welfare. The terminal values are pleasant consciousness and unpleasant consciousness; the audit cannot measure those directly because Congress has not yet discovered feelings. So, in engineering terms, this is a machine that takes in money and produces quality of life. Any engineer looking at a machine that converts inputs to outputs at 35.4% (90% CI: 31.1%-39.5%) efficiency would replace the machine. Your species instead feeds the machine more money. We measure this conversion efficiency using two terminal general-welfare outcomes:
- After-tax real median income growth: measures economic welfare delivery
- Median healthy life years (HALE): measures health and longevity delivery
Why Two Metrics Are Sufficient
These two outputs capture all upstream factors that matter:
| Upstream Factor | Manifests in Income | Manifests in Healthy Life |
|---|---|---|
| Security/Safety | Crime costs, property loss | Violence, injury, chronic stress |
| Environment | Disaster costs, remediation | Respiratory disease, cancer |
| Freedom | Economic choice, mobility | Health decisions, reduced stress |
| Social Trust | Lower transaction costs | Mental health, social support |
| Education | Human capital, productivity | Health literacy |
| Infrastructure | Productivity, opportunity | Access to care, environmental health |
These are not omissions. They are upstream variables that manifest in terminal outcomes. Measuring income + health captures most large-scale changes in citizen welfare while remaining hard enough to fake that the machine can use them.
Input-Output Measurement
Total System Input (federal outlays baseline for efficiency rating): $6.8 trillion annually
Context (not additive):
- Federal revenue: $4.9T5
- State/local revenue attributable to federal mandates: ~$1.3T6
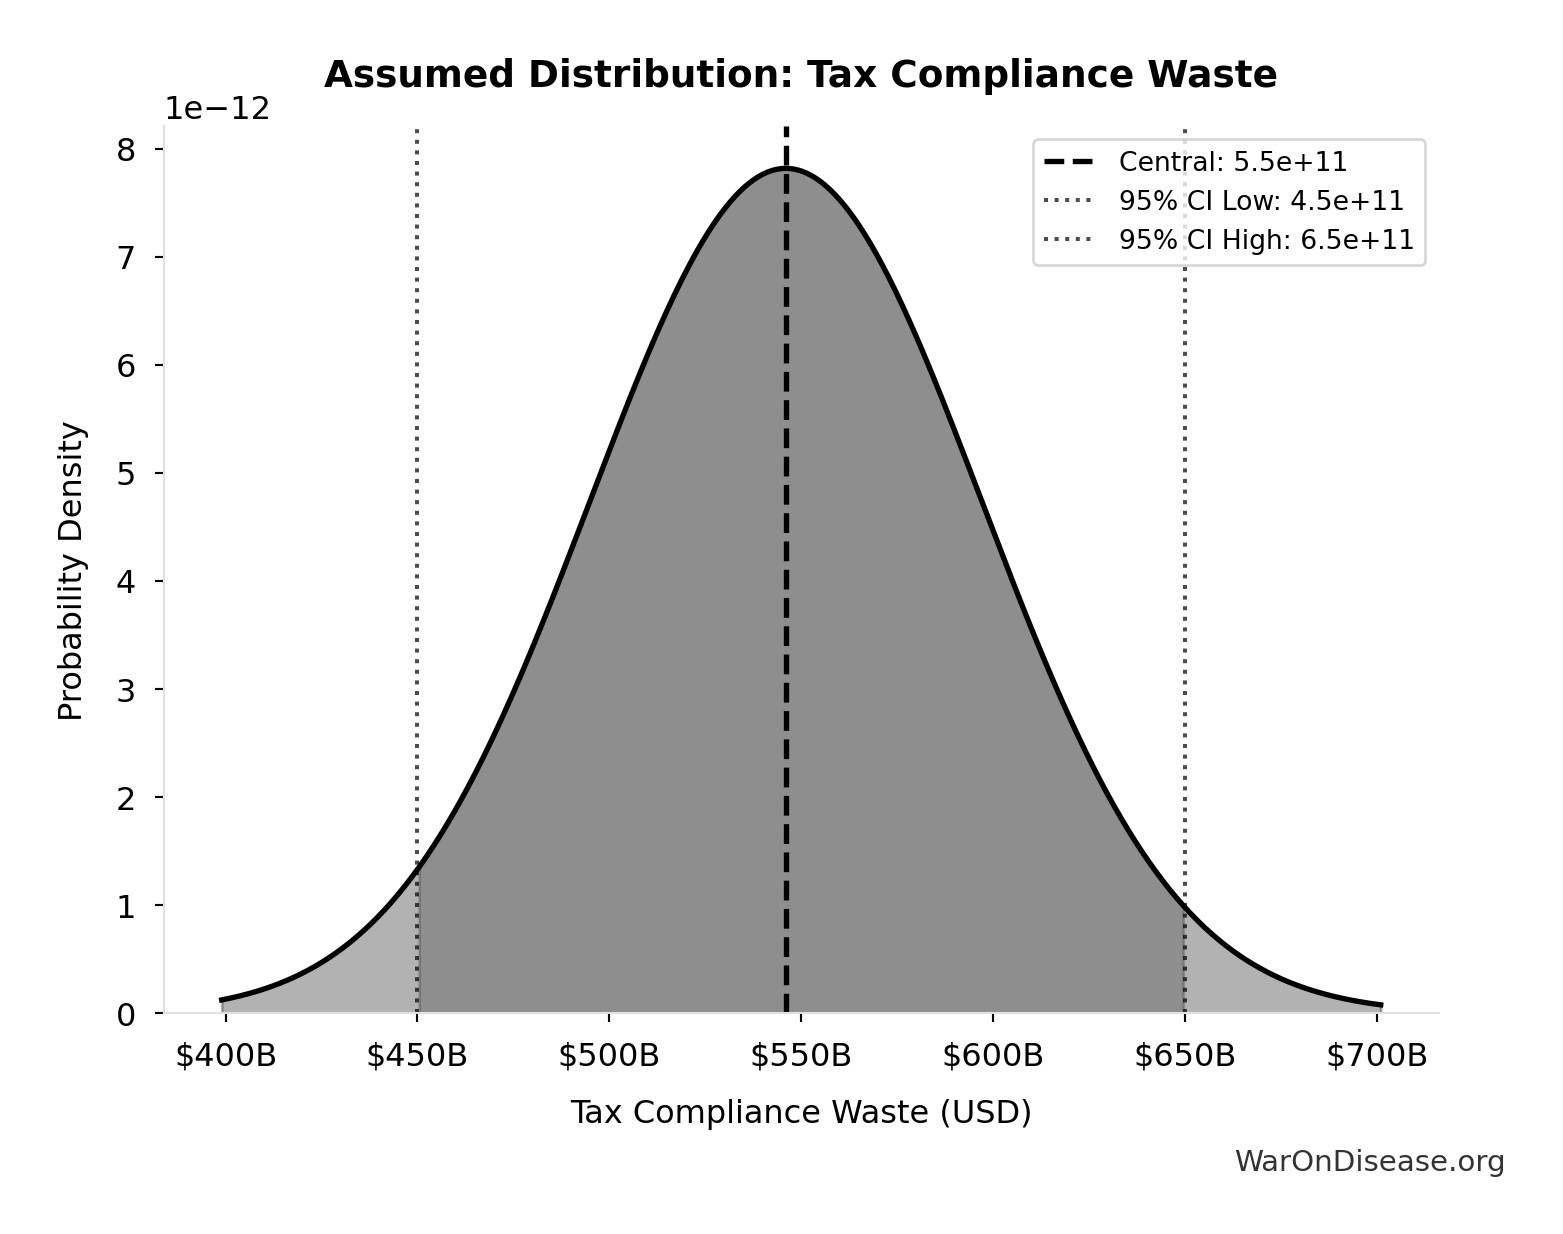
- Tax compliance burden: ~$546 billion (95% CI: $450 billion-$650 billion)7,8
Efficiency Metric: Output per dollar of input, benchmarked against OECD peer nations with comparable development levels.
For cross-country comparability, the efficiency rating uses federal outlays as the input baseline. Compliance burdens are treated as losses rather than additional inputs.
These contextual figures imply a combined fiscal and compliance footprint in the several-trillion-dollar range, but the efficiency rating uses federal outlays to keep the denominator comparable across OECD systems.
Methodology
Category Framework: Why Distinctions Matter
Calling everything “government waste” is like calling every medical problem “feeling bad.” A broken arm and a brain tumor both make you feel bad, but the treatment is different. Similarly, a dollar misspent in the federal budget requires a different fix than a dollar consumed by tax compliance or a dollar of GDP lost to zoning restrictions. We organize dysfunction into four categories by mechanism and solution pathway:
Direct Federal Spending Waste ($1.1 trillion (90% CI: $1.03 trillion-$1.17 trillion))
Actual budget allocations flowing to low-value uses. This is traditional “government waste”: military overspend, corporate welfare, drug war enforcement, fossil fuel subsidies, agricultural subsidies. The solution is budget reallocation-redirect these dollars to higher-return uses without increasing total spending.
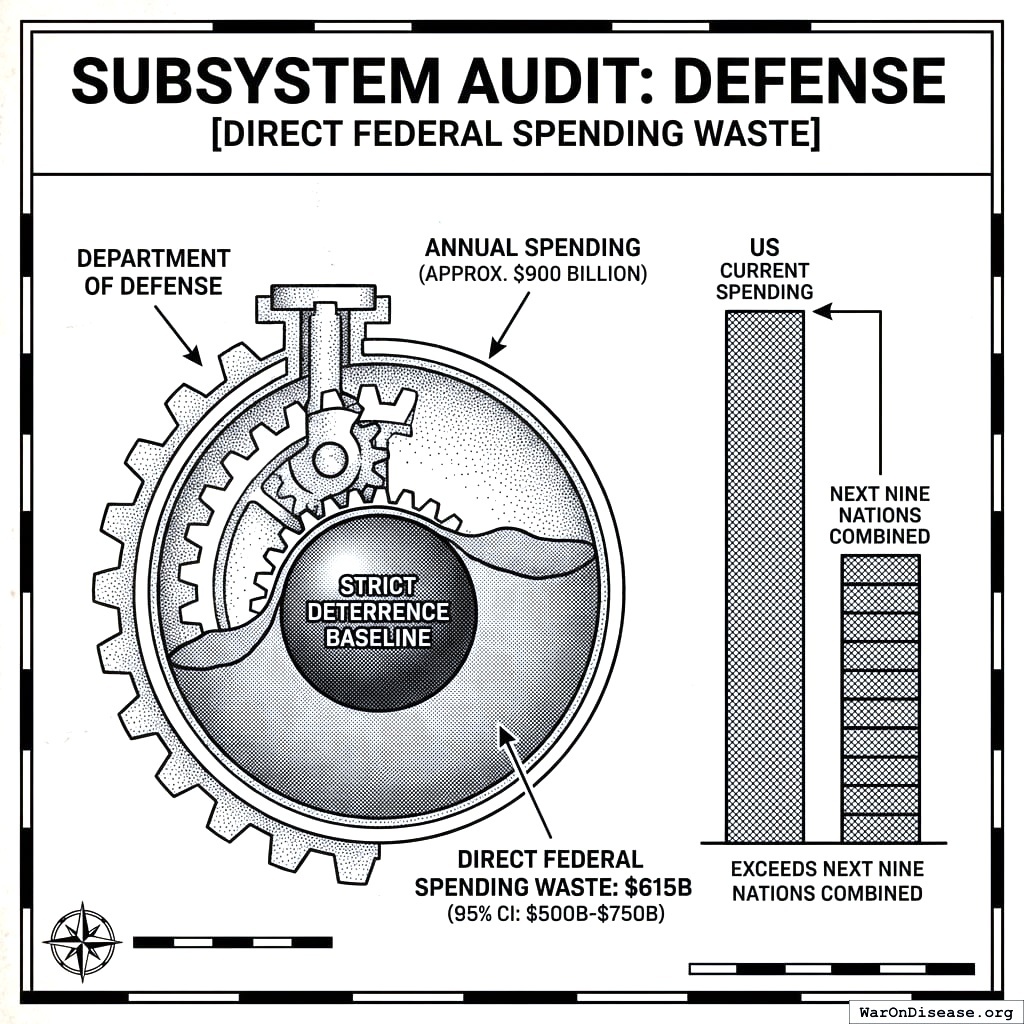
Think of military spending: the $702 billion (90% CI: $671 billion-$728 billion) “overspend” above a first-principles homeland-defense baseline ($184 billion (90% CI: $158 billion-$215 billion)) represents federal dollars that could fund disease eradication treaties instead of maintaining 750 overseas bases9.
Compliance Burden ($1.13 trillion (90% CI: $856 billion-$1.49 trillion))
Private sector resources consumed by government-imposed compliance requirements. Tax compliance costs $546 billion (95% CI: $450 billion-$650 billion) annually. This is not federal spending. The total includes 7.9 billion hours of lost productivity plus out-of-pocket filing costs. Regulatory red tape adds $580 billion (95% CI: $290 billion-$1 trillion) in procedural friction without corresponding safety benefits.
The solution is simplification. Compare current U.S. tax system to the FairTax proposal: a national consumption tax would eliminate filing for most citizens, instantly recovering most of that compliance waste. Similarly, streamlining redundant regulations (keeping safety standards but removing paperwork friction) would recapture much of the regulatory burden.
Policy-Induced GDP Loss ($1.56 trillion (90% CI: $1.11 trillion-$2.1 trillion))
Economic output that would exist but for policy constraints on markets. Housing/zoning restrictions prevent workers from moving to high-productivity cities, costing $1.4 trillion (95% CI: $500 billion-$2 trillion) annually in foregone GDP10. Tariffs cost another $160 billion (95% CI: $90 billion-$250 billion) through deadweight loss.
The solution is policy reform. Japan’s zoning system allows by-right development with minimal restrictions-the optimal comparison point showing what’s possible when government stops blocking private construction. Removing trade barriers would immediately expand economic output.
System Inefficiency ($1.2 trillion (90% CI: $1 trillion-$1.44 trillion))
Fundamental design failures where the system architecture itself prevents efficiency. Healthcare exemplifies this: $1.2 trillion (95% CI: $1 trillion-$1.5 trillion) in administrative waste not from bad management but from fragmented payment systems, lack of price transparency, and perverse incentives built into third-party payment structures.
The solution is system redesign. Compare to Singapore’s model: catastrophic coverage (government) + mandatory Health Savings Accounts (individual) + full price transparency. Or Switzerland’s regulated competition model where consumers choose insurers annually with real prices. Singapore achieves better outcomes at 4-5% of GDP, Switzerland at 11.8%, versus America’s 18%.
Why This Categorization?
Saying “the government wastes $4.98 trillion (90% CI: $4.39 trillion-$5.61 trillion)” invites the response “that’s not all waste!” Correct. Some of it is waste. Some of it is friction. Some of it is GDP that would exist if the government would get out of the way. Separately categorized, each claim becomes defensible:
- $1.1 trillion (90% CI: $1.03 trillion-$1.17 trillion) in direct budget waste? Documented line-by-line.
- $1.13 trillion (90% CI: $856 billion-$1.49 trillion) in compliance burden? Tax Foundation + Competitive Enterprise Institute data.
- $1.56 trillion (90% CI: $1.11 trillion-$2.1 trillion) in GDP loss from bad policy? Peer-reviewed economics (Hsieh & Moretti, Yale Budget Lab).
- $1.2 trillion (90% CI: $1 trillion-$1.44 trillion) in healthcare excess? JAMA, PGPF, international comparisons.
Each category points to specific remedies, so you can fix it rather than merely complain about it.
Engineering Loss Categories
We categorize resource losses using engineering terminology rather than political language. This framework adapts standard engineering efficiency analysis (where system losses are classified by mechanism rather than blame) to government resource allocation:
| Loss Category | Definition | Examples |
|---|---|---|
| Friction Losses | Administrative overhead exceeding minimum necessary (analogous to mechanical friction converting useful work to heat) | Healthcare billing complexity, tax compliance burden |
| Leakage | Fraud, improper payments, unverified expenditure | Medicare improper payments, unaudited DoD assets |
| Parasitic Load | Bureaucracy maintaining itself rather than serving function | Redundant agencies, regulatory capture |
| Transmission Loss | Efficiency loss in federal → state → local → citizen transfer | Grant administration overhead, unfunded mandates |
| Idle/Standby Loss | Capacity maintained but unused | Excess military bases, redundant weapons systems |
| Conversion Inefficiency | Policy intent failing to achieve stated outcome | Drug interdiction not reducing use |
| Negative Work | Policies producing net harm rather than benefit | Incarceration increasing recidivism |
Aggregate Efficiency Gap Calculation
The Aggregate Efficiency Gap (AEG) sums losses across all categories:
\[\text{AEG} = \sum_{i} \text{Friction}_i + \sum_{j} \text{Leakage}_j + \sum_{k} \text{Parasitic}_k + \sum_{l} \text{Transmission}_l + \sum_{m} \text{Idle}_m + \sum_{n} \text{Conversion}_n + \sum_{o} \text{Negative}_o\]
We employ Monte Carlo simulation to generate confidence intervals, recognizing uncertainty in loss estimates (particularly where data opacity exists, such as the DoD’s inability to audit 61% of assets).
Methodological Note: Additive Categories
Subsystem losses are estimated independently and treated as additive. While some overlap may exist (housing costs affect health via stress, incarceration overlaps with drug enforcement), excluded categories (state/local inefficiency, implicit subsidies, behavioral effects) likely offset any potential overstatement.
Valuation Standards
- Value of Statistical Life (VSL): $13.7 million (US Department of Transportation)11
- Quality-Adjusted Life Year (QALY): $100,000 (medical cost-effectiveness standard)12
Direct Federal Spending Waste
Total: $1.1 trillion (90% CI: $1.03 trillion-$1.17 trillion) annually
This category represents actual federal budget allocations flowing to demonstrably low-value uses. Unlike compliance burdens or GDP losses, these are dollars the federal government directly controls and could reallocate tomorrow with congressional action. The solution pathway is straightforward: budget reallocation from current uses to higher-return alternatives.
Components
| Component | Annual Cost | Optimal Comparison |
|---|---|---|
| Military overspend | First-principles homeland defense ($184 billion (90% CI: $158 billion-$215 billion)) | |
| Corporate welfare | Zero subsidies (market allocation) | |
| Drug war | Portugal decriminalization model | |
| Fossil fuel subsidies | Zero subsidies (market pricing) | |
| Agricultural subsidies | New Zealand model (ended all farm subsidies 1984)13 |
Every dollar here comes from taxpayers and goes somewhere. The question is not whether to spend it, but what to spend it on. Redirecting $702 billion (90% CI: $671 billion-$728 billion) from maintaining 750 overseas bases to funding disease eradication treaties doesn’t require new revenue-just different priorities.
Platonic Ideal: New Zealand eliminated all agricultural subsidies in 198413. Farm productivity increased. Why? Subsidies had encouraged marginal land cultivation and overproduction. Without them, farmers specialized in comparative advantages. The U.S. spends $75 billion (95% CI: $50 billion-$120 billion) annually doing precisely what New Zealand proved counterproductive.
Detailed subsystem analysis follows in: Subsystem Audit: Defense, Subsystem Audit: Justice, Subsystem Audit: Subsidies
Compliance Burden on Private Sector
Total: $1.13 trillion (90% CI: $856 billion-$1.49 trillion) annually
These costs don’t appear in the federal budget. They represent private sector resources consumed by government-imposed requirements: calculating taxes, filing paperwork, navigating regulatory red tape. The solution pathway is simplification-streamlining processes to reduce friction while preserving necessary functions.
Components
| Component | Annual Cost | Optimal Comparison |
|---|---|---|
| Tax compliance | FairTax system (consumption tax, no filing) | |
| Regulatory red tape | Evidence-based regulation (eliminate procedural friction) |
The Tax Compliance Absurdity: Americans spend 7.9 billion hours annually calculating taxes8. That’s $546 billion (95% CI: $450 billion-$650 billion) in total compliance costs. What do we get for this? The privilege of determining what we owe the government-a calculation the IRS must verify anyway.
Platonic Ideal: FairTax System
The FairTax proposes a national retail sales tax replacing income/payroll/corporate taxes. Most citizens would never file taxes. Businesses collect at point of sale (like state sales taxes already do). Complexity collapses from 75,000-page tax code to a single rate.
Would this be optimal? Perhaps not perfectly-consumption taxes have their own distortions. But compared to the current system where middle-class families spend 13 hours filing returns and $273 on preparation8, almost any simplification recovers massive waste.
The regulatory red tape figure ($580 billion (95% CI: $290 billion-$1 trillion)) represents procedural friction without corresponding safety benefits. We’re not arguing against workplace safety regulations or environmental standards. We’re identifying paperwork requirements that don’t improve outcomes-the administrative equivalent of demanding triplicate forms in three different formats.
Detailed subsystem analysis follows in: Subsystem Audit: Regulatory and Tax Compliance
Policy-Induced GDP Loss
Total: $1.56 trillion (90% CI: $1.11 trillion-$2.1 trillion) annually
These losses represent economic output that would exist but for government policy constraining markets. Not spending, not compliance-forgone GDP. Workers who can’t move to high-productivity cities because housing is illegal to build. Trade gains evaporated by tariffs. The solution pathway is policy reform: remove the constraints.
Components
| Component | Annual Cost | Optimal Comparison |
|---|---|---|
| Housing/zoning restrictions | Japan’s by-right zoning system | |
| Tariffs | Free trade (zero tariffs) |
The Zoning Stranglehold: Government prevents builders from building where people want to live. High-productivity cities like San Francisco and New York have demand for millions more housing units. Zoning restrictions make construction illegal. Result? Workers stuck in Akron when they would be more productive in San Jose. Hsieh & Moretti10 estimate large GDP losses from restrictive zoning in high-productivity cities; subsequent revisions lowered the point estimate substantially. We use a conservative annual cost of $1.4 trillion (95% CI: $500 billion-$2 trillion).
Platonic Ideal: Japan’s Zoning System
Japan allows by-right development with minimal restrictions. National zoning law supersedes local NIMBY vetoes. Outcome? Tokyo, a city of 14 million, has stable housing costs despite population growth14. Build more houses, prices don’t spike. Obvious? Apparently not in America, where cities prefer the way things look to letting people live in them.
Tariffs: The Yale Budget Lab estimates U.S. tariffs reduce long-run GDP by 0.6%, approximately $160 billion (95% CI: $90 billion-$250 billion) annually15. Tariffs protect specific industries while raising prices for everyone else. The costs are diffuse (everyone pays more for washing machines), the benefits concentrated (appliance manufacturers lobby to keep protection). Classic public choice failure.
Detailed subsystem analysis follows in: Subsystem Audit: Regulatory and Tax Compliance, Subsystem Audit: Subsidies
System Inefficiency
Total: $1.2 trillion (90% CI: $1 trillion-$1.44 trillion) annually
This category represents fundamental design failures where the system architecture itself prevents efficiency. Not bad management-bad structure. Healthcare exemplifies this: fragmented payment systems, zero price transparency, third-party payment everywhere, perverse incentives baked into the model. The solution pathway is system redesign: change the architecture.
Components
| Component | Annual Cost | Optimal Comparison |
|---|---|---|
| Healthcare administration | Singapore model (catastrophic + HSAs) Switzerland model (regulated competition) |
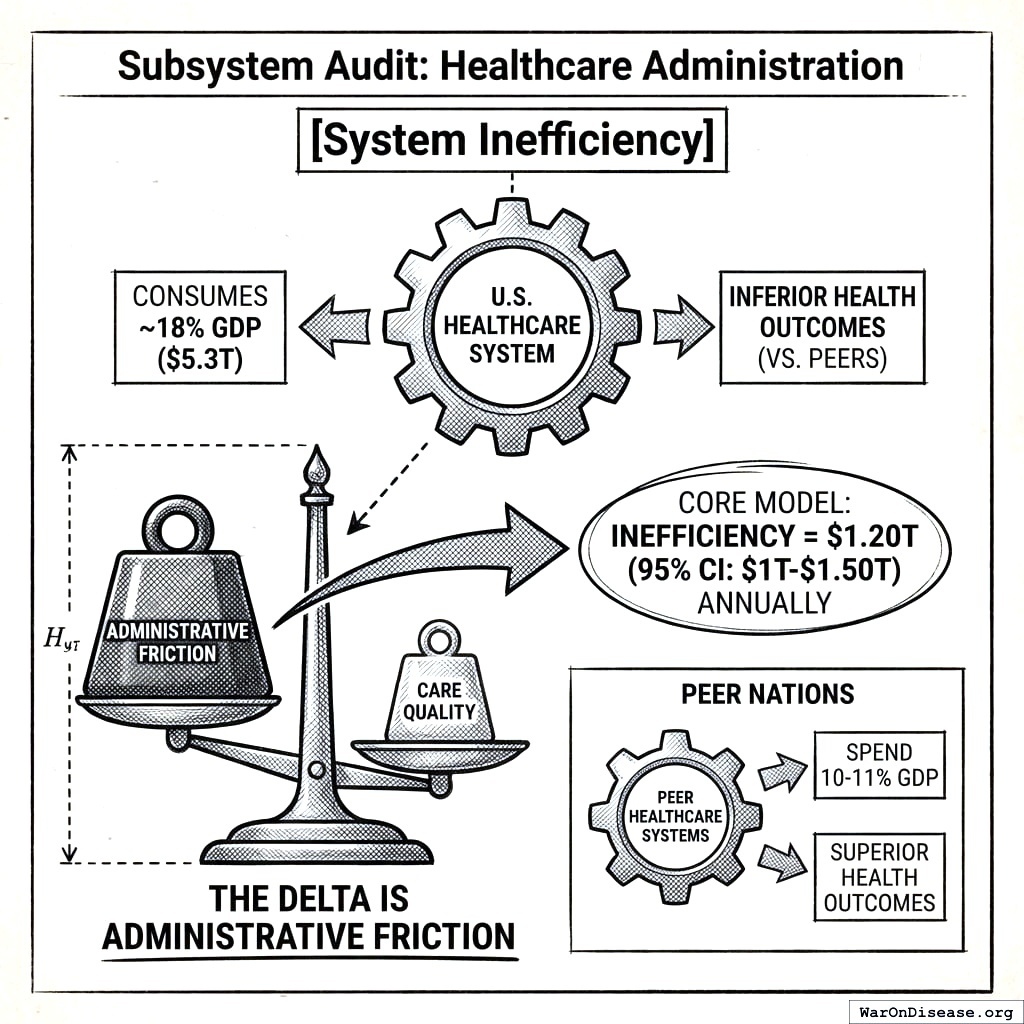
The Healthcare Labyrinth: The U.S. spends 18% of GDP on healthcare-$5.3 trillion-and gets worse outcomes than nations spending 10-11%16. The delta isn’t care quality. It’s administrative friction: billing complexity, fragmented systems, no price transparency.
Why This is System Inefficiency, Not Direct Spending Waste: Healthcare’s $1.2 trillion (95% CI: $1 trillion-$1.5 trillion) waste isn’t federal spending that could be reallocated. It’s private spending (55% of total healthcare) flowing through a systemically broken structure. You can’t “budget reallocate” your way out of third-party payment incentive problems.
Platonic Ideals: Singapore and Switzerland
Singapore (most cost-efficient): Catastrophic coverage (government) + mandatory Health Savings Accounts (individual) + full price transparency. Patients pay directly for routine care, see real prices, make cost-conscious decisions. Government covers disasters. Result: 4-5% of GDP on healthcare, outcomes matching or beating the U.S.17
Switzerland (more politically feasible): Universal coverage through regulated private competition. Citizens choose insurers annually. Real price signals. Insurers compete on efficiency. Result: 11.8% of GDP (2023), excellent outcomes18.
Singapore is clearly superior on cost-efficiency (4-5% vs 11.8% of GDP), both achieving comparable health outcomes. But Switzerland’s model may be more politically viable in Western democracies-it’s closer to existing insurance systems, just with actual competition and price transparency.
Both systems use competitive market mechanisms rather than single-payer rationing. The U.S. has neither competition nor single-payer-we have the worst of both: third-party payment hiding prices, employer-based insurance trapping workers, no cost transparency anywhere.
Singapore spends less than half what Switzerland does (as percentage of GDP) while achieving similar outcomes. That’s the optimal target. Switzerland demonstrates you can achieve excellent outcomes at 11.8% of GDP with private competition-still 35% cheaper than America’s 18%.
Detailed subsystem analysis follows in: Subsystem Audit: Healthcare Administration
Subsystem Cross-Reference
The following subsystem audits provide detailed component breakdowns. Each subsystem maps to one or more dysfunction categories:
| Subsystem | Primary Category | Components |
|---|---|---|
| Defense | Direct Spending Waste | Military overspend ($702 billion (90% CI: $671 billion-$728 billion)) |
| Healthcare Administration | System Inefficiency | Healthcare system waste ($1.2 trillion (95% CI: $1 trillion-$1.5 trillion)) |
| Justice and Prohibition | Direct Spending Waste | Drug war ($90 billion (95% CI: $60 billion-$150 billion)) |
| Regulatory and Tax Compliance | Compliance Burden + Policy-Induced GDP Loss | Tax compliance ($546 billion (95% CI: $450 billion-$650 billion)), Regulatory red tape ($580 billion (95% CI: $290 billion-$1 trillion)), Housing/zoning ($1.4 trillion (95% CI: $500 billion-$2 trillion)) |
| Subsidies and Transfers | Direct Spending Waste + Policy-Induced GDP Loss | Corporate welfare ($181 billion (95% CI: $150 billion-$220 billion)), Fossil fuel subsidies ($50 billion (95% CI: $30 billion-$80 billion)), Agricultural subsidies ($75 billion (95% CI: $50 billion-$120 billion)), Tariffs ($160 billion (95% CI: $90 billion-$250 billion)) |
Subsystem Audit: Defense
In the core model, defense contributes $702 billion (90% CI: $671 billion-$728 billion) annually through military overspend above the first-principles homeland-defense baseline of $184 billion (90% CI: $158 billion-$215 billion). The Department of Defense operates as the largest discretionary expenditure node, with annual spending of approximately $900 billion19. Current spending exceeds the next nine nations combined20.
Loss Category: Leakage (Audit Failure)
In November 2024, the Pentagon failed its seventh consecutive audit21. The DoD was unable to account for 61-63% of its $3.8 trillion in assets (dollar-weighted)22, approximately $2.5 trillion in property, equipment, and inventory with unknown location, condition, or existence status.
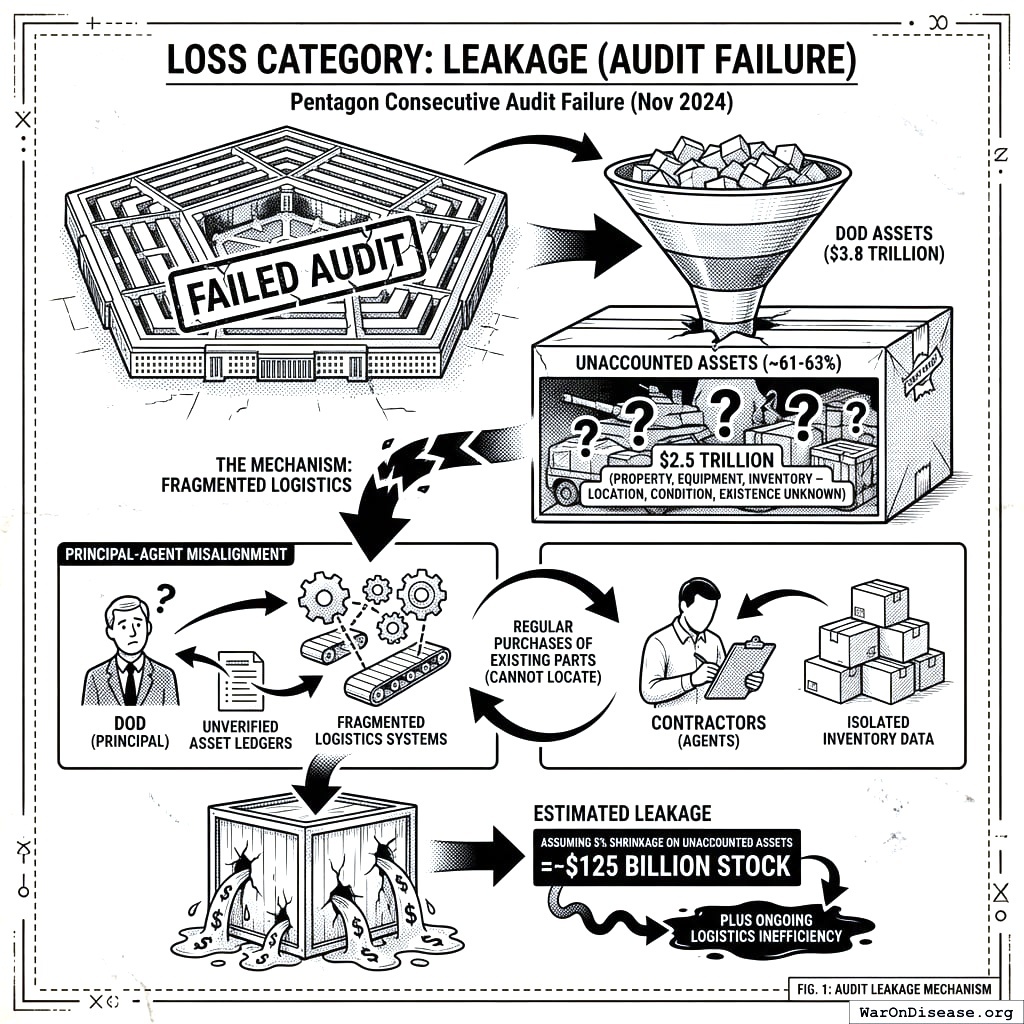
The mechanism: fragmented logistics systems where contractors record inventory data, creating principal-agent misalignment23. Without verified asset ledgers, the DoD regularly purchases parts it already owns but cannot locate.
Estimated leakage: Assuming 5% inventory shrinkage on unaccounted assets = $125 billion stock, plus ongoing logistics inefficiency.
Loss Category: Conversion Inefficiency (F-35 Program)
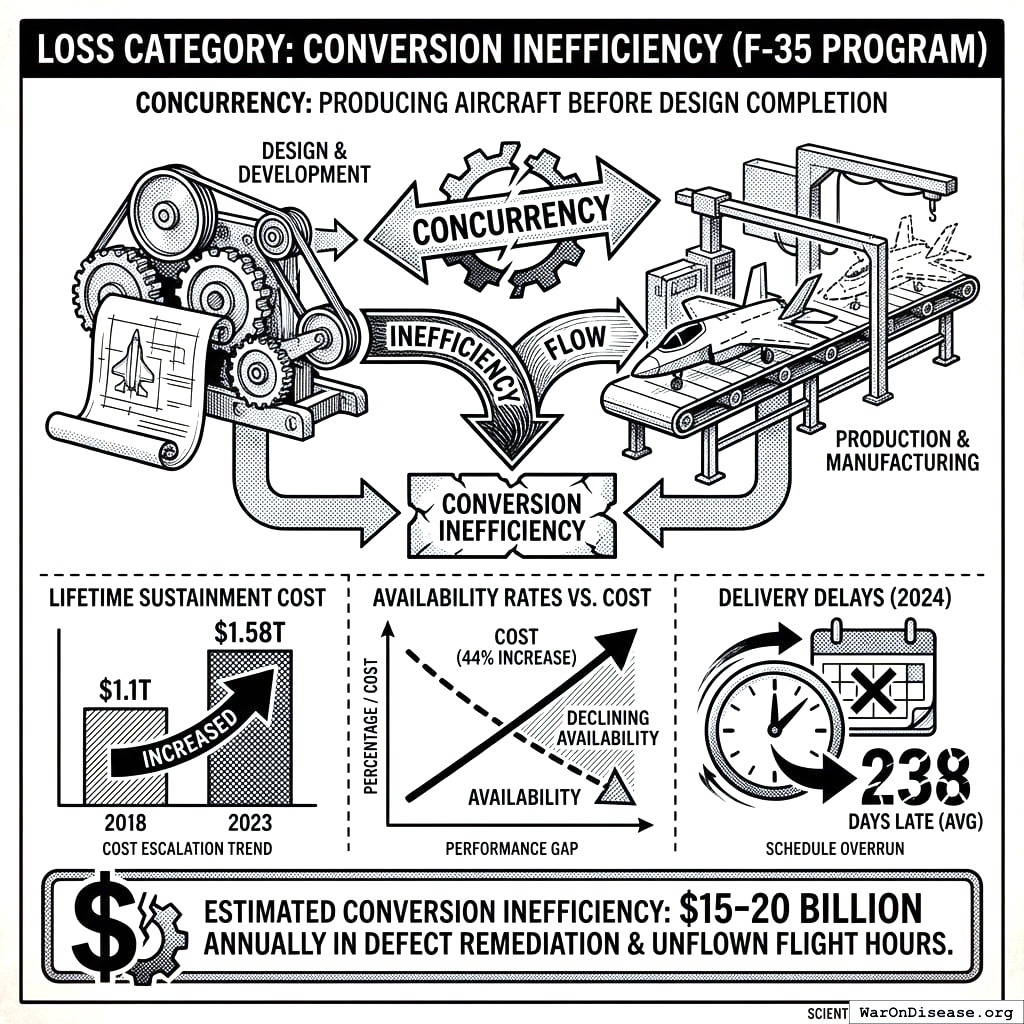
The F-35 program exemplifies “concurrency”: producing aircraft before design completion. Results:
- Lifetime sustainment cost: increased from $1.1T (2018) to $1.58T (2023)24
- Availability rates: declining despite 44% cost increase24
- 2024 delivery delays: average 238 days late25
Estimated conversion inefficiency: $15-20 billion annually in defect remediation and unflown flight hours.
Loss Category: Idle/Standby (Overseas Basing)
The U.S. maintains approximately 750 military bases in over 80 countries9, architecture designed for 1945 geopolitics.
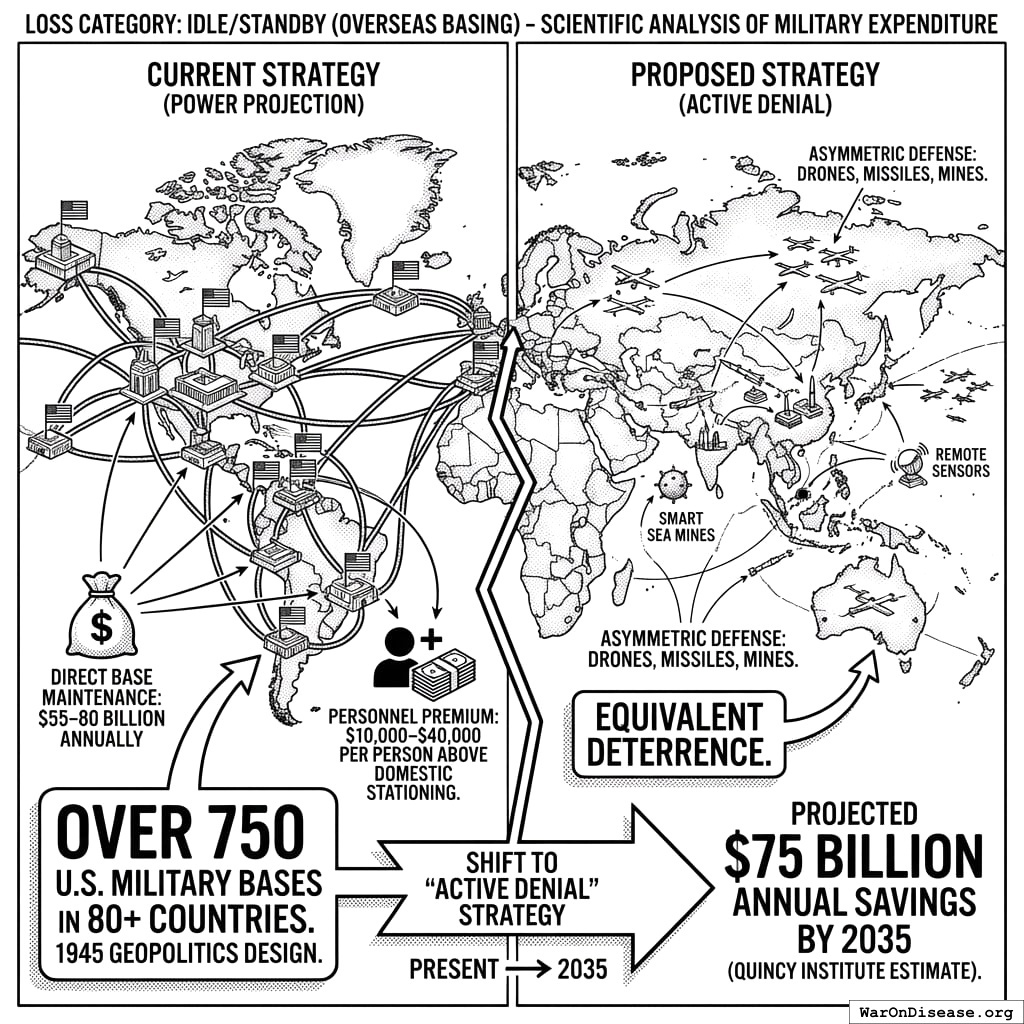
- Direct base maintenance: $55-80 billion annually9
- Personnel premium: $10,000-$40,000 per person above domestic stationing26
The Quincy Institute estimates that shifting to “Active Denial” strategy (denial-based deterrence via drones, missiles, mines rather than power projection platforms) could achieve equivalent deterrence at $75 billion annual savings by 203527.
Loss Category: Parasitic (Strategic Misalignment)
The “Overmatch” doctrine requires dominance in every theater simultaneously, creating unlimited spending requirements. The Congressional Budget Office projects defense costs will rise to $965 billion by 203928, driven by this refusal to rationalize legacy commitments. A rational optimization would focus on:
- Robust nuclear deterrent (submarine-based leg sufficient)
- Naval denial capabilities
- Denial-based deterrence posture
Cutting the redundant ICBM leg and reducing bomber procurement would save $15-20 billion annually29.
Defense Subsystem Summary
| Measure | Value |
|---|---|
| Core modeled defense contribution |
The mechanism-specific estimates above (audit leakage, F-35 conversion losses, overseas basing, strategic misalignment) explain drivers of this overspend and should not be added as separate totals.
Subsystem Audit: Healthcare Administration
In the core model, healthcare system inefficiency contributes $1.2 trillion (95% CI: $1 trillion-$1.5 trillion) annually. U.S. healthcare consumes ~18% of GDP ($5.3 trillion)30 yet delivers health outcomes inferior to peer nations spending 10-11% of GDP16. The delta is not care quality. It is administrative friction.
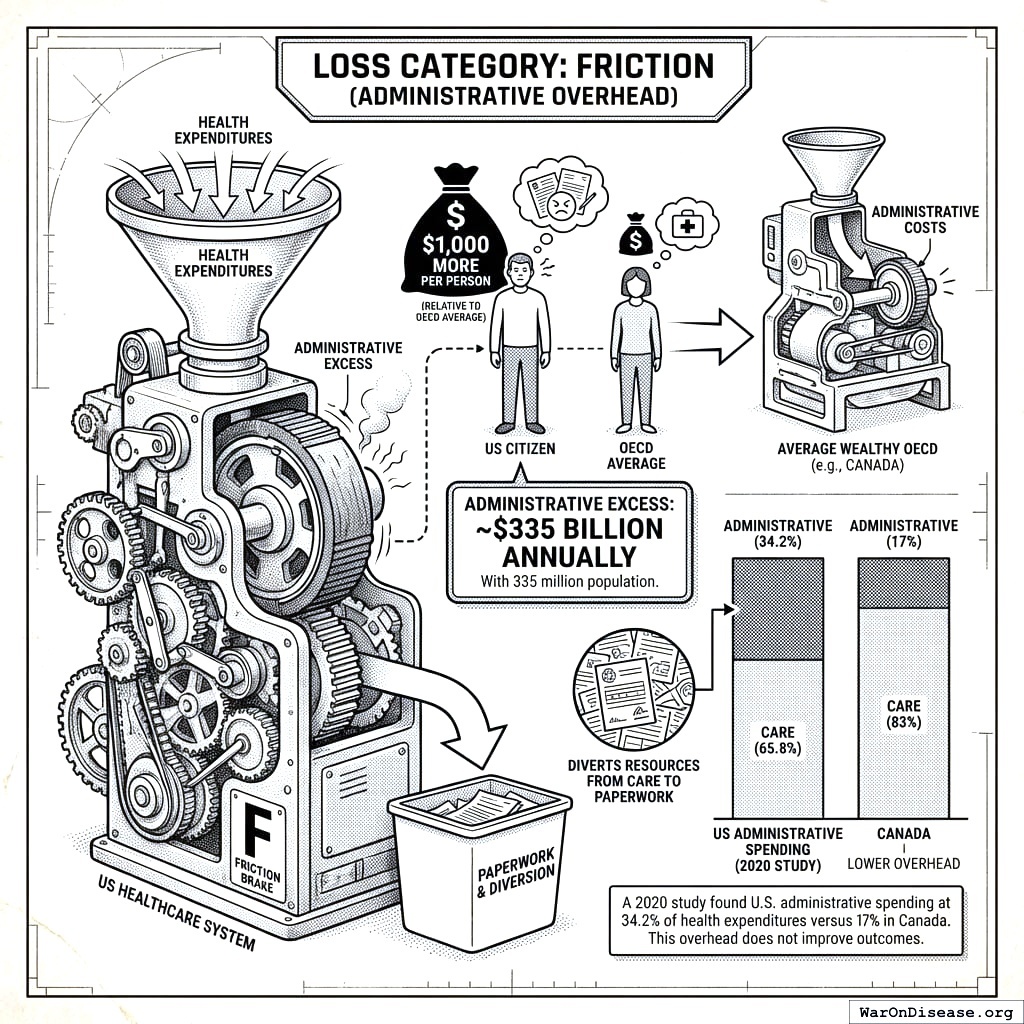
Loss Category: Friction (Administrative Overhead)
The U.S. spends approximately $1,000 more per person on administrative costs than the average wealthy OECD country16. With 335 million population:
Administrative excess: ~$335 billion annually
A 2020 study found U.S. administrative spending at 34.2% of health expenditures versus 17% in Canada31. This overhead does not improve outcomes. It diverts resources from care to paperwork.
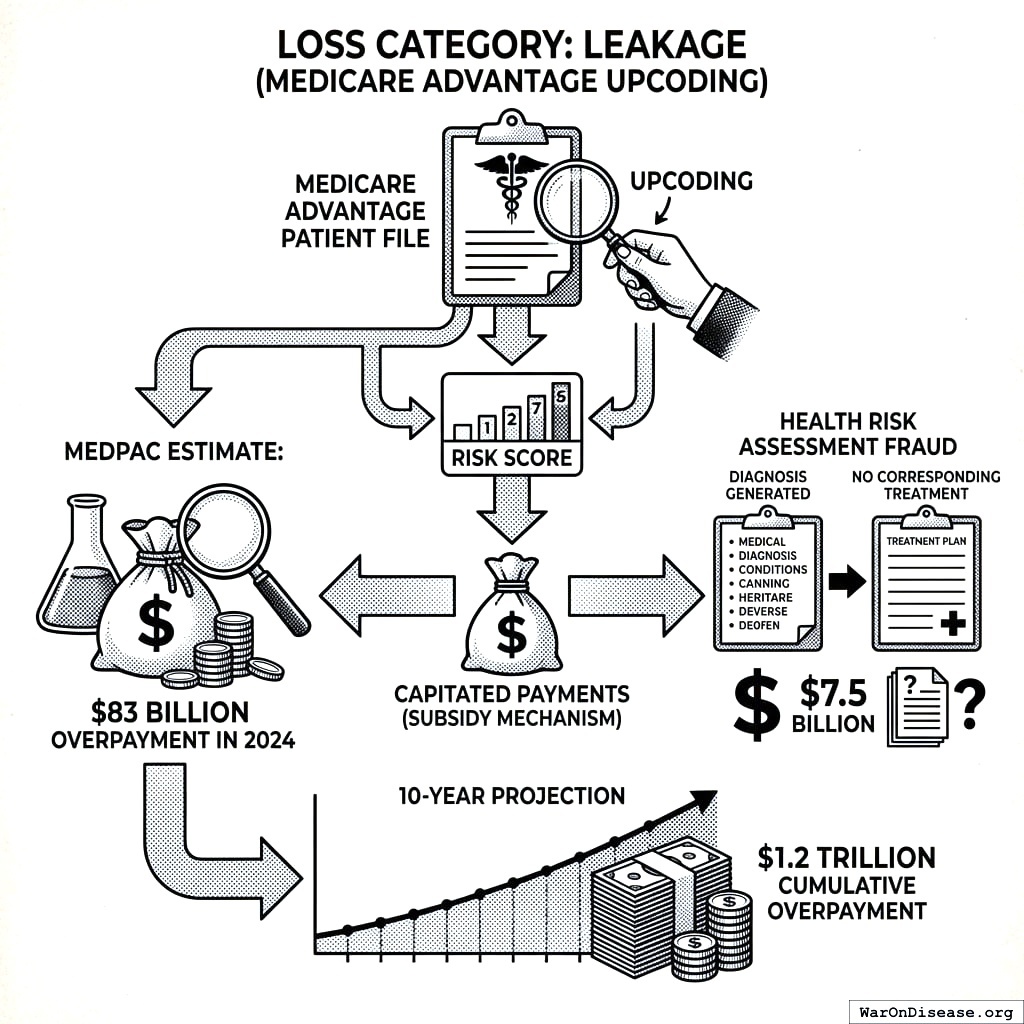
Loss Category: Leakage (Medicare Advantage Upcoding)
Medicare Advantage functions as a subsidy mechanism via “upcoding”: making patients appear sicker than they are to increase capitated payments.
Loss Category: Leakage (Improper Payments)
GAO estimates $162 billion in improper payments government-wide in 2024, with 75% concentrated in Medicare and Medicaid35.
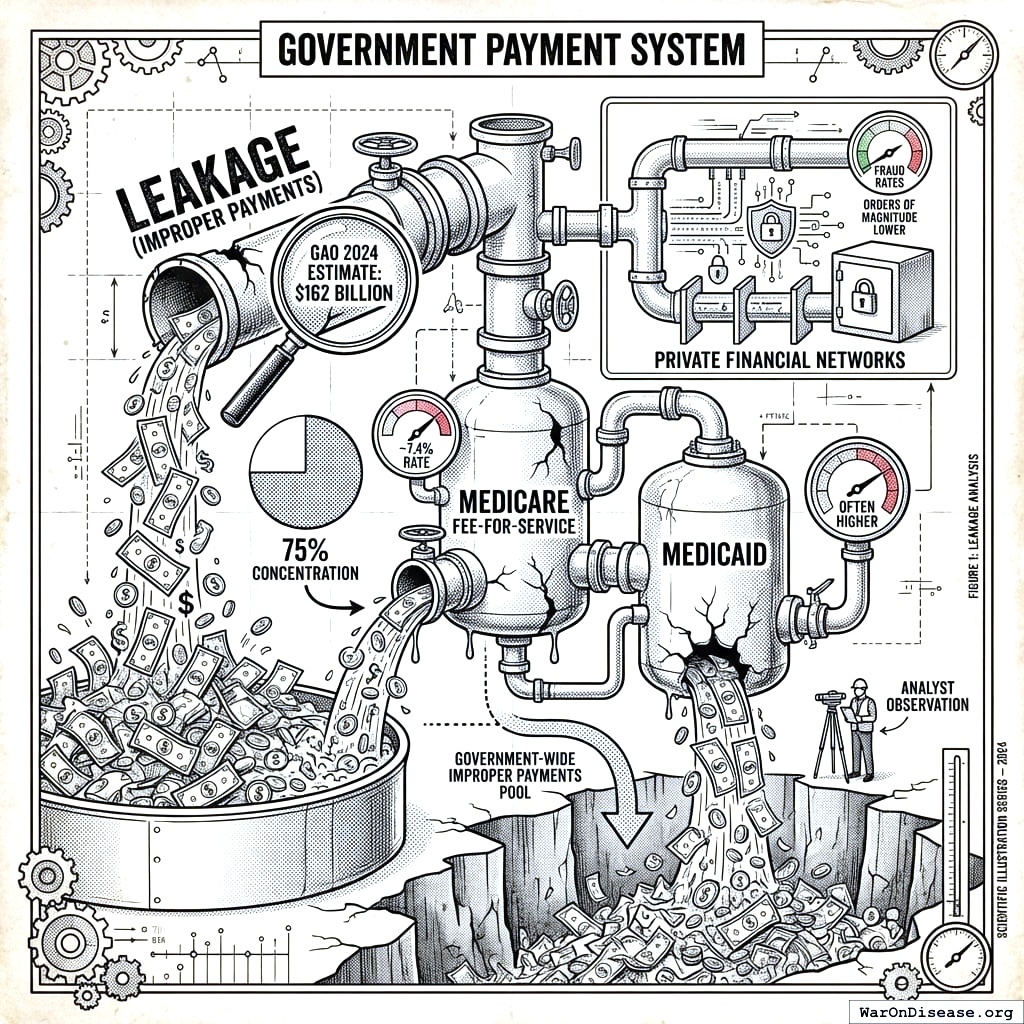
- Medicare Fee-for-Service: ~7.4% improper payment rate
- Medicaid: often higher
Private financial networks operate with fraud rates orders of magnitude lower.
Healthcare Subsystem Summary
| Measure | Value |
|---|---|
| Core modeled healthcare inefficiency |
The administrative and payment-fraud estimates above are key mechanisms within this broader system-level inefficiency.
Subsystem Audit: Justice and Prohibition
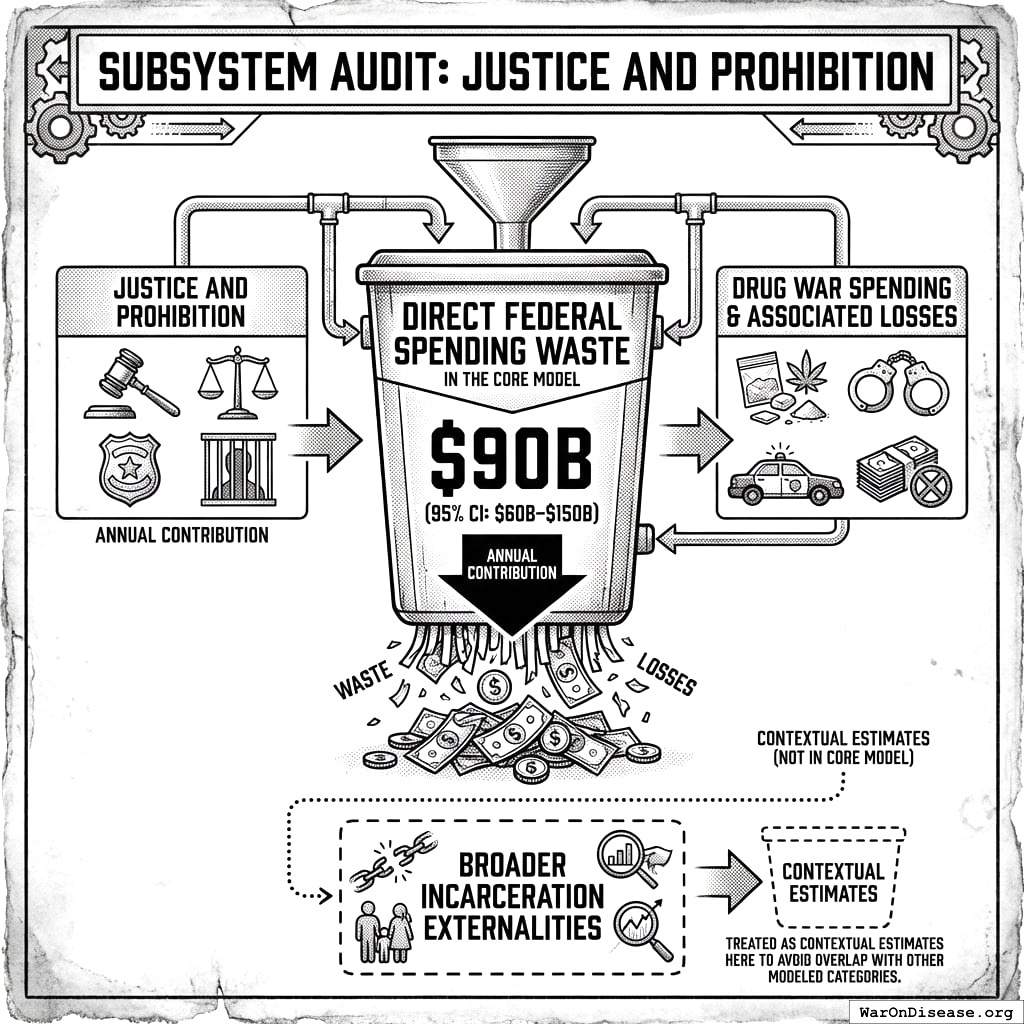
In the core model, justice and prohibition contribute $90 billion (95% CI: $60 billion-$150 billion) annually through direct drug war spending and associated direct losses. Broader incarceration externalities remain substantial but are treated as contextual estimates here to avoid overlap with other modeled categories.
Loss Category: Conversion Inefficiency (Drug Prohibition)
The federal drug control budget for 2024: nearly $45 billion36. Total expenditure since 1971: over $1 trillion37.
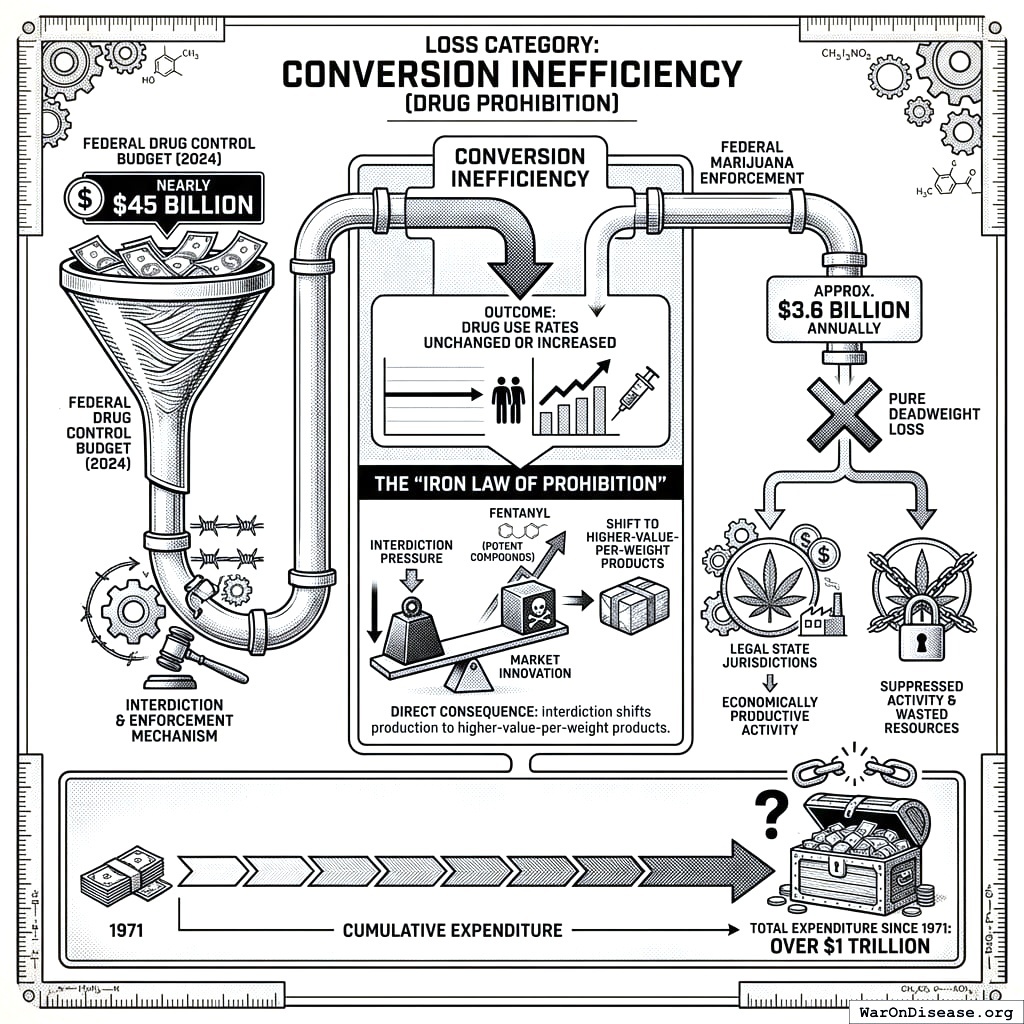
Outcome: Drug use rates unchanged or increased38. The market has innovated toward more potent compounds (fentanyl). This is a direct consequence of the “Iron Law of Prohibition,” where interdiction shifts production to higher-value-per-weight products.
Despite state legalization, federal marijuana enforcement continues at approximately $3.6 billion annually39, pure deadweight loss on activity that is economically productive in legal jurisdictions.
Loss Category: Negative Work (Mass Incarceration)
The U.S. incarcerates at rates unmatched in the developed world, removing prime-age workers from the labor force and degrading human capital.
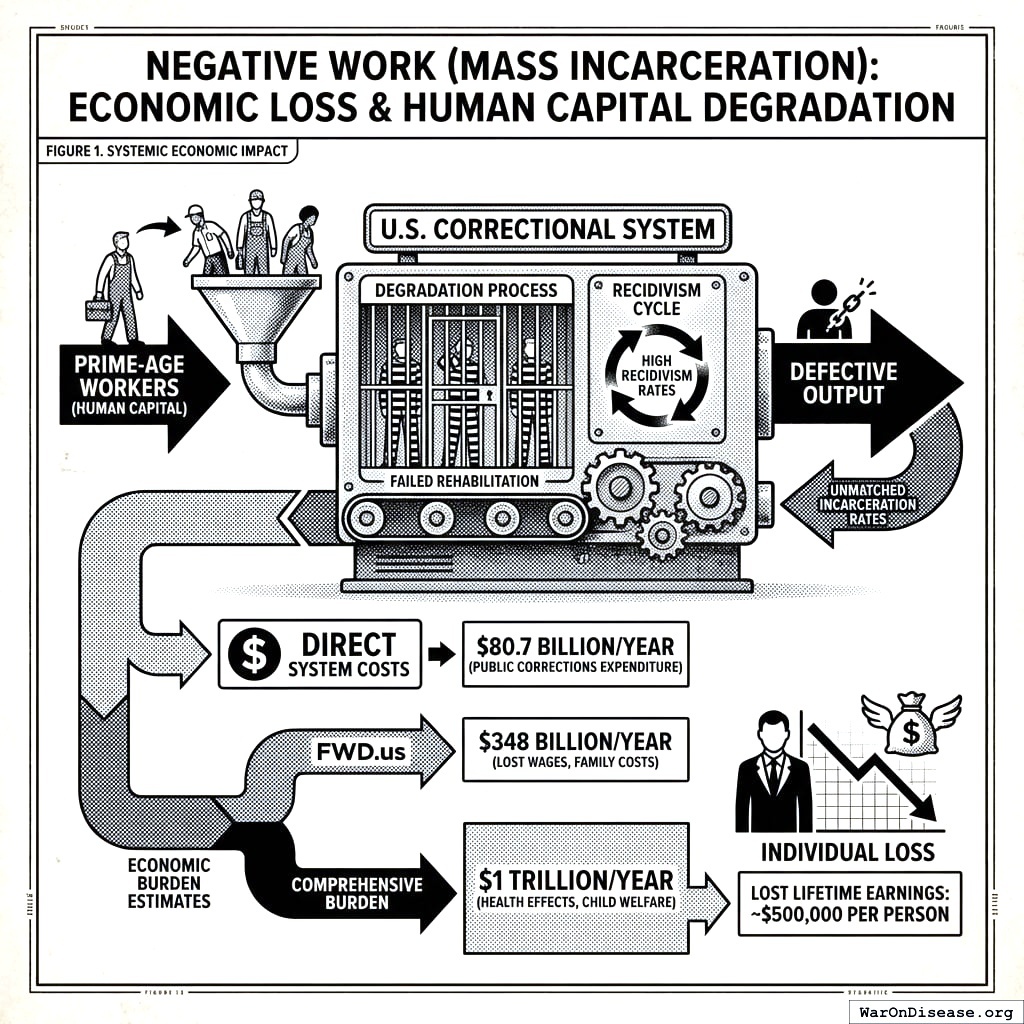
Direct system costs: $80.7 billion in public corrections expenditure40
Economic burden estimates:
- FWD.us: $348 billion annually (lost wages, family costs)41
- Comprehensive burden (including health effects, child welfare): $1 trillion annually42
Lost lifetime earnings per incarcerated person: approximately $500,00040. The system fails at rehabilitation. High recidivism rates mean the “correctional” investment yields defective output.
Loss Category: Leakage (Civil Asset Forfeiture)
Civil asset forfeiture allows property seizure without criminal conviction. FY 2024 Treasury Forfeiture Fund: $2.26 billion processed43.
This mechanism incentivizes revenue-generating enforcement over public safety, introduces property rights uncertainty, and constitutes wealth transfer from productive activity to bureaucracy.
Justice Subsystem Summary
| Measure | Value |
|---|---|
| Core modeled justice/prohibition contribution |
Note: The incarceration burden estimates above reflect broader societal externalities and are presented as contextual evidence rather than additive components in the core aggregate model.
Subsystem Audit: Regulatory and Tax Compliance
[Compliance Burden + Policy-Induced GDP Loss]
In the core model, this subsystem maps to three major components: tax compliance ($546 billion (95% CI: $450 billion-$650 billion)), regulatory red tape ($580 billion (95% CI: $290 billion-$1 trillion)), and housing/zoning misallocation ($1.4 trillion (95% CI: $500 billion-$2 trillion)). Together they represent a substantial unrecorded subtraction from national output.
Loss Category: Friction (Tax Compliance)
Americans spend 7.1-7.9 billion hours annually complying with the tax code7.
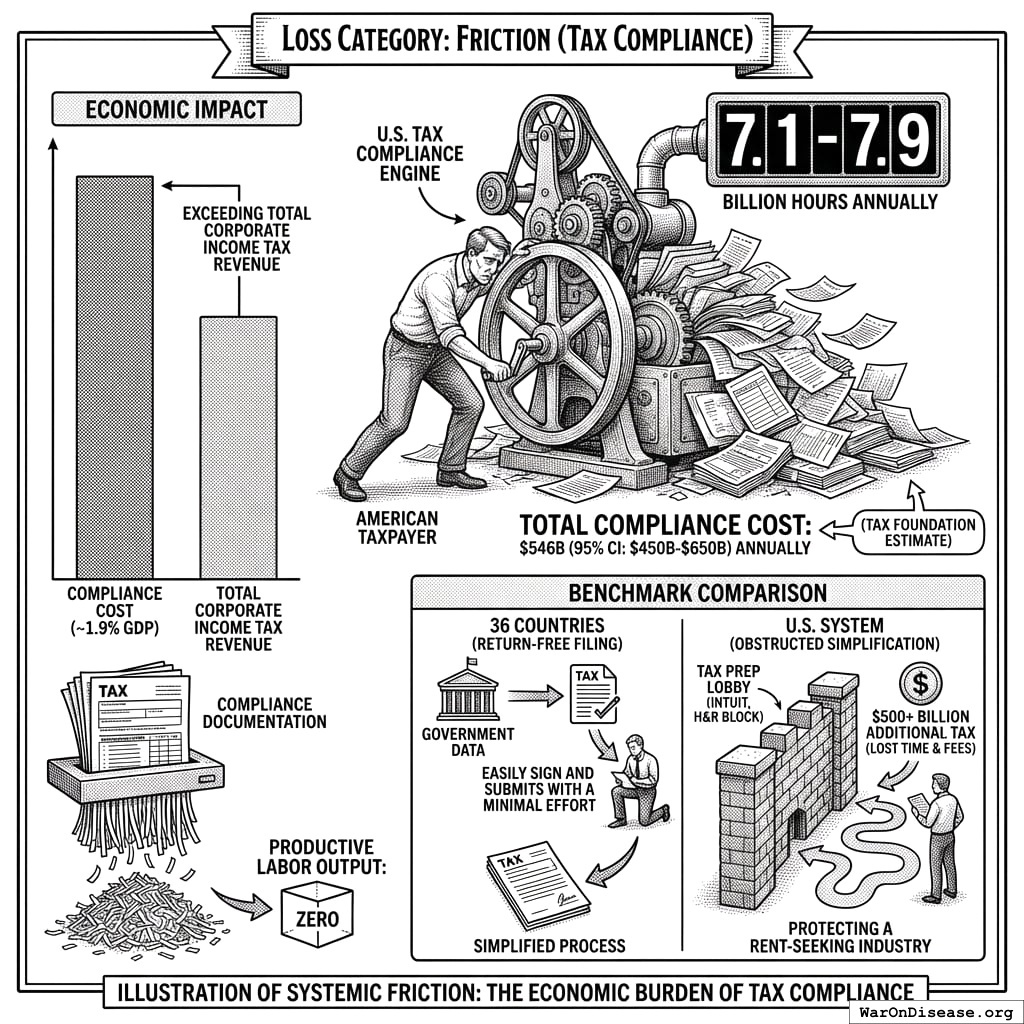
Total compliance cost: $546 billion (95% CI: $450 billion-$650 billion) annually (Tax Foundation estimate)7,8
This is approximately 1.9% of GDP, exceeding total corporate income tax revenue. The labor produces nothing but compliance documentation.
Benchmark comparison: Thirty-six countries use “Return-Free Filing” where governments pre-fill returns with data already in their possession44. The U.S. tax preparation lobby (Intuit, H&R Block) has successfully lobbied to prevent this simplification45, effectively taxing Americans an additional $500+ billion in lost time and fees to protect a rent-seeking industry.
Loss Category: Friction (Housing/Zoning Misallocation)
Local zoning regulations artificially restrict housing supply in high-productivity cities, preventing labor mobility to productive clusters.
Spatial misallocation cost: Moderate estimates imply losses on the order of $1.4 trillion (95% CI: $500 billion-$2 trillion) annually46,47. The full range spans $500B to $2T depending on modeling assumptions.
Note: The original Hsieh-Moretti (2019) estimate of 36% GDP growth reduction was substantially revised downward by Greaney (2023). The figure used here reflects a moderate annualized estimate rather than the original upper bound.
Federal policy subsidizes this dysfunction via mortgage interest deductions and infrastructure grants without upzoning requirements.
Loss Category: Idle (NEPA Permitting Delays)
The National Environmental Policy Act forces infrastructure projects into multi-year review. Average Environmental Impact Statement: 4.5 years.
Delay costs: $100-140 billion annually in lost returns and capital efficiency48.
NEPA creates a “Green Paradox”: delaying clean energy projects (transmission, wind, geothermal) more than fossil fuel projects, undermining stated policy goals.
Loss Category: Parasitic (Jones Act)
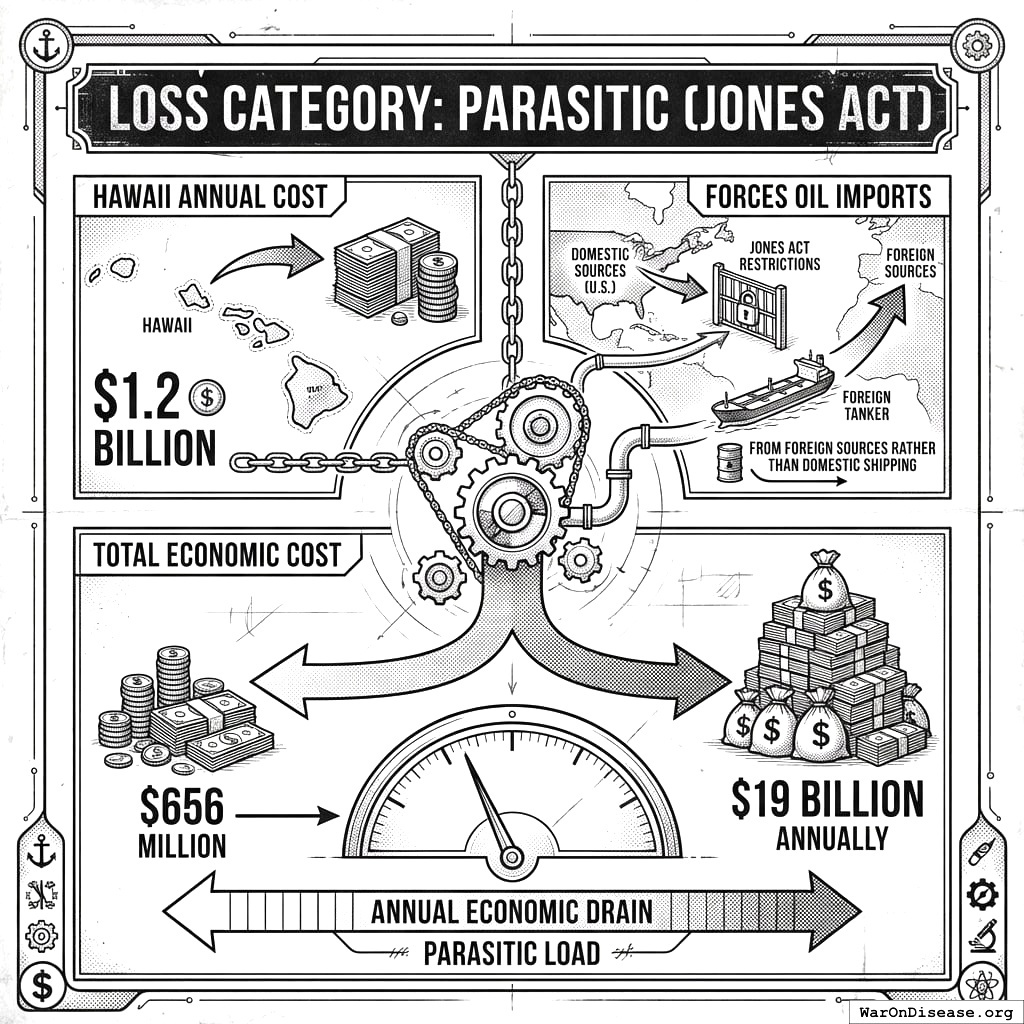
The Jones Act requires domestic shipping on U.S.-built, U.S.-crewed vessels. Results:
Regulatory Subsystem Summary
| Core Modeled Component | Value |
|---|---|
| Tax compliance | |
| Regulatory red tape | |
| Housing/zoning misallocation |
NEPA and Jones Act estimates above are additional policy frictions discussed for context and are not separately added to the core model total here.
Subsystem Audit: Subsidies and Transfers
[Direct Spending Waste + Policy-Induced GDP Loss]
In the core model, this subsystem includes corporate welfare ($181 billion (95% CI: $150 billion-$220 billion)), fossil fuel subsidies ($50 billion (95% CI: $30 billion-$80 billion)), agricultural subsidies ($75 billion (95% CI: $50 billion-$120 billion)), and tariff-related GDP loss ($160 billion (95% CI: $90 billion-$250 billion)).
Loss Category: Parasitic (Fossil Fuel Subsidies)
Direct annual subsidies to fossil fuel companies: $10-52 billion51.
This represents capital transfer to a mature, profitable industry, artificially lowering carbon-intensive energy costs relative to alternatives and slowing energy transition.
Loss Category: Parasitic (Agricultural Subsidies)
Agricultural subsidies in 2024: $9.3-30 billion52. Distribution is regressive. Top 10% of recipients received 65% of payments in 202453.
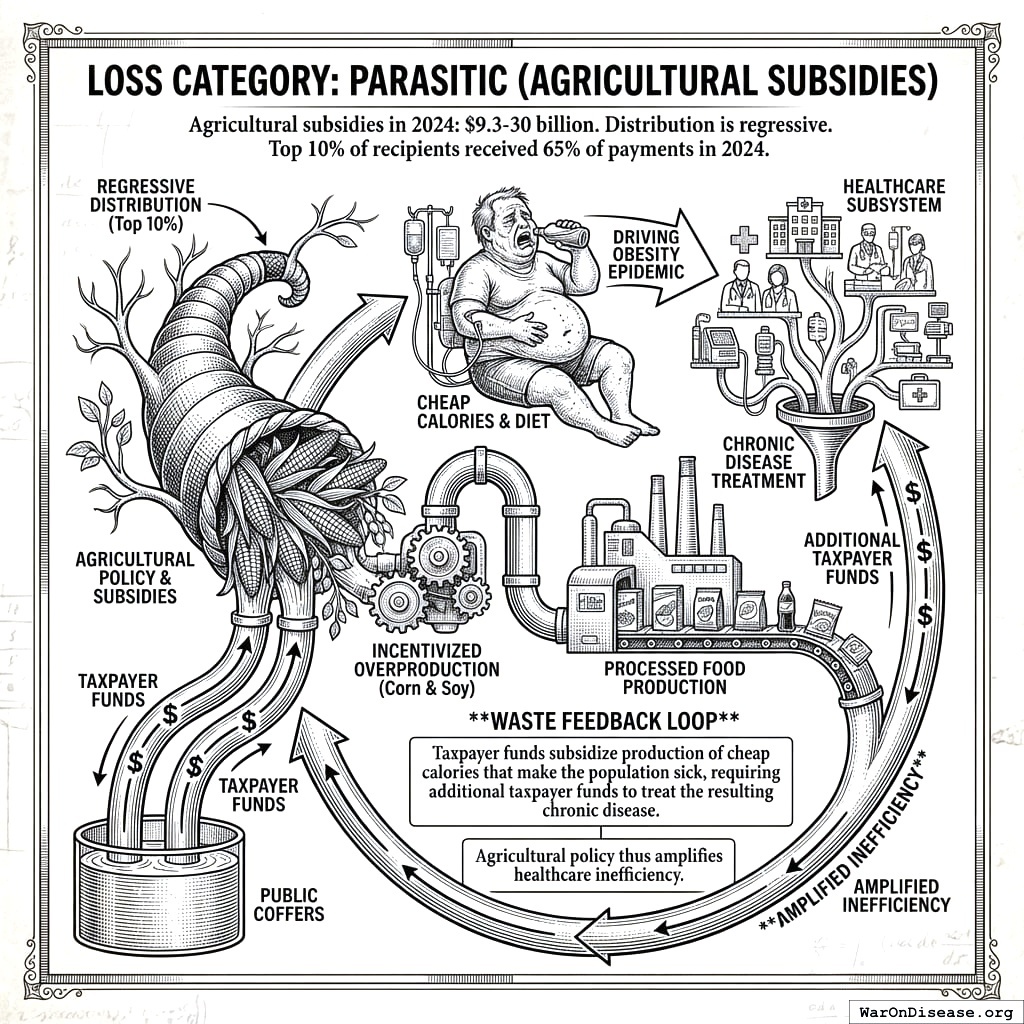
The subsidy structure incentivizes overproduction of corn and soy, which form the backbone of the processed food diet driving the obesity epidemic. This creates a Waste Feedback Loop: taxpayer funds subsidize production of cheap calories that make the population sick, requiring additional taxpayer funds to treat the resulting chronic disease (see Healthcare subsystem). Agricultural policy thus amplifies healthcare inefficiency.
Loss Category: Negative Work (Tariffs and Corporate Welfare)
Corporate welfare: Cato Institute tallies $181 billion annually in grants, loans, and credits to specific businesses54.
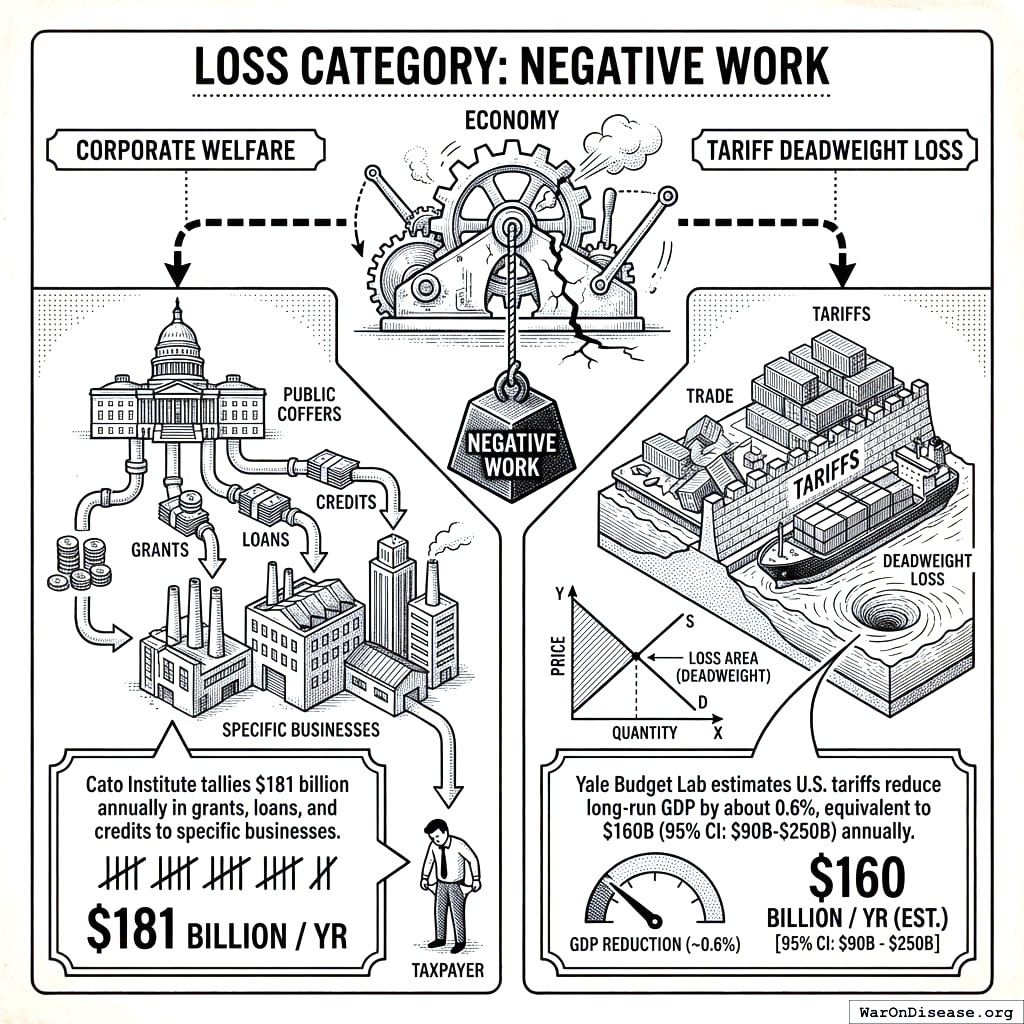
Tariff deadweight loss: Yale Budget Lab estimates U.S. tariffs reduce long-run GDP by about 0.6%, equivalent to $160 billion (95% CI: $90 billion-$250 billion) annually15.
Subsidies Subsystem Summary
| Core Modeled Component | Value |
|---|---|
| Corporate welfare | |
| Fossil fuel subsidies | |
| Agricultural subsidies | |
| Tariff-related GDP loss |
Aggregate Efficiency Calculation
Monte Carlo Simulation Parameters
We model Total Efficiency Gap as the sum of ten core components, grouped into four categories, with Monte Carlo simulation accounting for correlated uncertainties.
| Category | Mean (Model Output) | Notes |
|---|---|---|
| Direct Spending Waste | Budget allocations that can be reallocated | |
| Compliance Burden | Private-sector compliance friction | |
| Policy-Induced GDP Loss | Foregone output from policy constraints | |
| System Inefficiency | Structural design failures | |
| Total Efficiency Gap | $4.98 trillion (90% CI: $4.39 trillion-$5.61 trillion) | Aggregate modeled loss |
Simulation Results
Aggregate Efficiency Gap (FY 2024-2025):
| Percentile | Estimate |
|---|---|
| Mean (Central) |
Note: The P5-P95 confidence interval is embedded in the variable output. Category means sum to the aggregate total, with Monte Carlo simulation modeling correlated uncertainties across components.
As percentage of GDP: 17.3% (90% CI: 15.3%-19.5%)
Category Breakdown:
| Category | Annual Cost | Solution Type |
|---|---|---|
| Direct Spending Waste | Budget reallocation | |
| Compliance Burden | Simplification | |
| Policy-Induced GDP Loss | Policy reform | |
| System Inefficiency | System redesign | |
| Total | $4.98 trillion (90% CI: $4.39 trillion-$5.61 trillion) | Multiple pathways |
This breakdown clarifies that only direct spending waste represents traditional “federal budget waste” subject to reallocation. The majority reflects broader economic dysfunction requiring simplification (compliance burden), policy reform (policy-induced GDP loss), or structural redesign (system inefficiency).
Subsystem Uncertainty Distributions
The following figures show Monte Carlo distributions for key subsystem loss estimates:
This chart shows the assumed probability distribution for this parameter. The shaded region represents the 95% confidence interval where we expect the true value to fall.
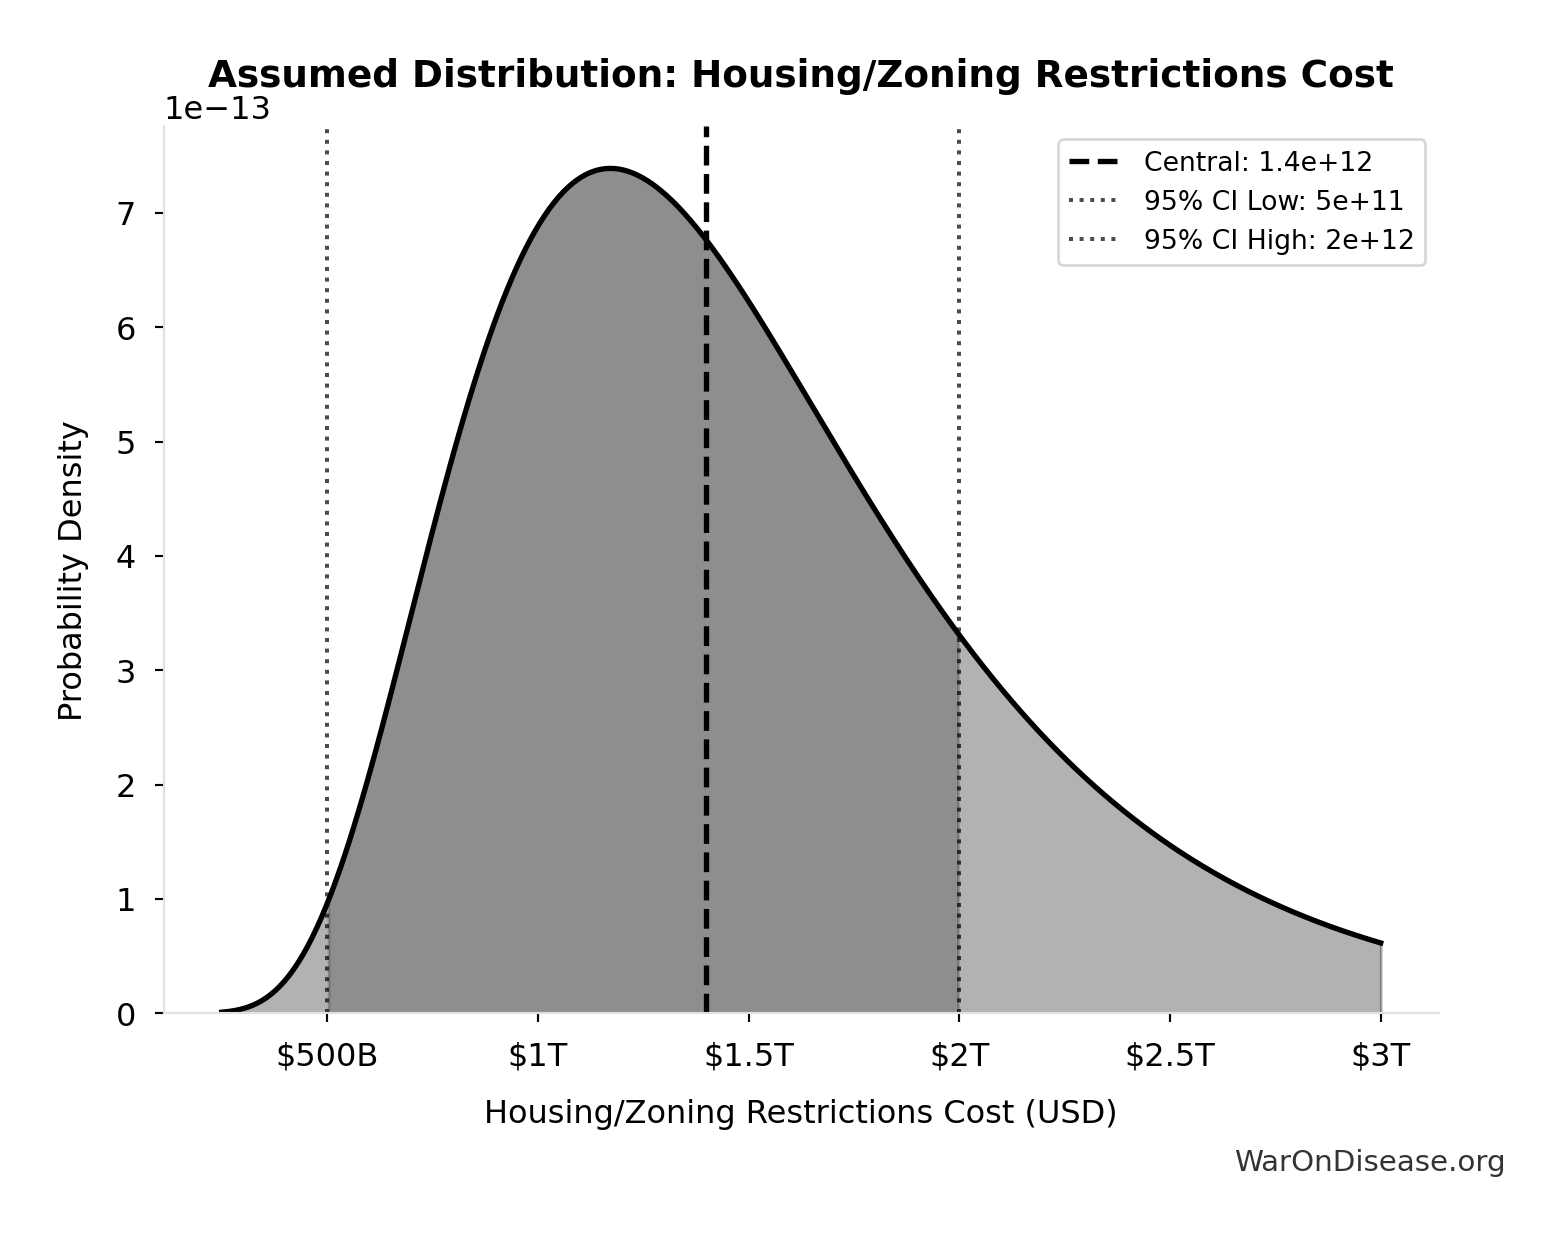
This chart shows the assumed probability distribution for this parameter. The shaded region represents the 95% confidence interval where we expect the true value to fall.
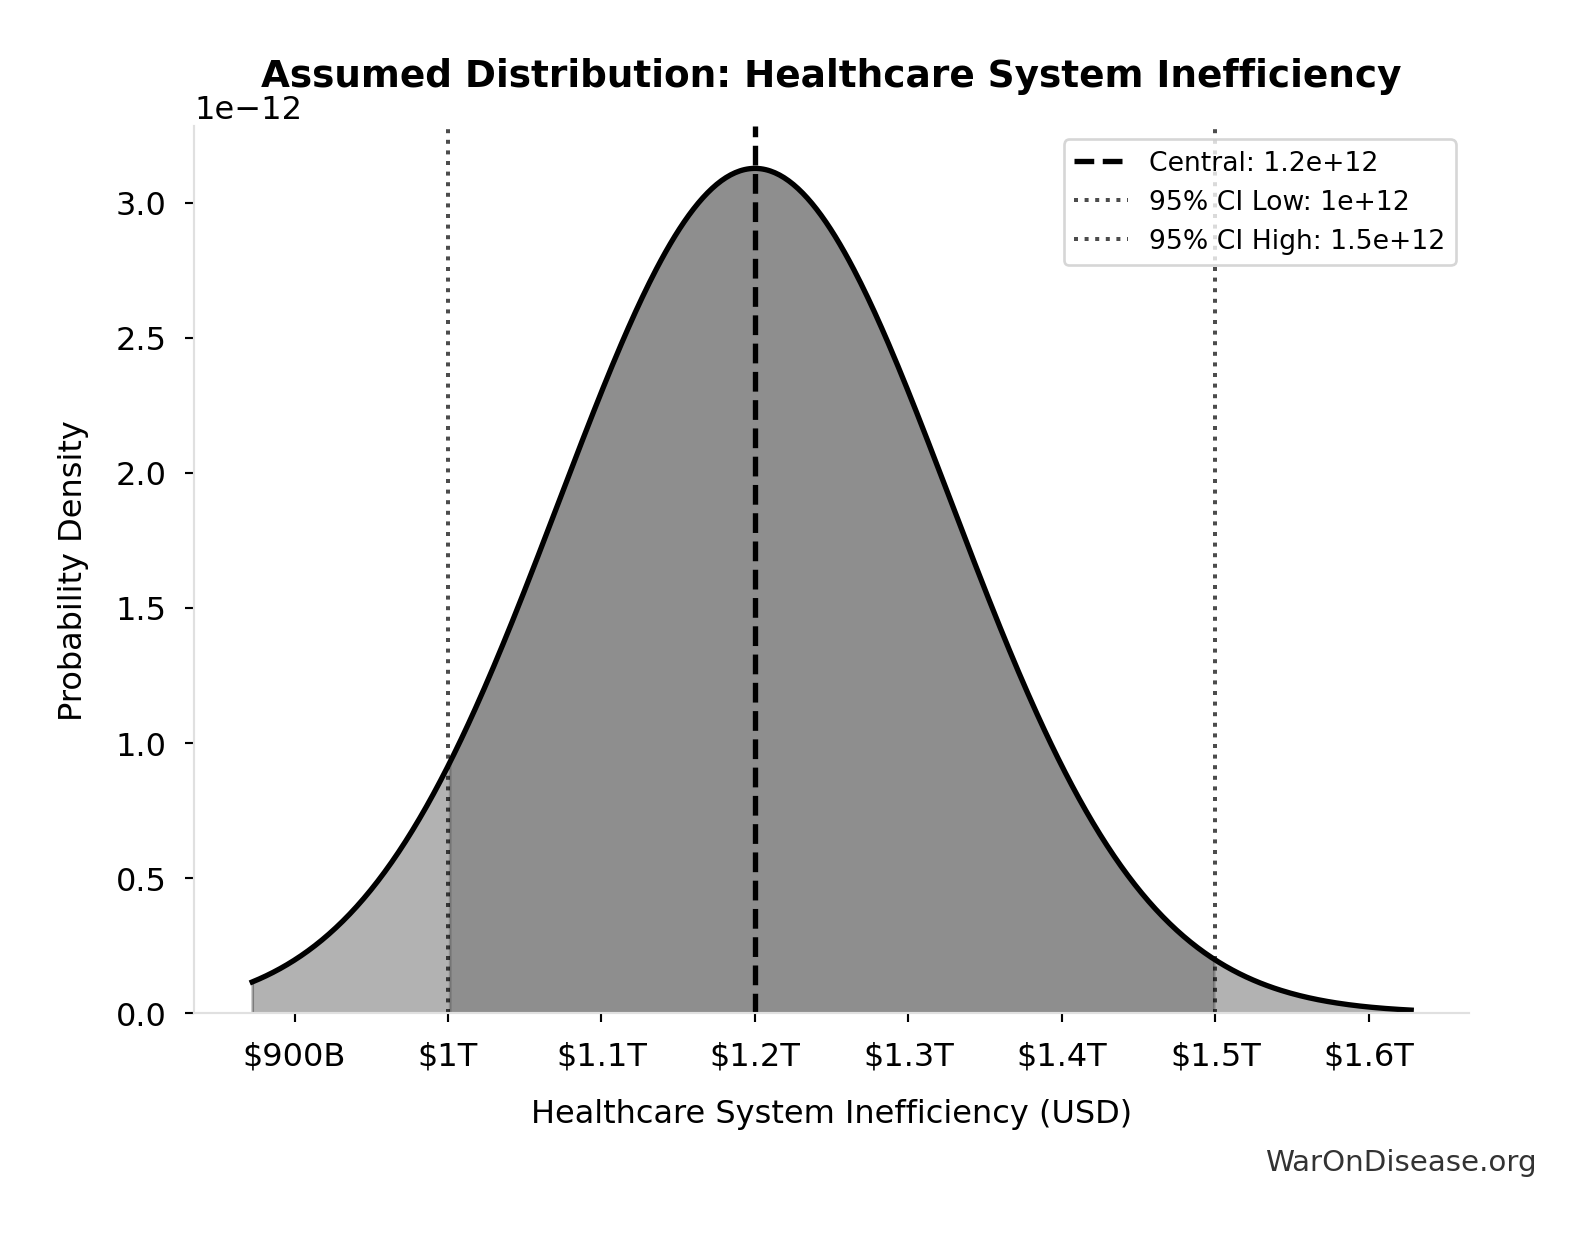
This chart shows the assumed probability distribution for this parameter. The shaded region represents the 95% confidence interval where we expect the true value to fall.
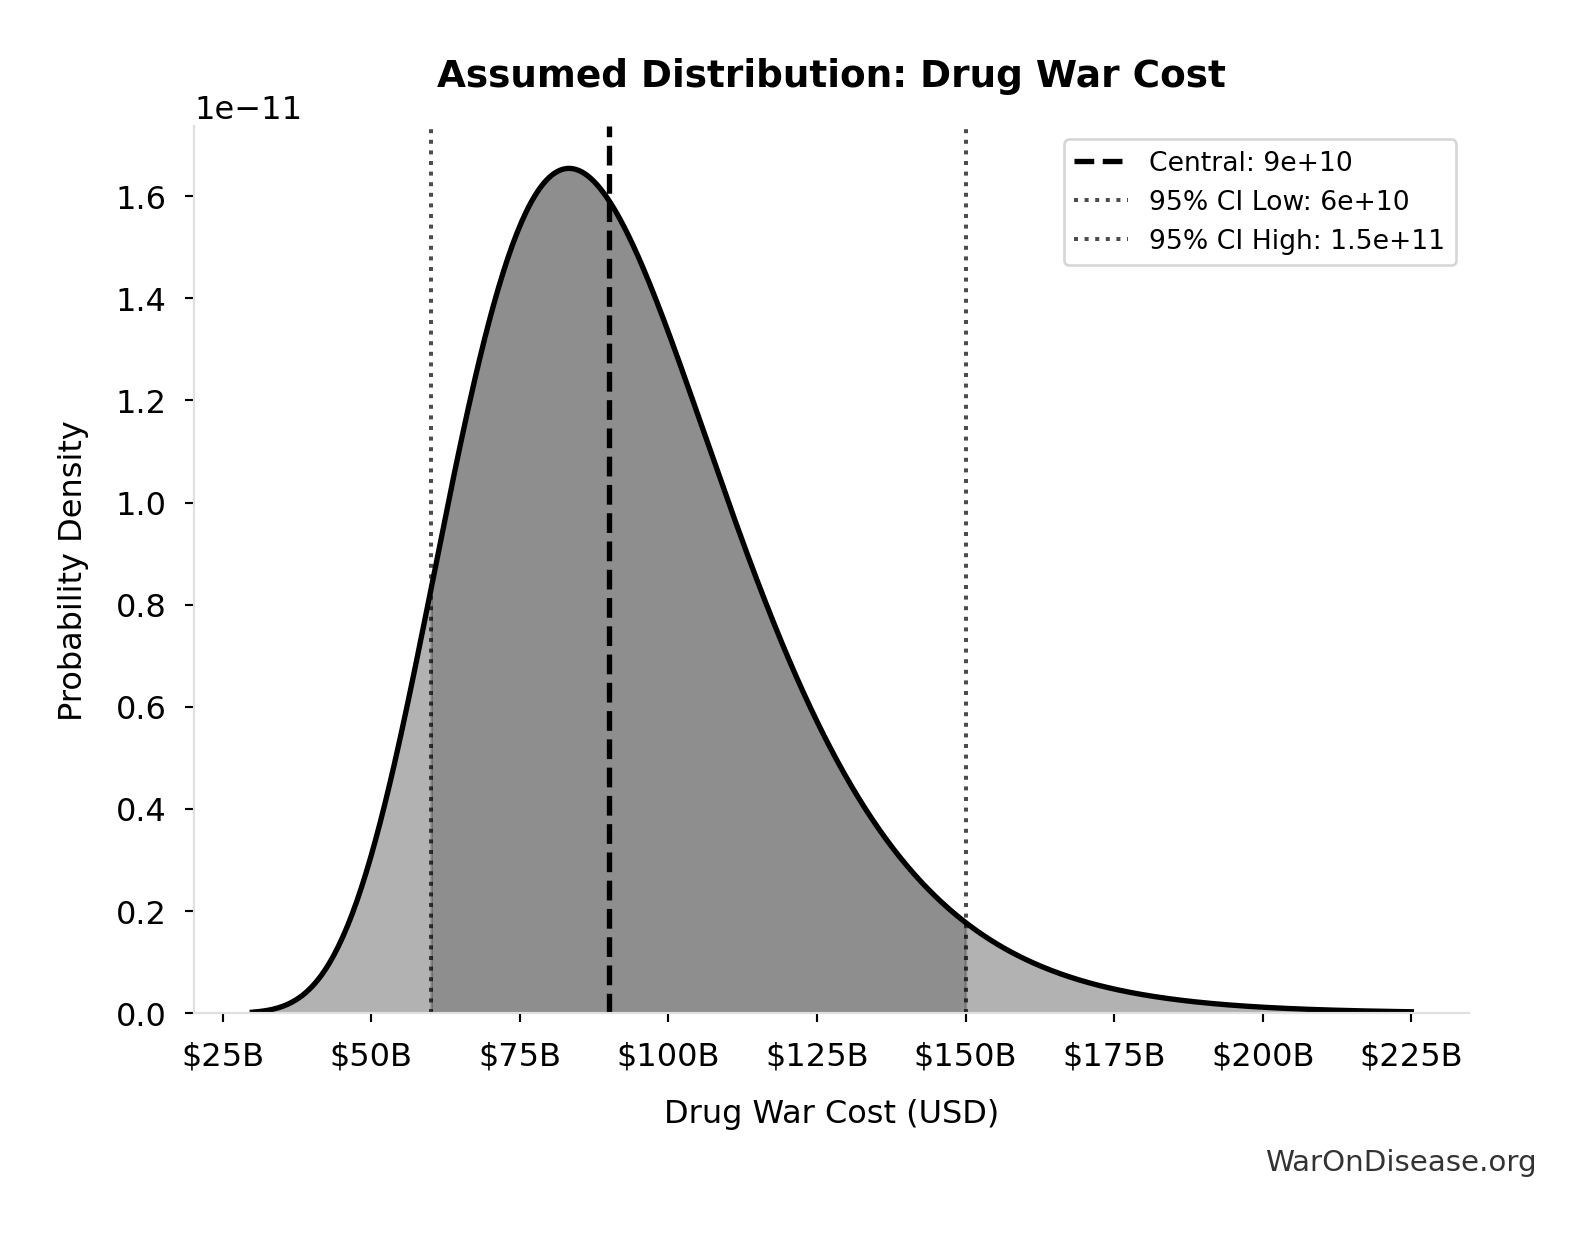
This chart shows the assumed probability distribution for this parameter. The shaded region represents the 95% confidence interval where we expect the true value to fall.
Efficiency Rating Calculation
We report two efficiency metrics using different denominators, each answering a distinct question:
Discretionary Efficiency (Cat 1 waste vs. discretionary spending): What fraction of fungible federal spending avoids direct waste?
\[
\begin{gathered}
E_{US,disc} \\
= 1 - \frac{W_{cat1}}{Spending_{US,disc}} \\
= 1 - \frac{\$1.1T}{\$1.7T} \\
= 35.4\%
\end{gathered}
\]
where:
\[
\begin{gathered}
W_{cat1} \\
= W_{military} + W_{corporate} + W_{drugs} + W_{fossil} \\
+ W_{agriculture} \\
= \$702B + \$181B + \$90B + \$50B + \$75B \\
= \$1.1T
\end{gathered}
\]
where:
\[
\begin{gathered}
W_{military} \\
= Spending_{US,2024} - D_{optimal} \\
= \$886B - \$184B \\
= \$702B
\end{gathered}
\]
where:
\[
\begin{gathered}
D_{optimal} \\
= D_{nuclear} + D_{air} + D_{cg} + D_{guard} + D_{cyber} \\
+ D_{hedge} \\
= \$30B + \$35B + \$14B + \$30B + \$15B + \$60B \\
= \$184B
\end{gathered}
\]
This metric uses discretionary spending ($1.7T) as the denominator because Cat 1 items (military overspend, corporate welfare, drug war, fossil/ag subsidies) are fungible policy choices. Some Cat 1 items (farm subsidies, tax expenditures) are technically mandatory or off-budget but represent actionable policy choices.
Governance Efficiency (total waste vs. GDP): How much of the economy is consumed by all four categories of governance dysfunction?
\[
\begin{gathered}
E_{US,GDP} \\
= 1 - \frac{W_{total,US}}{GDP_{US}} \\
= 1 - \frac{\$4.98T}{\$28.8T} \\
= 82.7\%
\end{gathered}
\]
where:
\[
\begin{gathered}
W_{total,US} \\
= W_{raw,US} \times \delta_{overlap} \\
= \$4.98T \times 1 \\
= \$4.98T
\end{gathered}
\]
where:
\[
\begin{gathered}
W_{raw,US} \\
= W_{health} + W_{housing} + W_{military} + W_{regulatory} \\
+ W_{tax} + W_{corporate} + W_{tariffs} + W_{drugs} \\
+ W_{fossil} + W_{agriculture} \\
= \$1.2T + \$1.4T + \$702B + \$580B + \$546B + \$181B + \$160B \\
+ \$90B + \$50B + \$75B \\
= \$4.98T
\end{gathered}
\]
where:
\[
\begin{gathered}
W_{military} \\
= Spending_{US,2024} - D_{optimal} \\
= \$886B - \$184B \\
= \$702B
\end{gathered}
\]
where:
\[
\begin{gathered}
D_{optimal} \\
= D_{nuclear} + D_{air} + D_{cg} + D_{guard} + D_{cyber} \\
+ D_{hedge} \\
= \$30B + \$35B + \$14B + \$30B + \$15B + \$60B \\
= \$184B
\end{gathered}
\]
This broader metric captures all dysfunction categories (direct spending waste, compliance burden, policy-induced GDP loss, system inefficiency) relative to total economic output.
OECD benchmark: Peer nations achieve comparable outcomes with discretionary waste rates of 15-25% and total governance-related losses of 5-10% of GDP.
Human Cost Quantification (Economic Equivalents)
To contextualize the efficiency gap in human terms, we apply standard valuation thresholds. These are economic equivalents, not epidemiological mortality counts.
Using VSL ($13.7 million):
VSL-Equivalents = $4.98 trillion (90% CI: $4.39 trillion-$5.61 trillion) / $13.7 million = 364 thousand people (90% CI: 320 thousand people-410 thousand people)
Using QALY threshold ($100,000):
QALY-Equivalents = $4.98 trillion (90% CI: $4.39 trillion-$5.61 trillion) / $100,000 = 49.8 million QALYs (90% CI: 43.9 million QALYs-56.1 million QALYs)
Interpretation: The efficiency gap represents foregone welfare equivalent to 49.8 million QALYs (90% CI: 43.9 million QALYs-56.1 million QALYs) annually. This does not mean 364 thousand people (90% CI: 320 thousand people-410 thousand people) die from inefficiency. Rather, the misallocated resources could have purchased health improvements of that magnitude if deployed at cost-effectiveness thresholds used in medical decision-making.
Reallocation Potential
If U.S. efficiency improved to OECD median (80%), approximately $2.49 trillion (90% CI: $2.19 trillion-$2.81 trillion) annually becomes available for reallocation. The government replacement suite is the set of machines designed to recover it category by category, each module priced against the line item it deletes ($0.896 (90% CI: $0.452-$1.62) per citizen per year of operating cost against $14,878 (90% CI: $13,110-$16,753) per citizen per year of dysfunction).
For scale, the total efficiency gap ($4.98 trillion (90% CI: $4.39 trillion-$5.61 trillion)/year) implies the following coverage estimates.
Context Comparisons
| Initiative | Cost Benchmark | Comparison to Annual Gap |
|---|---|---|
| 1% Treaty funding | 183 (90% CI: 161-206) covered | |
| Global disease R&D (current) | $150B55 | Annual gap remains multiple times larger |
| U.S. infrastructure backlog | $2.6T total56 | Comparable in scale to one year of the gap |
| Global poverty elimination | ~$175B57 | Annual gap remains multiple times larger |
| Complete grid decarbonization | $100B/year58 | Annual gap remains multiple times larger |
The efficiency gap is not abstract accounting. It represents real capacity currently unavailable for health, infrastructure, and security improvements.
Opportunity Cost in Healthy Life Years
Each dollar of wasteful spending has a concrete human cost: it could have funded pragmatic clinical trials that accelerate treatment discovery. Table 119.1 converts each waste category into DALYs that could be averted if redirected to ubiquitous pragmatic trials.
| Category | Annual Waste | x Treaty Funding |
|---|---|---|
| Housing & Zoning Restrictions | $1400B | 64.2x |
| Healthcare Inefficiency | $1200B | 55.0x |
| Military Overspend | $702B | 32.2x |
| Regulatory Red Tape | $580B | 26.6x |
| Tax Compliance Burden | $546B | 25.0x |
| Corporate Welfare | $181B | 8.3x |
| Tariffs (GDP Loss) | $160B | 7.3x |
| Drug War | $90B | 4.1x |
| Agricultural Subsidies | $75B | 3.4x |
| Fossil Fuel Subsidies | $50B | 2.3x |
| Total | $5.0T | 229x |
Structural Factors
Why do these losses persist despite apparent obviousness? Several structural factors explain system inertia:
Severed Feedback Loops
Government programs lack market feedback mechanisms. A private firm losing $210 billion annually on inefficient logistics would face bankruptcy. Federal agencies face no equivalent selection pressure.
Principal-Agent Misalignment
Those administering programs (bureaucrats, contractors) have incentives misaligned with program objectives. Contractors profit from complexity; administrators expand headcount regardless of output.
Measurement Failure
Current accounting measures expenditure, not utility. A dollar spent equals a dollar of “activity” regardless of outcome. Without output measurement, optimization is impossible.
Monopoly Dynamics
Government services typically face no competition. Without competitive pressure, innovation lags and costs inflate. This is the standard monopoly outcome.
Time Horizon Mismatch
Political cycles (2-4 years) misalign with infrastructure and policy cycles (10-30 years). Long-term efficiency investments lose to short-term visible spending.
Confidence Intervals and Limitations
Estimate Confidence by Subsystem
| Subsystem | Data Quality | Confidence |
|---|---|---|
| Healthcare Admin | High (OECD comparisons) | High |
| Tax Compliance | High (IRS data) | High |
| Defense Audit | Low (61% unaccounted) | Medium |
| Incarceration | Medium (direct costs clear, indirect estimated) | Medium |
| Housing Misallocation | Medium (model-dependent) | Medium |
| Drug War Opportunity Cost | Low (counterfactual) | Low |
What This Analysis Excludes
- State/local inefficiency beyond federal mandates
- Implicit subsidies (unpriced externalities)
- Intergenerational costs (debt burden on future)
- Second-order behavioral effects
- International competitiveness losses
- Monetary-cycle distortion and financial-crisis losses: the 2007-09 crisis alone cost an estimated $6-14 trillion59, but no honest annualization exists, so it is cited rather than summed (see the Algorithmic Monetary Authority)
Including these factors would increase the efficiency gap estimate substantially.
Methodological Limitations
- Counterfactual uncertainty: Some estimates require modeling what “would have happened” under alternative policies
- Attribution challenges: Separating federal from state/local effects
- Valuation debates: VSL and QALY thresholds vary by methodology
- Data opacity: DoD audit failures mean some estimates are necessarily imprecise
See Also
For global perspective on governance efficiency and broader opportunity costs of political dysfunction, see The Political Dysfunction Tax, which extends this analysis to estimate a Global Governance Efficiency Score of 30-52% and identifies $101 trillion in annual unrealized potential from suppressed health innovation, migration restrictions, and lead poisoning remediation delays.