The Optimal Budget Generator: A Causal Inference Protocol for Maximizing Median Health and Wealth Through Public Goods Funding
Generating Integrated Public Budget Recommendations Using Diminishing Returns Modeling and Cost-Effectiveness Analysis

Budget processes respond to lobbying intensity and historical precedent rather than causal evidence of effectiveness.
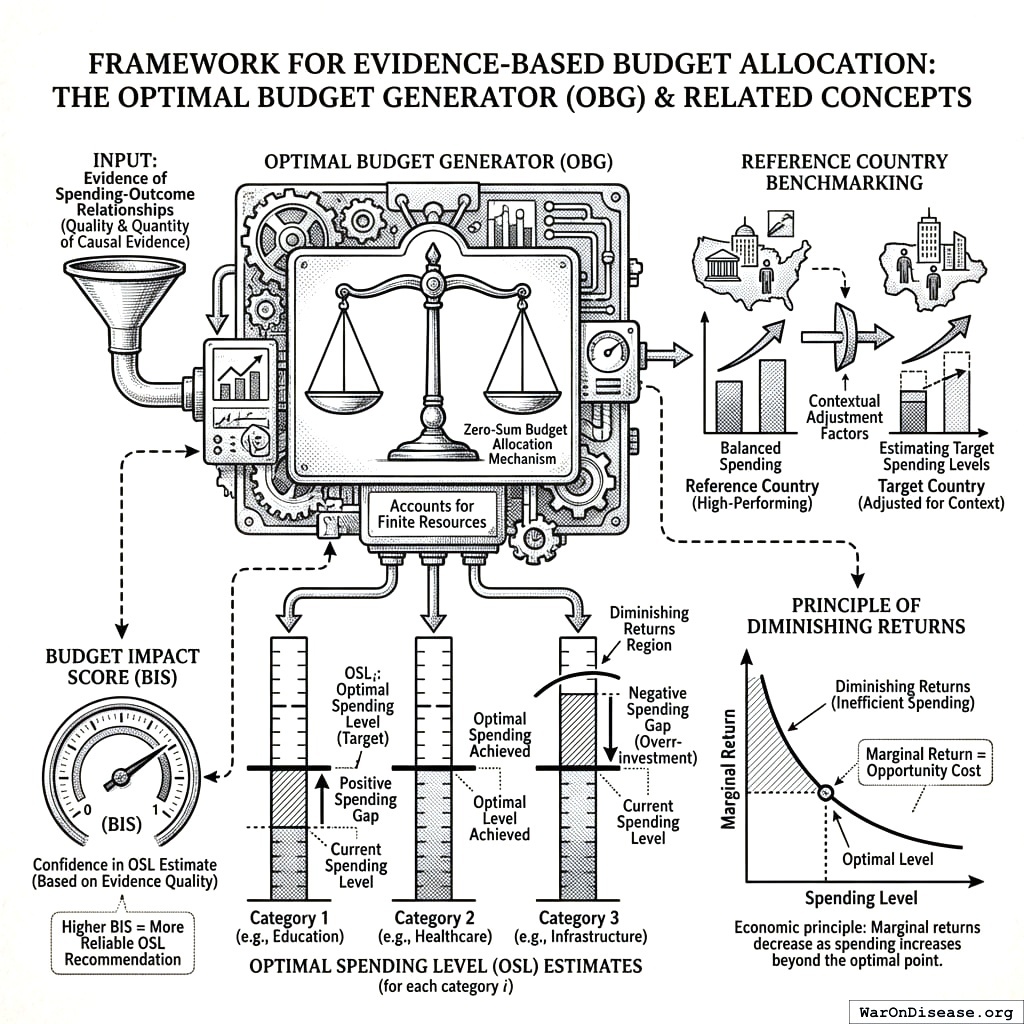
The Optimal Budget Generator (OBG) applies causal inference, diminishing returns modeling, cost-effectiveness analysis, and efficiency frontiers to choose the size and the composition of public spending that maximize two terminal general-welfare metrics: real after-tax median income growth and median healthy life years. The total budget is an output, not an input: every program must beat two outside options, a universal cash payment and leaving the money with taxpayers, so the model can recommend a smaller budget as well as a different one. For each goal, OBG compares delivery methods (public provision, vouchers, cash, prizes, payment for results) against cash and estimates an Optimal Spending Level (OSL) identifying where marginal returns equal those of the best alternative use.
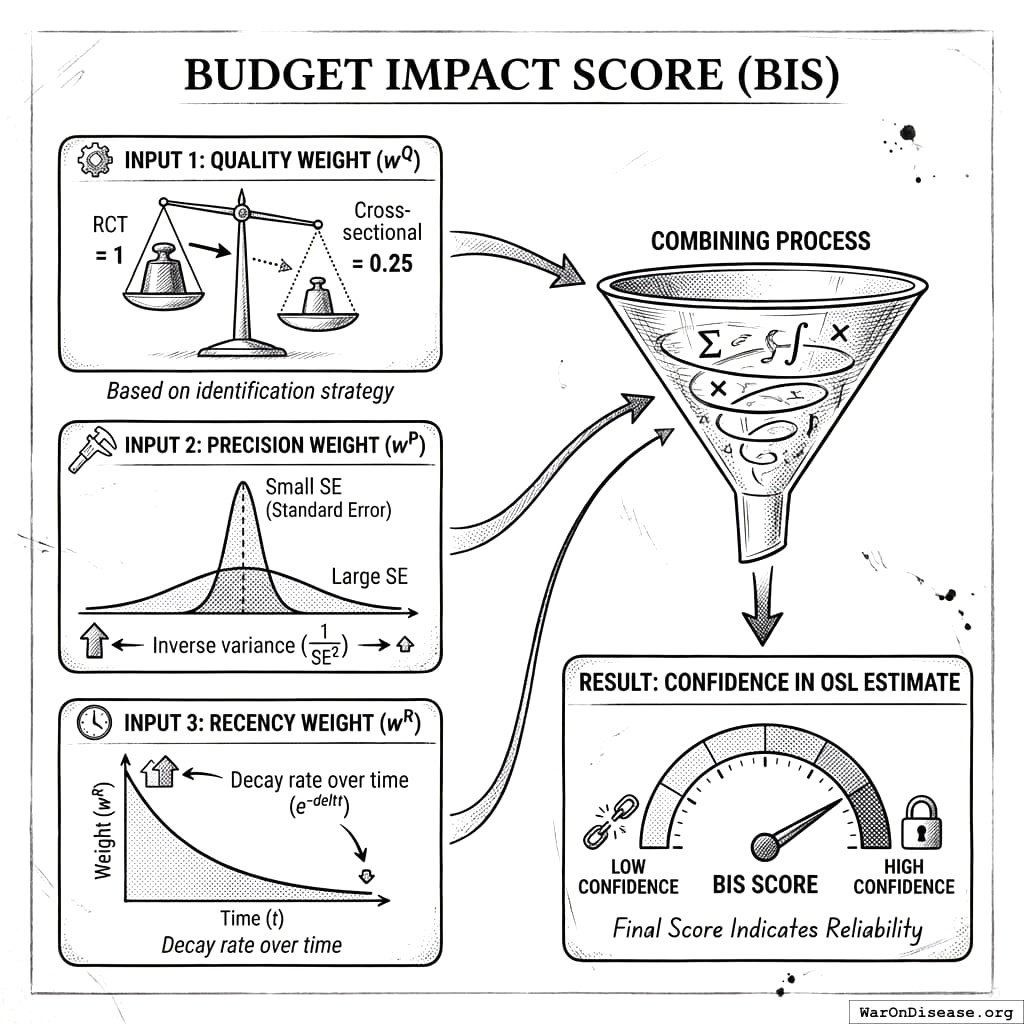
The Budget Impact Score (BIS) measures confidence in each OSL estimate based on study quality, statistical precision, and temporal recency of the underlying causal evidence. The result is a gap analysis showing which categories are over- or underfunded relative to evidence-based targets, enabling systematic reallocation from low-return to high-return public investments. At system scale, the model’s Optimal Governance Trajectory reaches 56.7x (90% CI: 21x-148x) the Earth baseline after 20 years, raises average income to $1.16 million (90% CI: $429,664-$3.04 million) versus $20,483 on the status-quo path, reaches $10.7 quadrillion (90% CI: $3.95 quadrillion-$28 quadrillion) in total output, and recovers roughly $101 trillion (90% CI: $59.6 trillion-$161 trillion)/year in suppressed value (The Political Dysfunction Tax).
budget optimization, optimal budget generator, evidence-based policy, meta-analysis, cost-effectiveness, diminishing returns, cross-country analysis, public finance, welfare economics, spending targets
Abstract
Your government decides how much to spend on each category the same way it has for decades: last year’s number, plus whatever the loudest lobbyist got added, minus whatever the latest crisis forced a cut on. This is called “the budget process.” It has no optimization function. It has no feedback loop. It has no measurable objective. It is, in the technical sense, not a process at all. It is an accident that repeats annually.
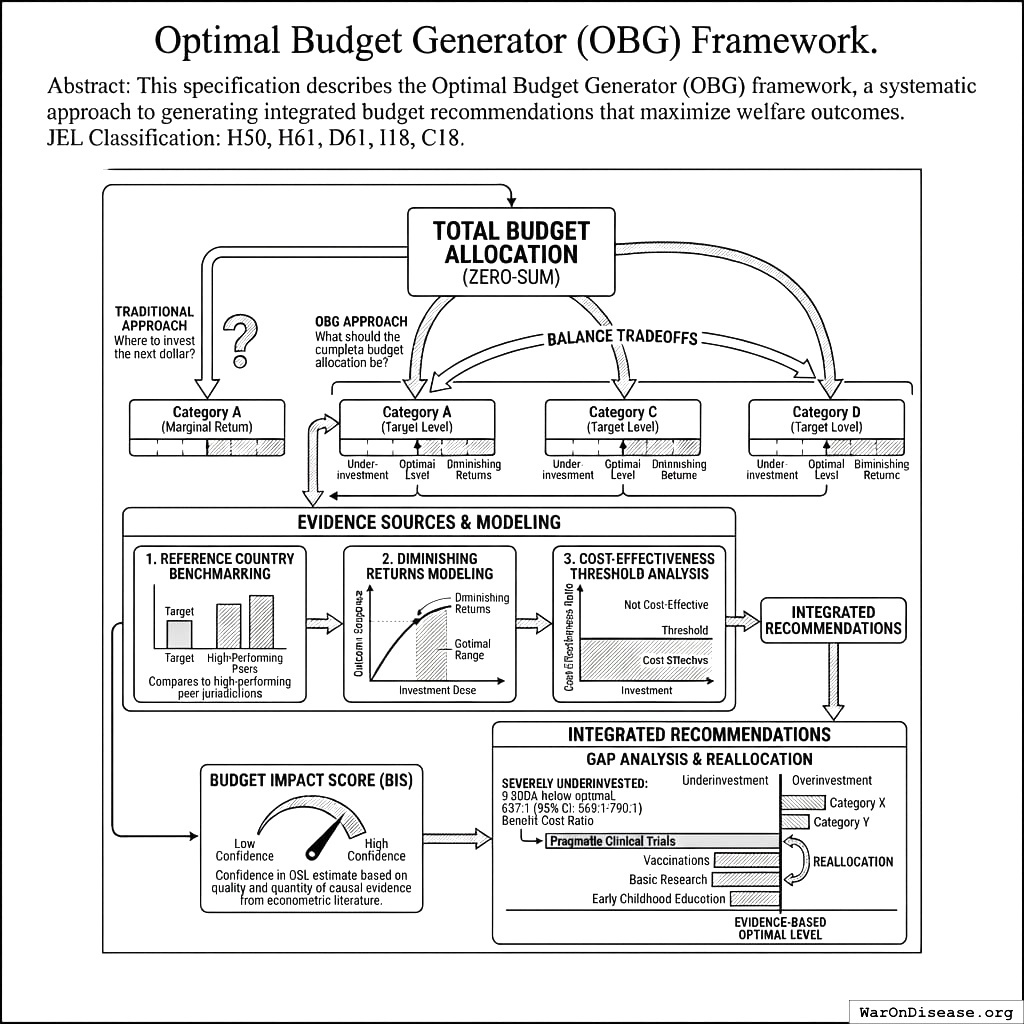
This specification describes the Optimal Budget Generator (OBG) framework, a systematic approach to generating integrated budget recommendations that maximize welfare as measured by two terminal general-welfare metrics: real after-tax median income growth and median healthy life years.
JEL Classification: H50, H61, D61, I18, C18
Unlike marginal-return frameworks that ask “where should we invest the next dollar?”, OBG asks “what should the complete budget allocation be?” Each category has a target level - too little means underinvestment, too much means diminishing returns. But unlike the Recommended Daily Allowance for nutrients (where you can meet all targets simultaneously), every budget dollar has other uses: another category, a universal cash payment, or staying with the taxpayer who earned it. OBG generates integrated recommendations that compare all of these uses, so the total budget is an output of the model, not an input.
The framework combines three evidence sources: (1) diminishing returns modeling from dose-response studies, (2) cost-effectiveness threshold analysis from health economics, and (3) efficiency frontiers, which separate waste from diminishing returns and, for defense, price the least-cost capabilities that defending the country requires. Neither peer-country spending nor current spending ever sets a target by itself. The Budget Impact Score (BIS) measures our confidence in each category’s OSL estimate based on the quality and quantity of causal evidence from the econometric literature.
The result is a gap analysis showing which categories are below evidence-based optimal levels, enabling systematic reallocation from overinvestment to underinvestment. Applied to the US federal budget, the illustrative example identifies pragmatic clinical trials as the most severely underinvested category (current spending is about 1% of the OSL, and the platform that runs these trials returns 439 (90% CI: 321-600):1 in R&D cost savings alone), followed by vaccinations, and identifies military spending as the largest overinvestment ($702 billion (90% CI: $671 billion-$728 billion) above the threat-based cost frontier). Basic research and early childhood education have strong evidence that more spending helps, but their OSLs are not derived yet.
Scale note. If budget allocation is the core bottleneck, the upside from fixing it is civilization-scale. Under the project’s best-case governance ceiling, the recoverable upside is $101 trillion (90% CI: $59.6 trillion-$161 trillion) per year. Over 20 years, the Optimal Governance Trajectory reaches 56.7x (90% CI: 21x-148x) the Earth baseline, raises average income to $1.16 million (90% CI: $429,664-$3.04 million) versus $20,483 on the status-quo path, and reaches $10.7 quadrillion (90% CI: $3.95 quadrillion-$28 quadrillion) in total output. This specification focuses on the allocation layer of that plan; the full derivation lives in The Political Dysfunction Tax1.
System Overview
What Policymakers See
A dashboard showing spending gaps by category, with clear recommendations:
Illustrative Example: US Federal Budget Gap Analysis
The following table demonstrates how OBG output would appear.
Illustrative data. This table shows the output format, not a recommendation. Each OSL has a stated basis: a worked example in this paper (see Worked Example: Pragmatic Clinical Trials and Worked Example: Vaccinations), the threat-based cost frontier for the military (see Worked Example: Military Spending as a Cost Frontier), or the cash benchmark. Rows marked “Not derived” show only the direction of the evidence. OBG does not fill them with a multiple of current spending, because a target anchored on today’s budget inherits today’s errors.
| Category | Current | OSL | Gap | Basis | Evidence | Income Effect | Health Effect | Action |
|---|---|---|---|---|---|---|---|---|
| Pragmatic clinical trials | $0.5B | $50B | +$49.5B | Worked example | A (RCTs) | ++ | +++ | Scale 100x |
| Vaccinations | $8B | $16B | +$8B | Worked example | A (RCTs) | + | +++ | Increase |
| Military | Cut $702 billion (90% CI: $671 billion-$728 billion) | Threat-based cost frontier | C (assumption-based costs) | − | − | Decrease | ||
| Agricultural subsidies | $25B | $0B | -$25B | Cash benchmark | C (assumption) | − | − | Eliminate |
| Basic research | $45B | Not derived | Not derived | Evidence on direction only | Not graded | ++ | ++ | Estimate OSL; evidence says increase |
| Early childhood (0-5) | $50B | Not derived | Not derived | Evidence on direction only | Not graded | +++ | + | Estimate OSL; evidence says increase |
| Universal cash payment | $0 | Not estimated | Not estimated | Not estimated | ++ | + | Estimate |
Positive gaps indicate underinvestment; negative gaps indicate overinvestment. Income Effect: impact on real after-tax median income growth. Health Effect: impact on median healthy life years. Scale: +++ strong positive, ++ moderate positive, + weak positive, − negative. Evidence grades rate confidence in the OSL, not in the category’s effects: early childhood programs have strong randomized evidence that more spending helps, but no estimate yet of the spending level where returns fall to the opportunity cost, so they have no OSL and no grade.
The cuts in these rows are much larger than the increases. The OBG does not force the difference into any row. The full model assigns each dollar to its highest-value use: another category, a universal cash payment, or lower taxes. This example does not estimate those curves yet, so the difference stays unassigned.
What Budget Analysts See
- OSL estimates with confidence intervals and methodology notes
- Cross-country spending data showing spending-outcome relationships
- Diminishing returns curves identifying optimal spending levels
- Evidence quality scores (BIS) for each category
- Sensitivity analysis showing how OSL changes with different assumptions
- Priority rankings by gap size weighted by evidence confidence
Where This Fits
+-------------------------------------------------------------+
|                    OPTIMOCRACY FRAMEWORK                     |
+-------------------------------------------------------------+
|                                                              |
|  +---------------------+    +-----------------------------+  |
|  |  Budget Generator   |    |  Policy Generator           |  |
|  |  (OBG/BIS Framework)|    |  (OPG/PIS Framework)        |  |
|  |                     |    |                             |  |
|  |  Answers:           |    |  Answers:                   |  |
|  |  "How should we     |    |  "What policies should      |  |
|  |  allocate the       |    |  we adopt/change?"          |  |
|  |  budget?"           |    |                             |  |
|  |                     |    |                             |  |
|  |  Primary output:    |    |  Primary output:            |  |
|  |  Integrated budget  |    |  Enact/Replace/Repeal       |  |
|  |  recommendations    |    |  recommendations            |  |
|  +---------------------+    +-----------------------------+  |
|                                                              |
|  Both feed into: Constitutional Layer (outcome-optimizing rules)  |
+-------------------------------------------------------------+
The OBG/BIS framework answers: “Given what we know about returns to spending, what are the optimal allocation levels?”
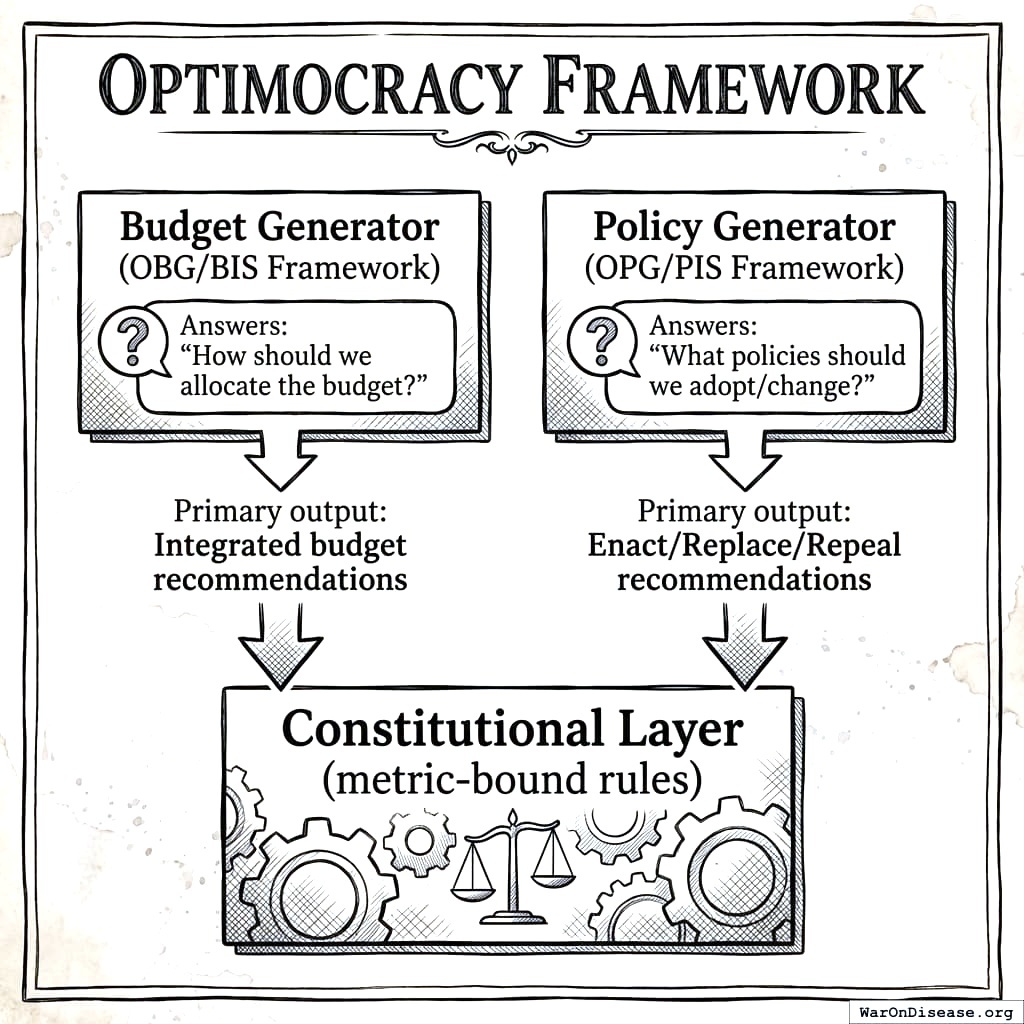
The OPG framework (see Optimal Policy Generator Specification2) answers: “Which policy reforms beyond budget allocation would most improve welfare?”
Implementation Mechanism
This specification focuses on generating evidence-based budget recommendations. Political implementation mechanisms are discussed separately in Incentive Alignment Bonds3.
Introduction
Why Budget Allocation Fails Today
Budget allocation is fundamentally a problem of social choice under uncertainty4. The challenge is not simply technical but institutional: current budget processes systematically diverge from welfare-optimal allocations because small, concentrated groups organize while large, diffuse ones do not5, because organized industries and pressure groups shape the rules and transfers written for them6,7, and because even a planner with the right objective does worse deciding case by case than following a rule8.
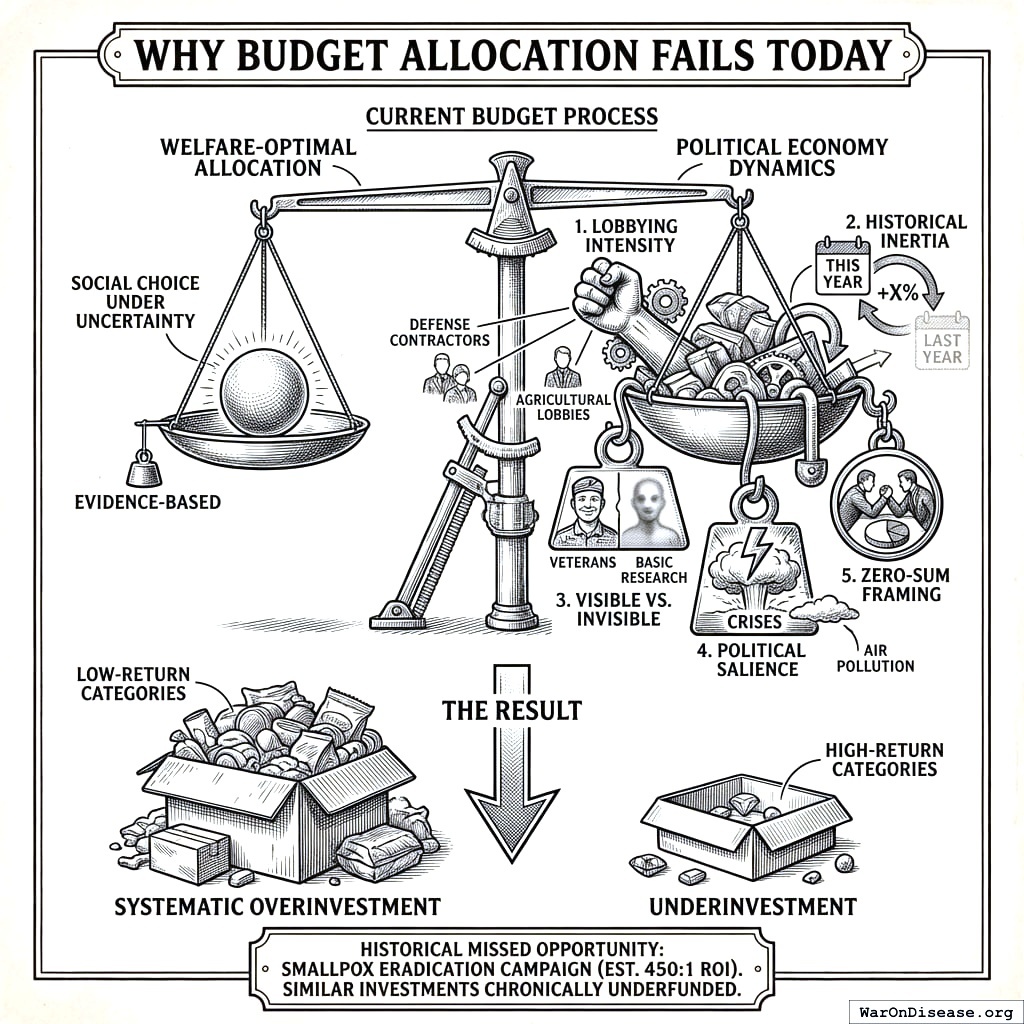
Current budget allocation follows a process dominated by:
- Lobbying intensity: Categories with organized beneficiaries (weapons manufacturers, agricultural lobbies) receive disproportionate funding regardless of evidence
- Historical inertia: This year’s budget is last year’s budget plus a percentage, not a fresh optimization
- Visible vs. invisible beneficiaries: Programs with identifiable beneficiaries (veterans) outcompete programs with diffuse beneficiaries (clinical trials, vaccinations)
- Political salience: Crises drive spending regardless of cost-effectiveness (terrorism vs. air pollution)
- Zero-sum framing: Budget debates treat all categories as competing rather than asking which ones are at optimal levels
The result: systematic overinvestment in low-return categories and underinvestment in high-return categories. Historical examples demonstrate the scale of missed opportunities: the smallpox eradication campaign returned an estimated 159:19, yet similar high-return public health investments remain chronically underfunded.
The RDA Analogy: Optimal Levels, Not Just Marginal Returns
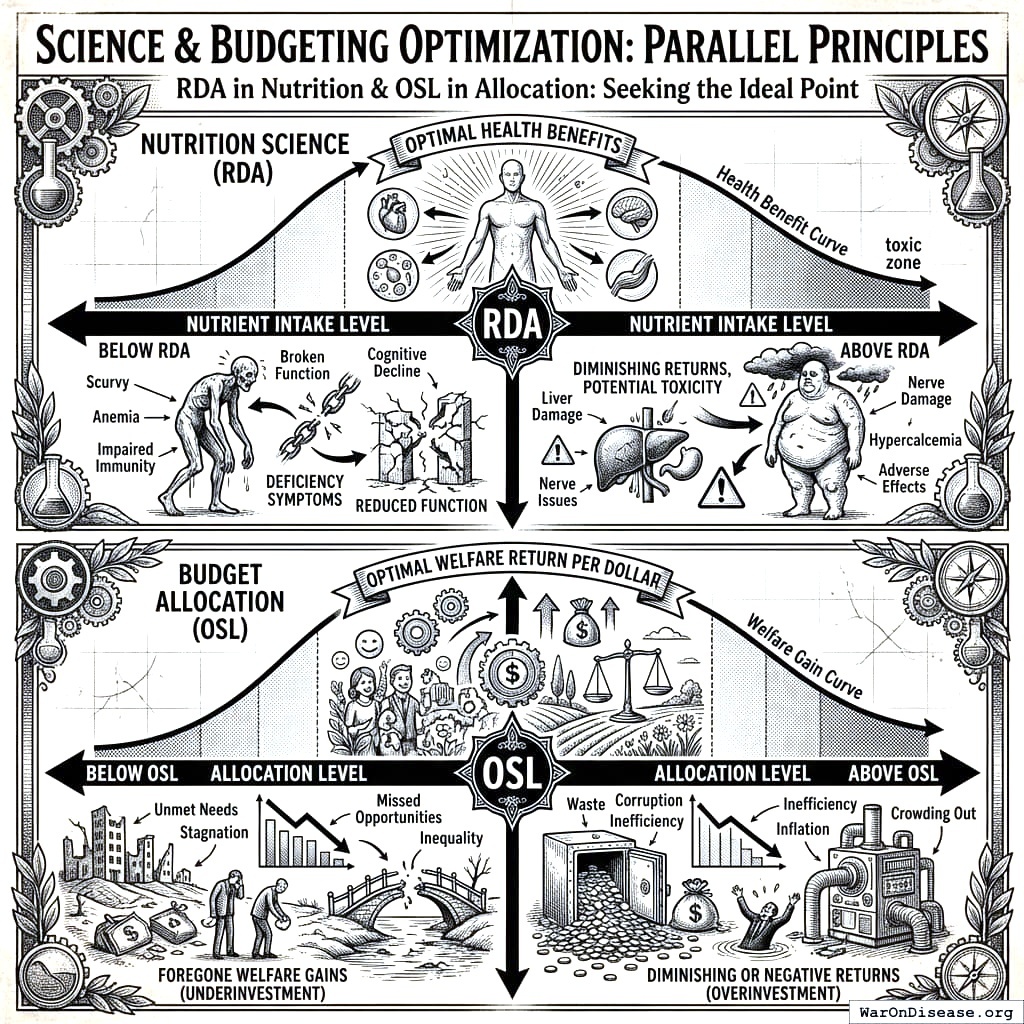
Nutrition science doesn’t just say “eat more vitamins.” It specifies Recommended Daily Allowances - target intake levels where:
- Below RDA: Deficiency symptoms, reduced function
- At RDA: Optimal health benefits
- Above RDA: Diminishing returns, potential toxicity
Budget allocation should work the same way. For each spending category:
- Below OSL: Foregone welfare gains (underinvestment)
- At OSL: Optimal welfare return per dollar
- Above OSL: Diminishing or negative returns (overinvestment)
infinite spending on any category doesn’t make sense, even one with high returns. Early childhood education has excellent returns - but spending $10 trillion on it wouldn’t produce 10x the benefits of spending $1 trillion. There’s an optimal level.
What This Framework Provides
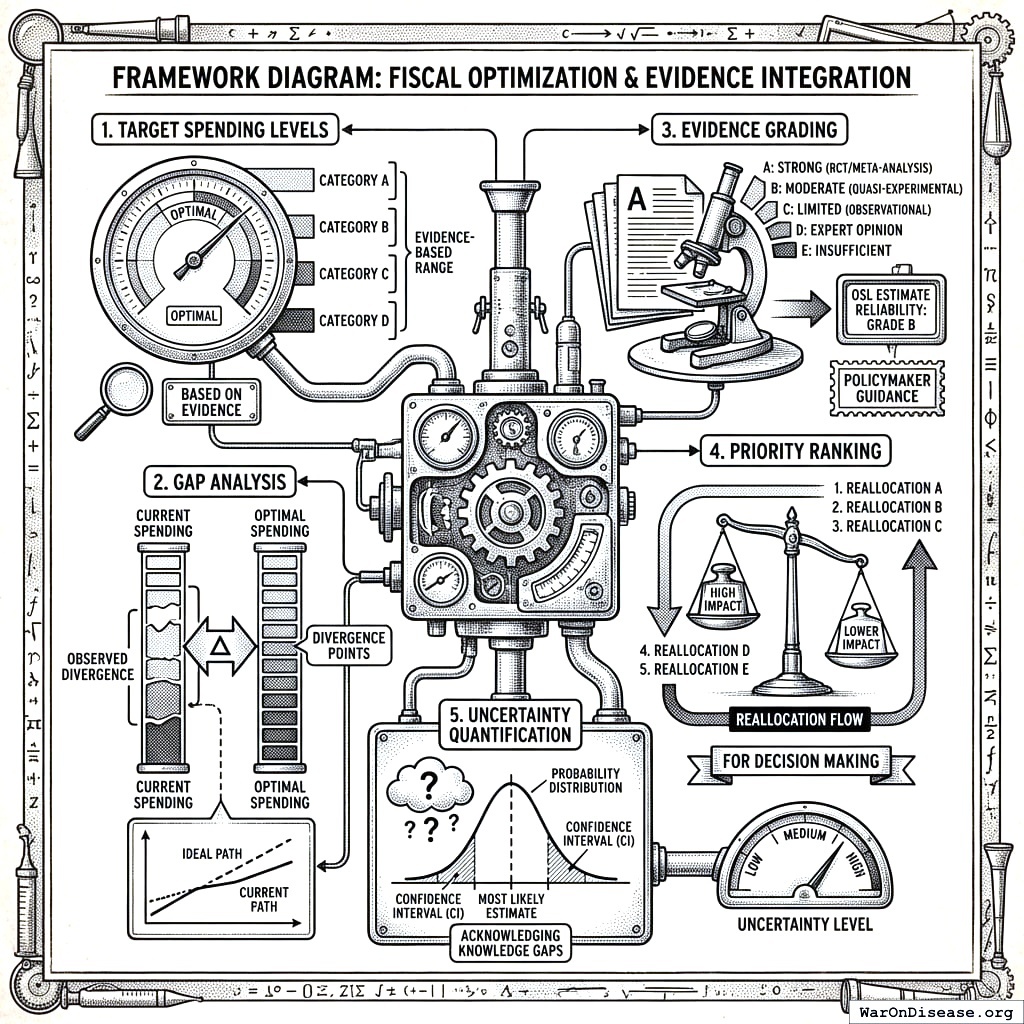
- Target spending levels for each budget category based on evidence
- Gap analysis showing where current spending diverges from optimal
- Evidence grading so policymakers know which OSL estimates are reliable
- Priority ranking for reallocation decisions
- Uncertainty quantification around each estimate
Guarding Against Status-Quo Bias
A budget optimizer that starts from today’s budget can inherit today’s mistakes. Five design rules prevent this:
- The total budget is a choice. The model does not hold total spending fixed. Every program must beat a universal cash payment and must beat leaving the money with taxpayers, after the cost of raising taxes. If no program beats them, the optimal budget is smaller.
- Categories are goals, not agencies. A category is an outcome to buy (for example, child health), not an existing department. Each goal compares delivery methods: public provision, vouchers, cash, prizes and advance purchase commitments, payment for results, and rule changes that cost nothing.
- Cash is the benchmark. A delivery method gets money only if it produces more welfare per dollar than giving the same dollar to people as cash.
- Neither peer spending nor current spending is a target. If every government overspends on something, copying peers copies the error, and a target set as a multiple of today’s budget copies today’s error. Reference-country spending enters the efficiency frontier and dose-response models as data points. A category without a derived OSL shows “Not derived” and becomes a candidate for value-of-information pilots. An OSL from a frontier or from assumption-based costs, without causal evidence on returns, has a BIS of at most 0.59 (grade C, “pilot before scaling”).
- New methods get pilots, not penalties. Most evaluations study programs that already exist, so a new delivery method has little evidence. Low evidence sends a method to pilot funding, not to exclusion.
Outcome Metrics: What We’re Optimizing
All OBG recommendations ultimately aim to maximize two terminal general-welfare metrics:
Real after-tax median income growth (pp/year): Year-over-year percentage change in inflation-adjusted, post-tax median household income. Sources: Census Bureau, BLS.
Median healthy life years (years): Expected years of life in good health at the population median. Sources: WHO Global Health Observatory, national health surveys.
The welfare function combines these with equal weight by default. The two metrics have different units (percentage points per year and years), so each is first divided by its cross-jurisdictional standard deviation, as in the OPG standardization:
\[ W = 0.5 \cdot \frac{\text{IncomeGrowth}}{\sigma_{\text{income}}} + 0.5 \cdot \frac{\text{HealthyYears}}{\sigma_{\text{health}}} \]
Why these two metrics? They are the terminal general-welfare metrics: the best currently measurable civilization-scale endpoints for approximating the terminal values defined in What Matters, pleasant consciousness and unpleasant consciousness. Most policy effects eventually show up in one or both. Economic policies (taxes, regulations, trade) primarily affect income growth. Health policies (healthcare access, public health, safety) primarily affect healthy life years. Education and infrastructure affect both. See Two-Metric Welfare Function for the complete framework.
Every spending category’s OSL is ultimately justified by its expected impact on these two metrics. The gap analysis and priority rankings reflect which reallocations would most improve the combined welfare function.
Related Work
The OBG framework builds on and extends several established traditions in public finance and evidence-based policy.
Budget Analysis Frameworks
Congressional Budget Office (CBO) Scoring. The CBO provides cost estimates for proposed legislation, projecting fiscal impacts over 10-year windows for bills that affect mandatory spending or revenues (5 years for bills that authorize discretionary programs)10. However, CBO scoring focuses on cost rather than welfare optimization - it answers “what will this cost?” not “what should we spend?” OBG complements CBO analysis by providing evidence-based spending targets against which proposals can be evaluated.
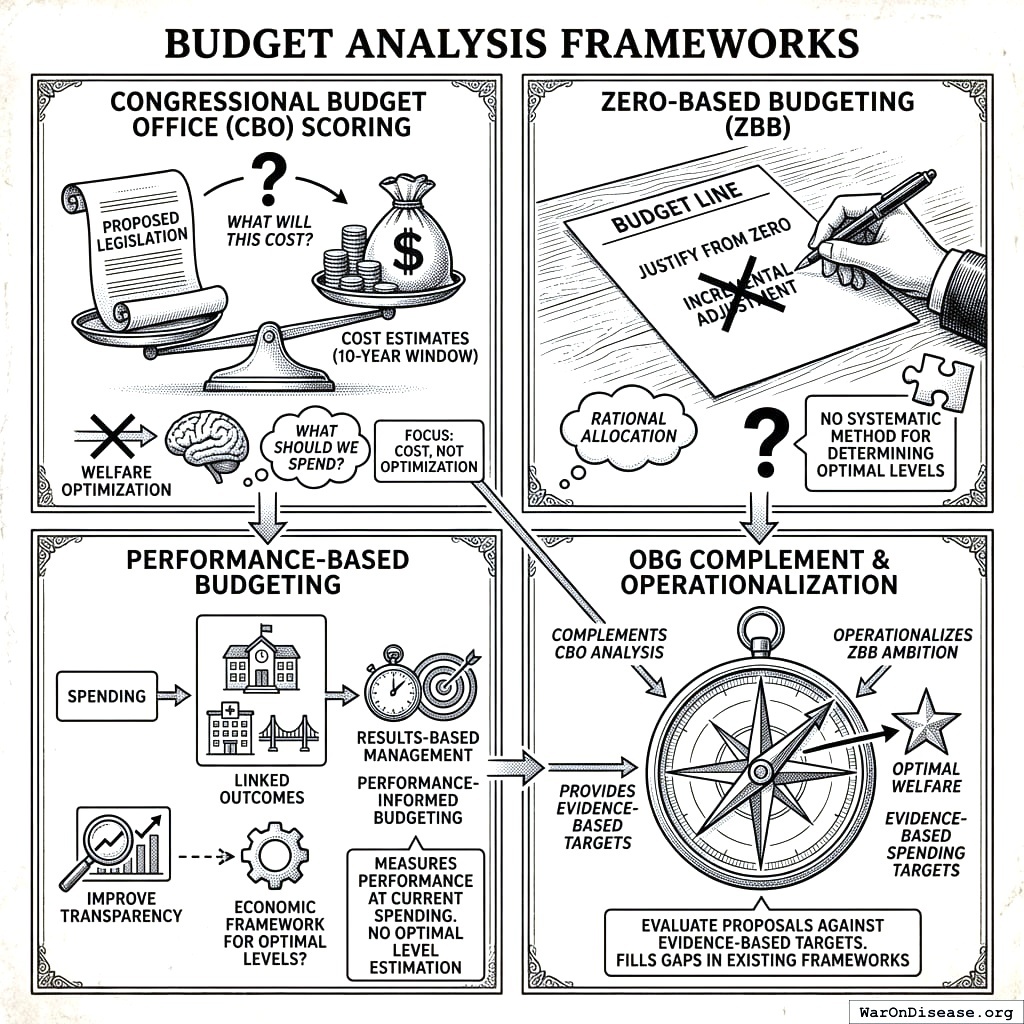
Performance-Based Budgeting. Since the Planning-Programming-Budgeting System (PPBS) of the 1960s, governments have attempted to link spending to outcomes. Modern variants include Results-Based Management and Performance-Informed Budgeting. These approaches improve transparency but typically lack the economic framework for determining optimal levels - they measure performance at current spending without estimating what spending should be.
Zero-Based Budgeting. ZBB requires justifying each budget line from zero rather than incremental adjustment. While philosophically aligned with OBG’s goal of rational allocation, ZBB provides no systematic method for determining optimal levels. OBG operationalizes ZBB’s ambition with evidence-based targets.
Evidence-Based Policy Movement
What Works Clearinghouses. Organizations like the What Works Clearinghouse (education), Cochrane Collaboration (health), and Campbell Collaboration (social policy) synthesize intervention evidence through systematic reviews. OBG draws on these evidence bases but extends beyond intervention evaluation to budget-level optimization. While clearinghouses answer “does this work?”, OBG answers “how much should we spend?”
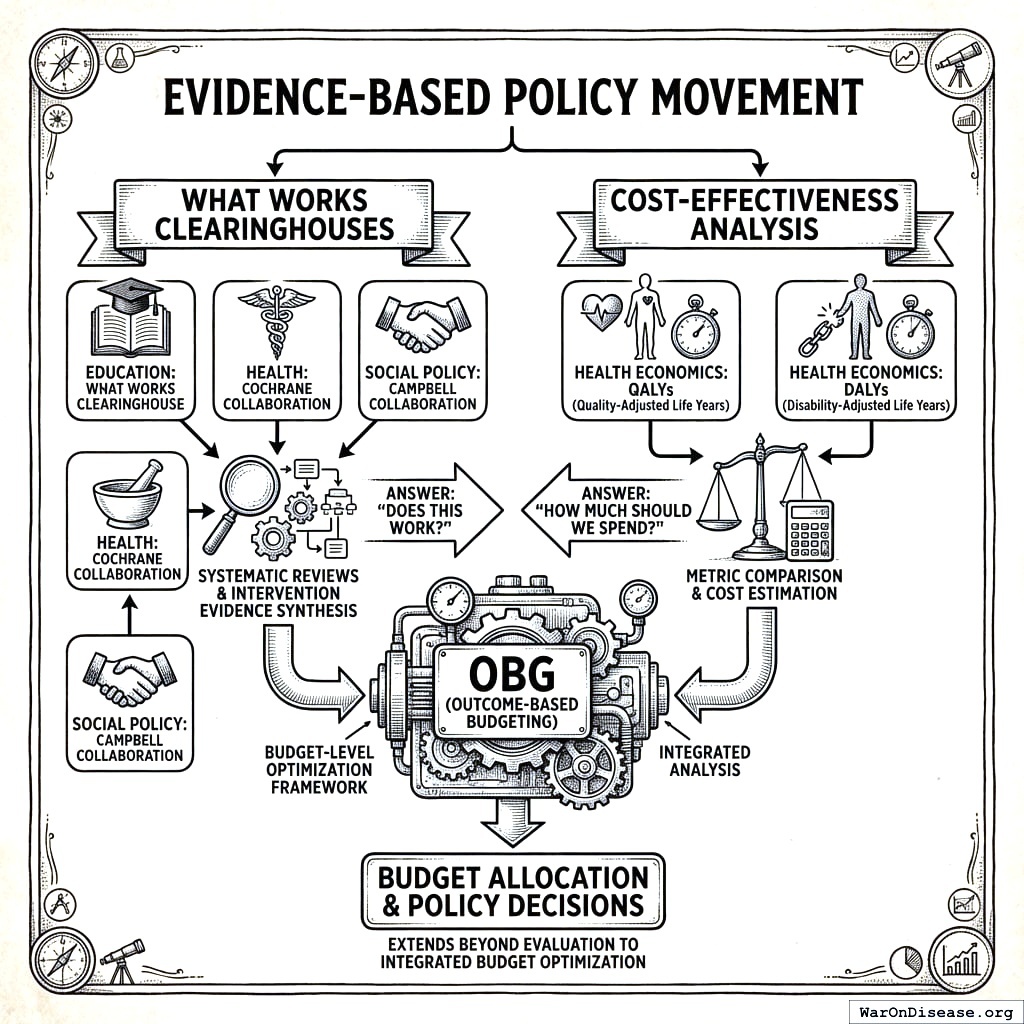
Cost-Effectiveness Analysis. Health economics has developed methods for comparing interventions using metrics like QALYs (Quality-Adjusted Life Years) and DALYs (Disability-Adjusted Life Years)11. OBG incorporates cost-effectiveness as one of three estimation methods but applies it within an integrated budget optimization framework rather than intervention-by-intervention.
Comparative Public Finance
OECD Government Spending Analysis. The OECD publishes extensive cross-country spending comparisons and outcome data12,13. OBG leverages this data infrastructure for diminishing returns analysis while adding the conceptual framework of optimal levels and evidence-weighted confidence.
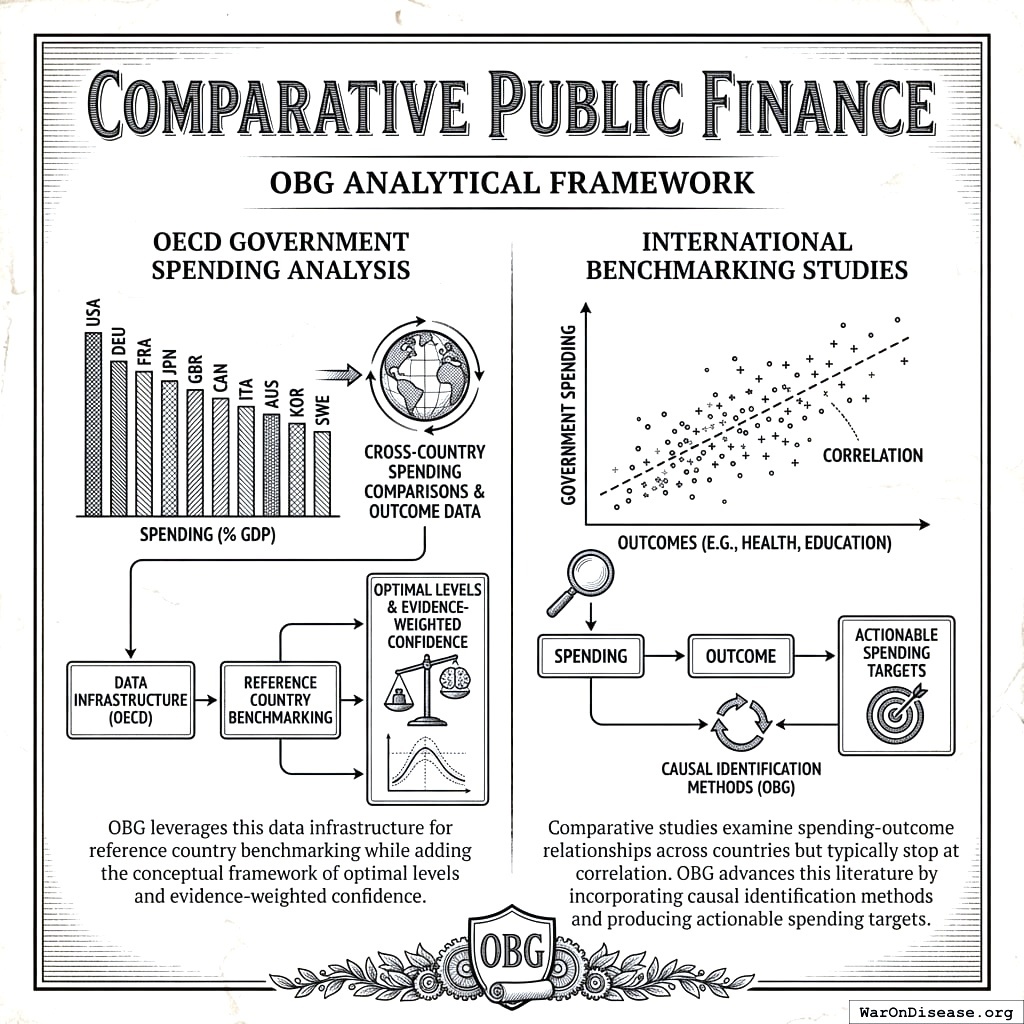
International Benchmarking Studies. Comparative studies examine spending-outcome relationships across countries but typically stop at correlation. OBG advances this literature by incorporating causal identification methods and producing actionable spending targets.
Budget-Allocation Models and Priority-Setting Systems
Policy Priority Inference. This computational model links how a government spreads its budget across programs to the expected movement of development indicators14. A UNDP study of Colombia projected that only 18% of Sustainable Development Goal indicators would reach their 2030 targets at the current pace, and that a 20% budget increase would raise this only to 20%; the authors report that reallocation would do more than adding money15. This supports OBG’s focus on diminishing returns. Unlike OBG, the model targets fixed indicator goals rather than a welfare function, and it calibrates on one country’s history rather than on causal estimates across jurisdictions.
Optima. Optima computes the split of a fixed HIV budget across programs that best meets goals such as fewer infections16. For 44 countries, optimal allocation of existing HIV budgets over 2016 to 2030 could avert about 7.4 million additional infections, a 26% drop in incidence, with no new money17. Sudan and Belarus moved their actual HIV budgets toward the recommended allocation18. Optima is the strongest evidence that budget optimization can change real budgets, within one sector.
Priority-setting systems. Disease Control Priorities19,20, the Lancet Commission on Investing in Health21, the WHO “best buys”22, the Copenhagen Consensus23, and the Washington State Institute for Public Policy24 publish ranked lists of high-return spending. OBG uses these rankings as inputs to its cost-effectiveness method. Their common limit is adoption, which OBG leaves to the Incentive Alignment Bonds mechanism.
Evidence on budget size and composition. In rich countries, a government larger by 10 percentage points of GDP is associated with 0.5 to 1 percentage point lower annual growth, a correlation the authors warn against reading as causal25. Public investment and education raise long-run growth, while pensions and subsidies lower it26. About 30% of the potential gains from public investment are lost to inefficiency27. Optimal research and development spending is at least two to four times actual US spending28, and the optimal health share of spending rises with income29. These results set the direction for categories whose OSLs are not derived yet. They do not set levels.
Efficiency frontiers. Frontier methods estimate the most output that any producer gets from a given input. Data envelopment analysis estimates the frontier from observed inputs and outputs, with weights taken from the data30, and stochastic frontier analysis splits the error into symmetric random noise and a one-sided inefficiency term31. Applied to public spending, these methods measure how far each government is from best practice32. OBG uses the frontier’s slope as the best attainable marginal return (see Efficiency Frontier Analysis).
For a full survey, see Related Work in the Optimocracy paper33.
How OBG Differs
The OBG framework advances existing approaches in four key ways:
- Integrated multi-method estimation. Rather than relying on a single approach, OBG combines OSL estimates from diminishing returns modeling, cost-effectiveness analysis, and efficiency frontiers, and it never uses peer or current spending as a target. This provides robustness and identifies where methods agree or conflict.
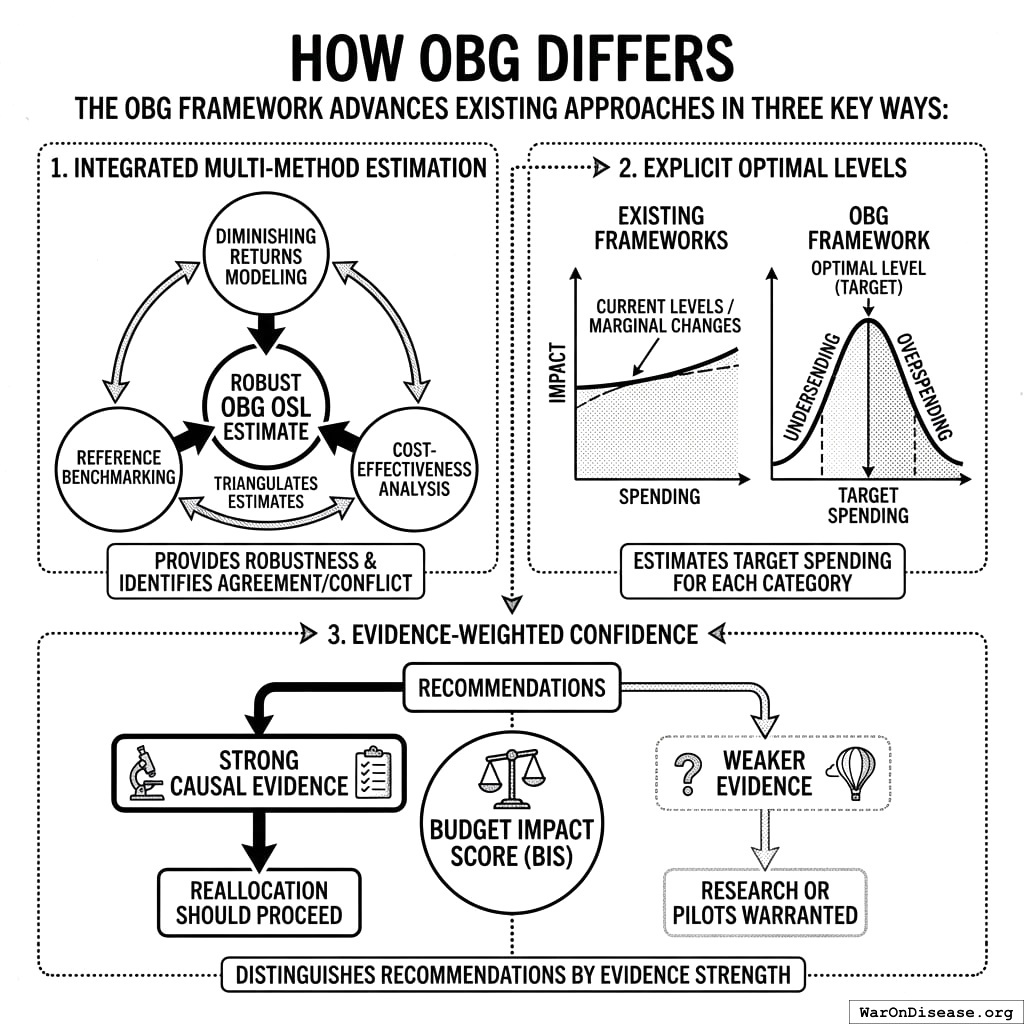
Explicit optimal levels. Unlike frameworks that analyze spending at current levels or propose marginal changes, OBG estimates target spending levels for each category - acknowledging that both underspending and overspending are suboptimal.
Evidence-weighted confidence. The Budget Impact Score (BIS) distinguishes recommendations supported by strong causal evidence (where reallocation should proceed) from those based on weaker evidence (where research or pilots are warranted).
Size and delivery are choices. Most budget tools take the total budget and the existing programs as given. OBG lets the total shrink when no program beats a universal cash payment or lower taxes, and it compares delivery methods for each goal against cash (see Delivery Methods and the Cash Benchmark).
Theoretical Framework
This section formalizes the OBG framework as a social planner’s optimization problem, establishing the theoretical foundations for optimal spending levels and evidence-weighted allocation.
Optimal Spending Levels Under Uncertainty
In practice, the welfare functions \(W_i(\cdot)\) are not known with certainty. Let \(\hat{W}_i(s)\) denote the planner’s estimate of welfare, with associated uncertainty \(\sigma_i^2(s)\).
Definition 1 (Optimal Spending Level). The Optimal Spending Level for category \(i\) is:
\[ \text{OSL}_i \equiv \arg\max_{s_i} \mathbb{E}[\hat{W}_i(s_i)] - \frac{\rho}{2} \text{Var}[\hat{W}_i(s_i)] \]
where \(\rho \geq 0\) is the planner’s risk aversion parameter.
For risk-neutral planners (\(\rho = 0\)), OSL reduces to the spending level that maximizes expected welfare. For risk-averse planners, OSL accounts for estimation uncertainty.
OBG does not build a mean-variance portfolio frontier across categories. When the risks of a public investment are borne by the public, the total cost of bearing them is insignificant, so the government should ignore uncertainty when it evaluates public investments38. The result assumes that a program’s returns are independent of national income. The default is therefore \(\rho = 0\), and uncertainty enters through value of information: uncertain categories get pilots that reduce the uncertainty. A positive \(\rho\) is reserved for risks that spreading does not remove, such as an error in an assumption that many categories share.
Proposition 2 (OSL Characterization). Under Assumption 1, with estimated marginal welfare \(\hat{W}_i'(s)\) and estimation variance \(\sigma_i^2(s)\), the OSL satisfies:
\[ \mathbb{E}[\hat{W}_i'(\text{OSL}_i)] = r + \rho \cdot \frac{\partial \sigma_i^2}{\partial s}\bigg|_{s=\text{OSL}_i} \]
where \(r\) is the opportunity cost of public funds: the marginal welfare \(\lambda^*\) of the best alternative use of the last dollar (another goal, the universal cash payment, or lower taxes).
Proof. The first-order condition for the uncertainty-adjusted maximization problem yields the result. The term \(r\) represents the marginal value of funds in their best alternative use; the second term adjusts for risk. \(\square\)
Budget Impact Score as Precision Weighting
The Budget Impact Score formalizes the precision of OSL estimates, enabling evidence-weighted reallocation decisions.
Definition 2 (Budget Impact Score). For category \(i\) with \(n_i\) effect estimates \(\{\hat{\beta}_{ij}\}_{j=1}^{n_i}\), the Budget Impact Score is:
\[ \text{BIS}_i = \min\left(1, \frac{1}{K} \sum_{j=1}^{n_i} w_j^Q \cdot w_j^P \cdot w_j^R \right) \]
where:
- \(w_j^Q \in (0,1]\) = quality weight based on identification strategy (RCT = 1, cross-sectional = 0.25)
- \(w_j^P = 1/\text{SE}(\hat{\beta}_j)^2\) = precision weight (inverse variance)
- \(w_j^R = e^{-\delta(t_{now} - t_j)}\) = recency weight with decay rate \(\delta\)
- \(K\) = calibration constant
Proposition 3 (BIS as Inverse Variance). Under standard meta-analytic assumptions, BIS is proportional to the precision of the pooled effect estimate:
\[ \text{BIS}_i \propto \frac{1}{\text{Var}(\hat{\beta}_i^{pooled})} \]
where \(\hat{\beta}_i^{pooled}\) is the quality-weighted pooled estimate of spending effects.
Gap Analysis and Welfare Gains
Definition 3 (Spending Gap). The spending gap for category \(i\) is:
\[ \text{Gap}_i = \text{OSL}_i - s_i^{current} \]
Proposition 4 (Welfare Gains from Gap Closure). For small gaps, the welfare gain from moving spending from current level to OSL is approximately:
\[ \Delta W_i \approx W_i'(s_i^{current}) \cdot \text{Gap}_i - \frac{1}{2} |W_i''(\bar{s})| \cdot \text{Gap}_i^2 \]
where \(\bar{s}\) is between \(s_i^{current}\) and \(\text{OSL}_i\).
Proof. Taylor expansion of \(W_i(\text{OSL}_i) - W_i(s_i^{current})\) around \(s_i^{current}\). \(\square\)
Corollary 1 (Priority Ranking). Categories should be prioritized for reallocation in order of:
\[ \text{Priority}_i = |\text{Gap}_i| \times \text{BIS}_i \times |W_i'(s_i^{current})| \]
This ranks categories by expected welfare gain adjusted for estimation confidence.
Note: In the simplified implementation used in the priority ranking example, we normalize by setting \(|W_i'(s_i^{current})| = 1\) for all categories, reducing the priority formula to \(\text{Priority}_i = |\text{Gap}_i| \times \text{BIS}_i\). This assumes equal marginal welfare weights across categories as a first approximation. Future iterations could incorporate category-specific marginal welfare estimates.
Welfare Bounds Under Model Uncertainty
When the functional form of \(W_i(\cdot)\) is uncertain, we can establish bounds on welfare gains.
Proposition 5 (Welfare Bounds). Let \(\underline{W}_i\) and \(\overline{W}_i\) denote lower and upper bounds on the welfare function consistent with available evidence. Then:
\[ \underline{\Delta W} = \sum_{i: \text{Gap}_i > 0} \underline{W}_i'(s_i) \cdot \text{Gap}_i \leq \Delta W \leq \sum_{i: \text{Gap}_i > 0} \overline{W}_i'(s_i) \cdot \text{Gap}_i = \overline{\Delta W} \]
The OBG framework reports both point estimates and these bounds via sensitivity analysis.
Summary of Theoretical Results
| Result | Implication for OBG |
|---|---|
| Proposition 1 | Optimal allocation equalizes marginal returns across goals, the cash payment, and the cost of raising revenue |
| Proposition 2 | OSL accounts for both expected returns and uncertainty |
| Proposition 3 | BIS captures estimation precision |
| Proposition 4 | Gap closure yields quantifiable welfare gains |
| Corollary 1 | Priority ranking optimizes reallocation sequence |
| Proposition 5 | Welfare bounds enable robust recommendations |
Core Methodology
Spending Category Data Structure
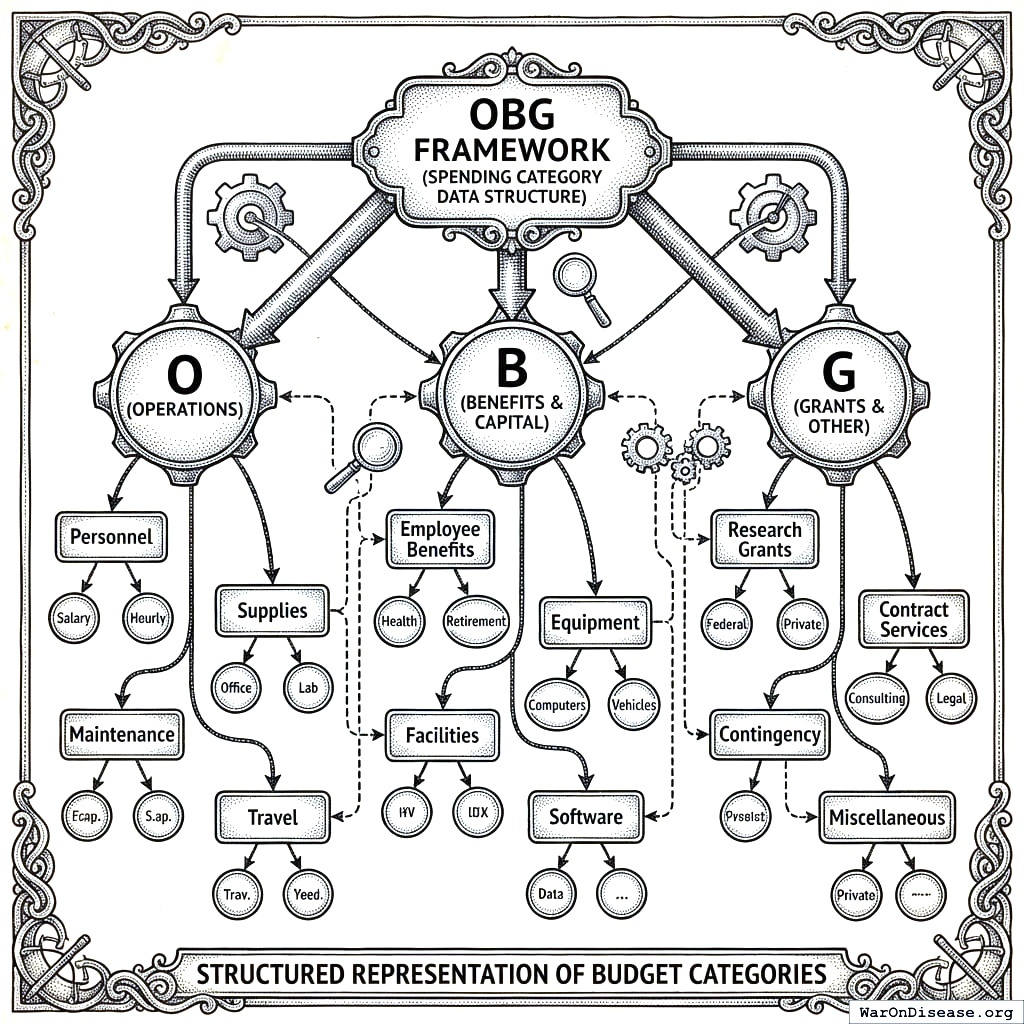
The OBG framework uses a structured representation of budget categories:
-- Spending categories
spending_categories (
    id, name, parent_category_id,
    spending_type, -- 'program', 'transfer', 'investment', 'regulatory'
    outcome_categories, -- which welfare outcomes this affects
    current_spending_usd, fiscal_year,
    data_source, last_updated
)

-- Cross-country spending data
reference_spending (
    category_id, country_code, year,
    spending_usd, spending_per_capita,
    spending_pct_gdp, population, gdp,
    data_source
)

-- Optimal spending level estimates (one row per goal and delivery mechanism)
osl_estimates (
    category_id, delivery_mechanism, -- 'public_provision', 'voucher', 'cash', 'prize', 'payment_for_results', 'rule_change'
    estimation_method, -- 'diminishing_returns', 'cost_effectiveness', 'efficiency_frontier', 'cost_frontier'
    osl_usd, osl_per_capita, osl_pct_gdp,
    confidence_interval_low, confidence_interval_high,
    evidence_grade, bis_score,
    methodology_notes, last_updated
)

-- Outside options that every use of money must beat
outside_options (
    option, -- 'universal_cash_payment', 'lower_taxes'
    marginal_welfare_per_dollar, confidence_interval_low, confidence_interval_high,
    data_source, last_updated
)

-- Gap analysis
spending_gaps (
    category_id, current_spending_usd,
    osl_usd, gap_usd, gap_pct,
    priority_score, -- gap * BIS confidence
    recommended_action
)
Three Methods for OSL Estimation
| Method | Use Case | Data Required | Strengths | Limitations |
|---|---|---|---|---|
| Diminishing returns modeling | Categories with spending-outcome data across jurisdictions | Effect estimates at multiple spending levels | Theoretically grounded, finds optimal “knee” | Requires sufficient variation in spending |
| Cost-effectiveness threshold | Health/life-saving interventions | Cost per QALY/DALY, willingness-to-pay | Links to standard health economics11,39 | Limited to monetizable outcomes |
| Efficiency frontier | Categories with measurable outputs across jurisdictions; for defense, a cost frontier built from the cost of each needed capability | Spending and outcomes in many jurisdictions, or capability costs | Separates waste from diminishing returns; uses the best performers, not the average | Shows correlation, not cause; sensitive to outliers and data errors. Without causal evidence, BIS is capped at 0.59 |
Peer-country spending is never a method by itself. It enters the first and third methods as data.
Each method is detailed below.
Diminishing Returns Modeling
The Core Concept
The fiscal multiplier literature shows that the output return per dollar depends on what the dollar buys: about 1.1 to 1.7 for renewable-energy investment versus 0.4 to 0.7 for fossil-fuel investment40, and below 1 (0.4 to 0.7 within two years) for temporary US defense purchases41. OBG adds an assumption that must be tested category by category: within a category, returns also fall as spending rises. At low spending levels, each additional dollar produces substantial welfare gains. At high spending levels, marginal returns diminish. The OSL is where marginal return equals opportunity cost.
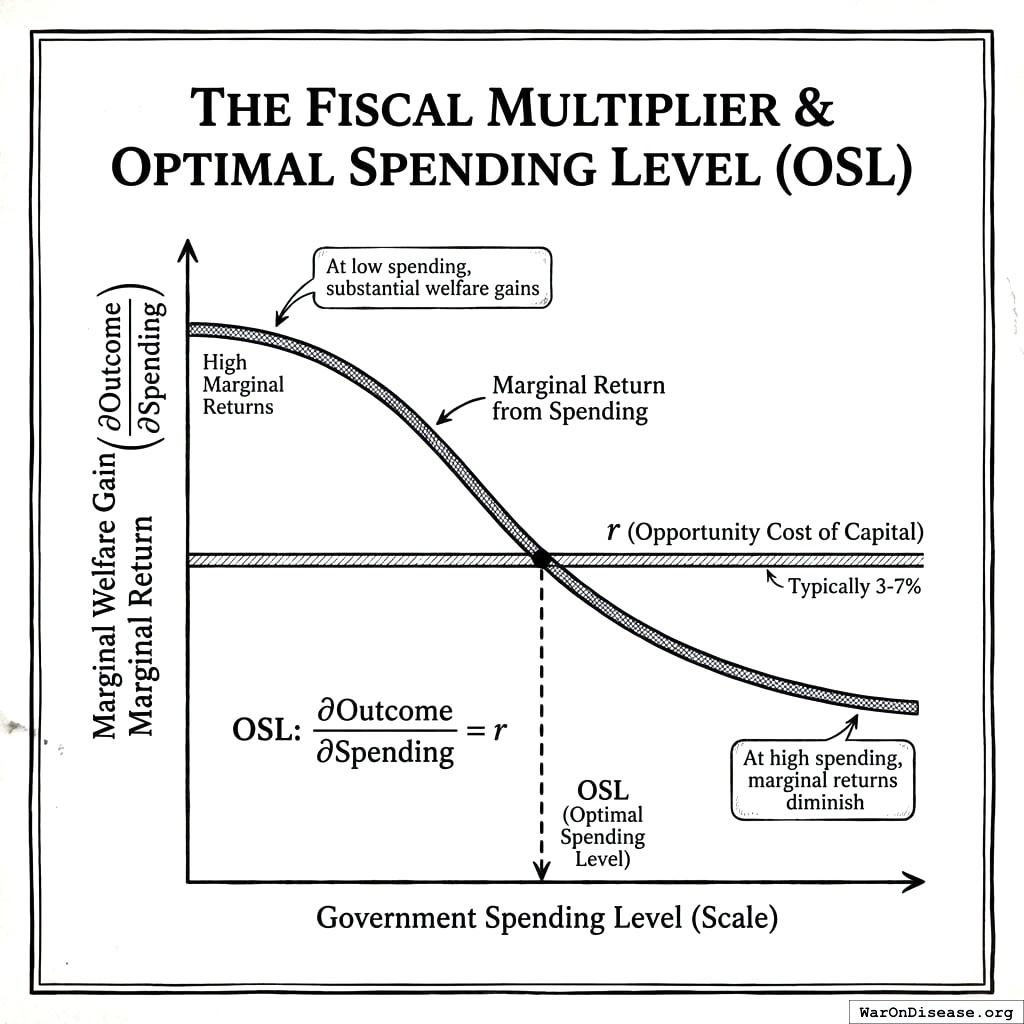
\[ \text{OSL}: \frac{\partial \text{Outcome}}{\partial \text{Spending}} = r \]
Where \(r\) is the opportunity cost of public funds: the marginal welfare \(\lambda^*\) of the best alternative use of the last dollar (another goal, the universal cash payment, or lower taxes).
Finding the “Knee” of the Curve
Empirically, we look for the point where the outcome-spending relationship flattens:
Outcome
   ^
   |                    ___________
   |                 __/
   |               _/
   |             _/
   |           _/   <- OSL is around here
   |         _/
   |       _/
   |     _/
   |   _/
   | _/
   |/
   +-----------------------------------> Spending
         Low            High
Estimation Methods
1. Nonlinear regression on cross-country data
Fit diminishing returns functions:
\[ \text{Outcome} = \alpha + \beta \cdot \log(\text{Spending}) + \epsilon \]
Or with saturation:
\[ \text{Outcome} = \alpha + \beta \cdot \frac{\text{Spending}}{\text{Spending} + \gamma} \]
Where \(\gamma\) is the half-saturation constant.
2. Piecewise linear estimation
Estimate separate slopes for different spending ranges to identify where returns diminish.
3. Meta-regression of effect estimates
If multiple studies estimate effects at different spending levels, meta-regression can identify how effects vary with baseline spending. The credibility of such estimates depends critically on identification strategy42.
Worked Example: K-12 Education Spending
Primary metric affected: Real after-tax median income growth (via higher wages from improved skills).
43 exploited court-ordered school finance reforms to estimate causal effects of K-12 spending. Key finding: a 10% increase in per-pupil spending increases adult earnings by 7% for students from low-income families.
Does this effect diminish at higher spending levels?
Evidence from cross-state variation suggests:
| Baseline spending (per pupil) | Effect of 10% increase | Implied marginal return |
|---|---|---|
| $8,000 | +8% earnings | $0.80 per $1 |
| $12,000 | +5% earnings | $0.50 per $1 |
| $16,000 | +3% earnings | $0.30 per $1 |
| $20,000 | +1% earnings | $0.10 per $1 |
OBG estimation: At $16,000/pupil, the marginal return (~0.30) roughly equals the social discount rate. This suggests:
- Current US average: ~$15,000/pupil
- OSL: ~$16,000-$18,000/pupil (modest underinvestment)
- Gap: ~$50B nationally
Evidence grade: B (strong causal identification, moderate extrapolation uncertainty)
Worked Example: Pragmatic Clinical Trials
The Highest-Return Public Investment
Metrics affected: Both real after-tax median income growth (via reduced healthcare costs and improved productivity) and median healthy life years (via better treatments). This dual impact contributes to the exceptionally high returns.
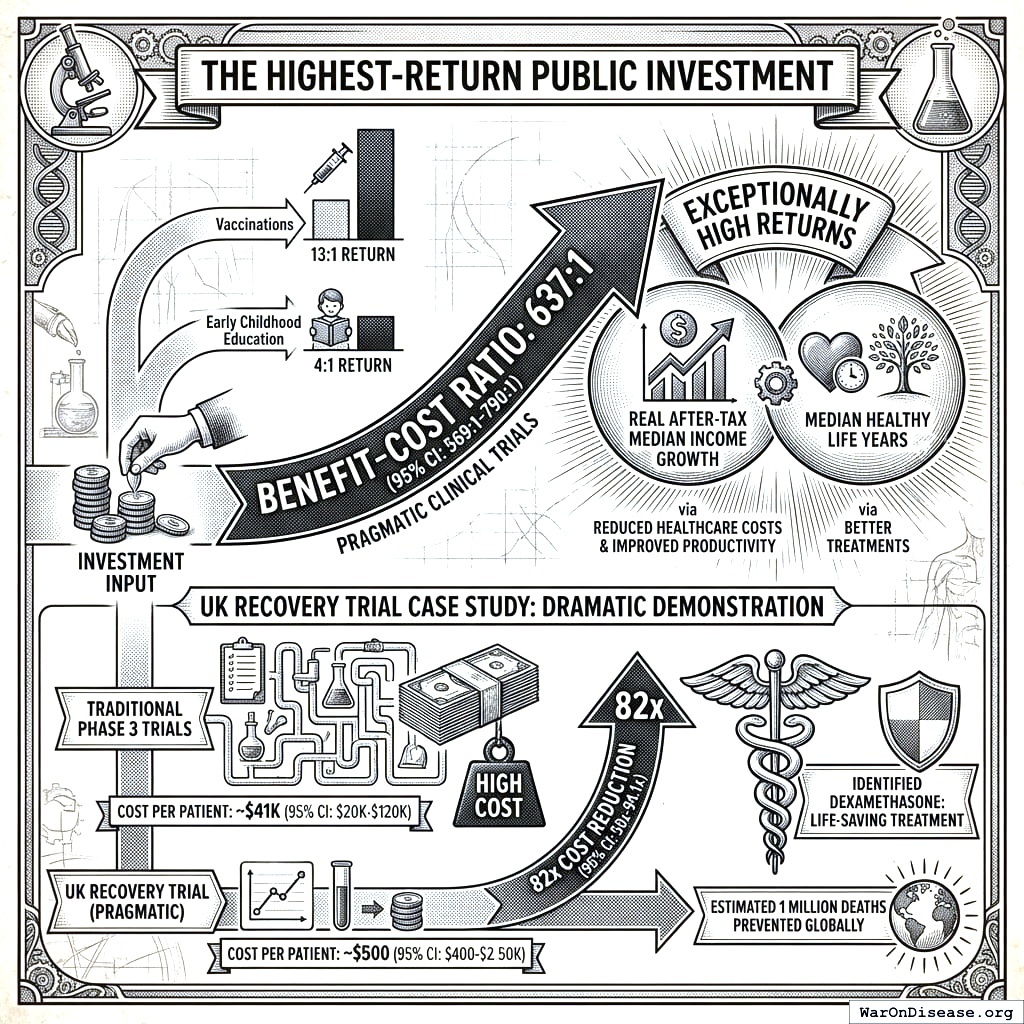
Pragmatic clinical trials represent perhaps the single highest-return category of public investment identified in the literature. While vaccinations return 10.9:1 and early childhood education returns 4:1, pragmatic trials demonstrate benefit-cost ratios of 439 (90% CI: 321-600):144.
The UK’s RECOVERY trial demonstrated this dramatically during COVID-19: it cost approximately $500 (95% CI: $400-$2,500) versus $41,000 (95% CI: $20,000-$120,000) for traditional Phase 3 trials, a 82x (90% CI: 21.4x-195x) cost reduction45. This single trial identified dexamethasone as a life-saving treatment, preventing an estimated 1 million deaths globally.
OSL Estimation
Pragmatic trials represent an innovation frontier where no country has achieved optimal investment. We estimate OSL from cost-effectiveness analysis:
- Unmet medical need: Approximately 2.88 billion DALYs/year (90% CI: 2.63 billion DALYs/year-3.12 billion DALYs/year) from conditions lacking adequate treatment
- Cost per DALY averted: Pragmatic trials cost $929 (95% CI: $929-$1,400) (ADAPTABLE trial) vs. $41,000 (95% CI: $20,000-$120,000) traditional
- Scale-up potential: Current global clinical trial spending is approximately $60 billion (95% CI: $50 billion-$75 billion)/year, but only ~$500M goes to pragmatic/embedded designs
| Data Point | Value | Source |
|---|---|---|
| Current pragmatic trial spending (US) | ~$500M | NIH Common Fund |
| Traditional trial spending (global) | Industry + NIH | |
| Cost per patient (pragmatic) | ADAPTABLE trial | |
| Cost per patient (traditional Phase 3) | Industry average | |
| Cost reduction factor | 44.1x (90% CI: 12.8x-210x) | Calculated |
Diminishing Returns Analysis
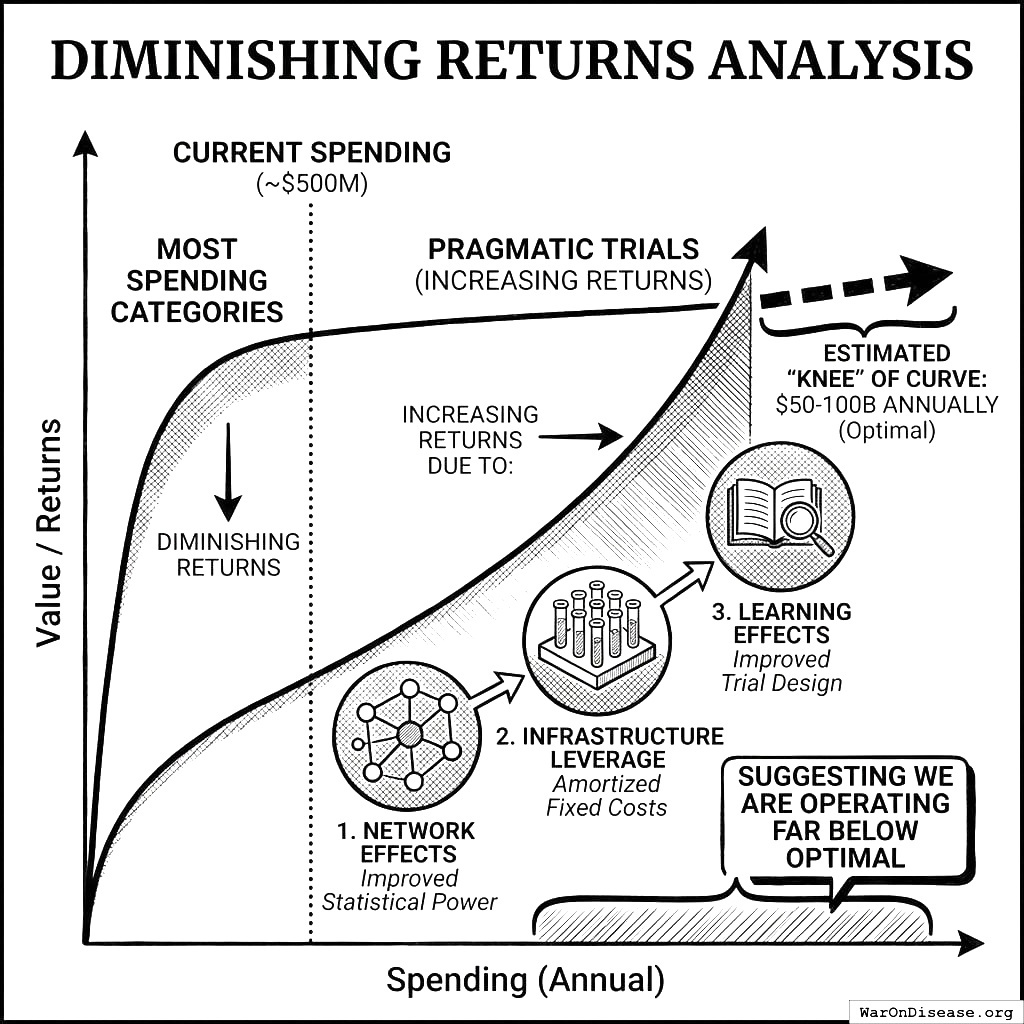
Unlike most spending categories, pragmatic trials show increasing returns at current spending levels due to:
- Network effects: Each additional participant improves statistical power for all trials
- Infrastructure leverage: Platform trials amortize fixed costs across multiple interventions
- Learning effects: Evidence accumulation improves trial design efficiency
The “knee” of the diminishing returns curve is estimated at $50-100B annually (vs. current ~$500M), suggesting we are operating far below optimal.
Cost-Effectiveness Calculation
Using standard health economics methodology:
| Component | Value | Calculation |
|---|---|---|
| Cost per pragmatic trial participant | ADAPTABLE benchmark | |
| QALYs gained per participant | 0.05-0.2 | Evidence generation value |
| Cost per QALY | $4,600-$18,600 | Well below $50K threshold |
| Scale-up population | 50M patients/year | 10% of treatable conditions |
| OSL estimate | $50B/year | Conservative |
Gap Analysis
| Metric | Value |
|---|---|
| Current spending (pragmatic trials) | ~$500M |
| OSL | $50B |
| Gap | +$49.5B (99x underinvestment) |
| Gap % of current | +9,900% |
| Opportunity cost | 439 (90% CI: 321-600):1 foregone returns |
Evidence grade: A (RCT evidence from RECOVERY, ADAPTABLE; strong theoretical foundation)
Why This Category Dominates
Pragmatic clinical trials have the highest priority score of any analyzed category that needs more money:
\[ \text{Priority} = |\text{Gap}| \times \text{BIS} = \$49.5B \times 0.90 = 44.6 \]
The only other derived increase, vaccinations, scores 7.6. Basic research and early childhood have strong evidence that more spending helps, but their OSLs are not derived yet, so they have no priority score. Military spending has a larger absolute priority score (351) because its gap is large, but it is overinvestment that requires a cut.
Cost-Effectiveness Threshold Analysis
The Standard Health Economics Approach
Cost-effectiveness analysis has become the standard framework for health resource allocation decisions11. The QALY (Quality-Adjusted Life Year) puts every health intervention in the same unit, so costs per QALY can be compared with each other and against a willingness-to-pay threshold11,39.
For health interventions, cost-effectiveness analysis provides OSL estimates:
\[ \text{OSL} = \sum_{\text{interventions}} \text{Scale}_i \times \text{Cost}_i \quad \text{where } \frac{\text{Cost}_i}{\text{QALY}_i} < \text{WTP} \]
Where:
- \(\text{Scale}_i\) = target population for intervention \(i\)
- \(\text{Cost}_i\) = per-person cost of intervention \(i\)
- \(\text{QALY}_i\) = QALYs gained per person from intervention \(i\)
- \(\text{WTP}\) = willingness-to-pay threshold (typically $50K-$150K per QALY)
Building Up from Intervention-Level Data
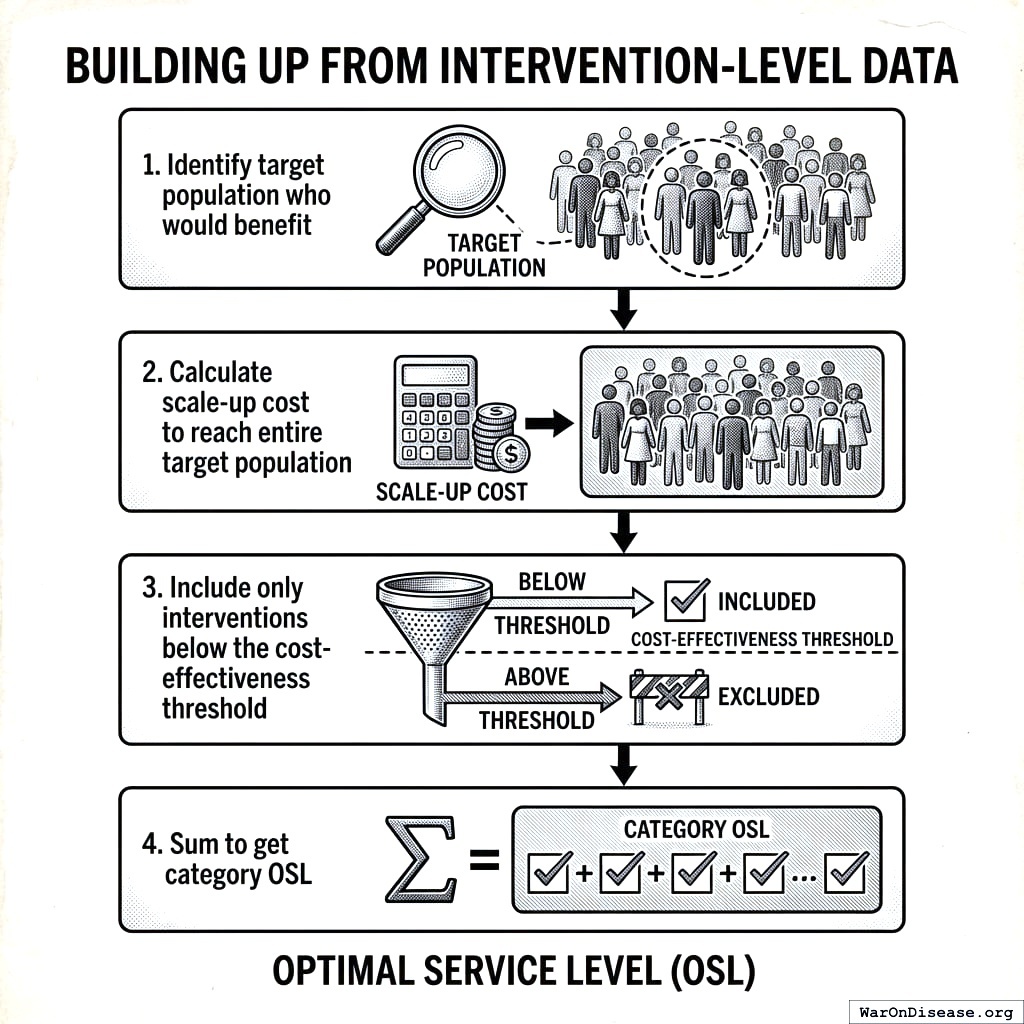
For each health intervention with cost-effectiveness data:
- Identify target population who would benefit
- Calculate scale-up cost to reach entire target population
- Include only interventions below the cost-effectiveness threshold
- Sum to get category OSL
Worked Example: Vaccinations
Primary metric affected: Median healthy life years (via disease prevention and mortality reduction).
Vaccinations are among the highest-return public health investments. Routine US childhood immunization returns about 10.9:1, counting medical and productivity savings46. Across 94 low- and middle-income countries, the return is about 44:1 when the value of longer, healthier lives is counted47, and about 101:1 for reaching the children still missed in 80 of the poorest countries by 203048. The poorer the country and the more of a life the analysis counts, the larger the ratio.
Cost-effectiveness estimates from CEA Registry and CDC vaccination cost studies. QALY estimates reflect average health gains across target populations; costs include vaccine acquisition, administration, and program overhead.
| Intervention | Target pop. | Cost/person | QALY/person | Cost/QALY | Source | Include? |
|---|---|---|---|---|---|---|
| Childhood routine | 4M births | $500 | 0.1 | $5,000 | CDC VFC | Yes |
| HPV vaccination | 4M teens | $300 | 0.05 | $6,000 | CEA Registry | Yes |
| Flu (elderly) | 50M elderly | $40 | 0.01 | $4,000 | CDC | Yes |
| Shingles | 40M eligible | $200 | 0.02 | $10,000 | CEA Registry | Yes |
| COVID boosters | 100M adults | $30 | 0.005 | $6,000 | CDC | Yes |
All interventions fall well below the conventional $50,000-$150,000 per QALY cost-effectiveness threshold, indicating strong economic justification for full scale-up.
OBG calculation:
- Childhood routine: 4M × $500 = $2.0B
- HPV: 4M × $300 = $1.2B
- Flu (elderly): 50M × $40 = $2.0B
- Shingles: 40M × $200 = $8.0B
- COVID boosters: 100M × $30 = $3.0B
- Total OSL: ~$16B (vs. current ~$8B)
Gap: +$8B (underinvestment)
Evidence grade: A (RCT evidence for most vaccines, well-established cost-effectiveness)
Efficiency Frontier Analysis
Waste Versus Diminishing Returns
A dose-response curve fitted through every jurisdiction’s spending and outcomes describes the average government. The average government wastes some of its money, so the average curve mixes two different things: waste and diminishing returns. An efficiency frontier separates them. It traces the most output that any jurisdiction gets at each spending level, with data envelopment analysis30 or stochastic frontier analysis31.
The frontier splits each category’s gap into two parts:
- Waste. This is the distance from a jurisdiction to the frontier. The jurisdiction can remove it by producing the same output at lower cost. Across 20 OECD countries in 2009-2013, the average waste was 26.8% of public spending, and only Switzerland was on the frontier49.
- Reallocation. This is the move along the frontier until the marginal return equals the opportunity cost \(\lambda^*\).
The slope of the frontier at each spending level is the best attainable marginal return, which is the \(f_{im}'\) that Proposition 1 needs. OBG therefore fits dose-response curves to the frontier, not to the average.
Health care is the clearest case. In 2016 the United States spent 17.8% of GDP on health care and ten other high-income countries spent 9.6% to 12.4%, yet US life expectancy was the lowest of the 11 countries and US infant mortality was the highest13. Most of the US gap is distance to the frontier, not a shortage of spending.
Limits. Frontier estimates show correlation, not cause. They are sensitive to outliers and to errors in measured output, and jurisdictions differ in need. An OSL from a frontier alone has a BIS of at most 0.59 until causal evidence on returns supports it.
Worked Example: Military Spending as a Cost Frontier
A cross-country frontier works poorly for defense: few countries face the same threats, and security has no single measured output. Peer spending is also a poor guide, for three reasons:
- A share of GDP measures the economy, not the threat. A target set as a percentage of GDP assumes that defense needs grow with the economy. The threats that defense answers do not grow when the economy grows (The Eisenhower Curve).
- Allied spending is not independent. Smaller alliance members spend a smaller share of income on defense because they benefit from the defense that larger members provide50. Their spending responds to US spending, so it cannot measure what US defense requires.
- Peer spending records an arms race. Each country’s spending rises with its rivals’ spending (see Goals whose value depends on rivals). Copying the equilibrium copies the race.
OBG therefore builds a cost frontier: the least cost, at efficient prices, of each capability that defending the country’s residents requires.
| Threat | Least-cost capability | Annual cost |
|---|---|---|
| Strategic nuclear attack | Survivable second strike | $30 billion (95% CI: $20 billion-$50 billion) |
| Air and missile attack on the homeland | Continental air and missile defense, early warning | $35 billion (95% CI: $25 billion-$50 billion) |
| Maritime and coastal threats | Coast Guard | $14 billion (95% CI: $12 billion-$16 billion) |
| Territorial defense and disaster response | National Guard | $30 billion (95% CI: $24 billion-$40 billion) |
| Cyberattack on critical infrastructure | Cyber defense | $15 billion (95% CI: $10 billion-$25 billion) |
| A peer threat that has not emerged yet | Mobilization hedge: defense R&D, industrial base, professional cadre | $60 billion (95% CI: $40 billion-$100 billion) |
| Cost frontier for defending the United States | $184 billion (90% CI: $158 billion-$215 billion) |
The threat list and the cost of each line are derived in The Eisenhower Curve. The FY2024 US military budget (defense discretionary budget authority) is $886 billion51, so reaching the cost frontier is a cut of $702 billion (90% CI: $671 billion-$728 billion) (79.2% (90% CI: 75.7%-82.2%)). The comparison is budget to budget; actual FY2024 national defense outlays were $874.0 billion52, which would lower the cut by about $12 billion.
Why the higher published figures are not the OSL. Restraint proposals and peer benchmarks scaled to US GDP give roughly $450-675 billion (The Eisenhower Curve). Those figures buy a larger output: a reduced version of the US role in defending other countries. OBG’s welfare function counts the median income and healthy life years of the country’s own residents, so defending other countries counts only through its effect on the risk to those residents. That extra output is in the OSL only if its marginal welfare per dollar beats \(\lambda^*\), and the cost-benefit ledger of hegemony argues that it does not.
Evidence grade: C. The capability costs are stated assumptions, not causal estimates of the return to each dollar, so BIS is 0.50.
Delivery Methods and the Cash Benchmark
A spending category names a goal, not a method. For each goal, OBG compares the delivery methods that could reach it and funds the one with the highest marginal welfare per dollar (Proposition 1).
| Delivery method | Example | Tends to work best when | Evidence example |
|---|---|---|---|
| Direct public provision | Public vaccination programs | The good is shared (herd immunity, clean air) | Vaccination worked example |
| Vouchers | School vouchers | Depends on design and setting | Louisiana’s statewide voucher lowered participants’ math scores by 0.4 standard deviations in the first year53; Washington, DC’s voucher raised high school graduation from 70% to 82%54 |
| Cash transfers | Unconditional cash | People can buy what they need themselves | Associated with about 20% lower mortality among adult women and 8% lower among children under five in 37 countries55 |
| Prizes and advance purchase commitments | Pneumococcal vaccine commitment | A new product is needed and research is uncertain | 56 |
| Payment for results | Outcome contracts, Incentive Alignment Bonds | The outcome is easy to measure | 3 |
| Rule changes | Licensing or approval reform | A rule blocks the goal | See the Optimal Policy Generator2 |
The Cash Benchmark
Cash benchmarking compares a program with giving its cost to the intended beneficiaries in cash57. In a Rwandan youth employment trial, cost-equivalent cash improved more economic outcomes than USAID-funded job training57. OBG applies the same test to every delivery method: a method gets money only if its marginal welfare per dollar beats cash.
Cash does not always win. In US data, direct investments in low-income children’s health and education have the highest marginal value of public funds of any policy type, and many pay for themselves58. The Happier Lives Institute estimates that two lay-delivered psychotherapy programs produce about 40 to 49 WELLBYs per $1,000, five to six times its estimate for cash transfers, although the only randomized trial of one of them found much smaller effects59. Some goals cannot be bought with cash at all. Basic research, clean air, herd immunity, and pragmatic trials are shared goods: no individual buys them with a cash payment. For those goals, the comparison is among public provision, prizes, and payment for results.
To compare methods in one unit, OBG converts each method’s effects to the standardized two-metric welfare units. Where studies report it, OBG also records the marginal value of public funds, a benefit-cost ratio that includes a policy’s effect on government revenue58,60.
Universal Cash Payment as a Budget Category
A universal cash payment (for example, a universal basic income) is a budget category with its own diminishing-returns curve. Each extra dollar is worth less to the same person, and the cost of a universal payment grows with the population. The evidence on cash transfers so far:
| Outcome | Finding | Setting |
|---|---|---|
| Mortality | About 20% lower for adult women and 8% lower for children under five, in an observational difference-in-differences analysis55 | 37 low- and middle-income countries |
| Consumption and well-being | Higher household consumption and large gains in psychological well-being nine months later61 | Randomized trial, rural Kenya |
| Local economy | Each dollar raised local economic activity by about $2.5, with minimal price inflation62. This is a local multiplier in a poor rural economy and does not apply as-is to a national payment in a rich country | Randomized trial, rural Kenya |
| Work | No systematic evidence that transfers discouraged work63 | 7 randomized trials, 6 developing countries |
| Work | No detectable effect on overall employment; part-time work rose 1.8 percentage points64 | Alaska Permanent Fund Dividend |
| Work and well-being | Employment rose slightly (about 6 extra days over one year), and recipients reported better well-being on several measures65 | Randomized experiment, 2,000 unemployed people, Finland |
| Work | $1,000 a month for three years reduced work by about 1 to 2 hours a week and labor market participation by about 4 percentage points66 | Randomized trial, Texas and Illinois (working paper) |
OBG estimates the cash payment’s OSL like any other category: it is the level where the payment’s marginal welfare equals the marginal cost of raising the revenue (Proposition 1). The illustrative example in this paper does not estimate this curve yet.
Lower Taxes as the Final Benchmark
Every dollar of spending must first be raised. The marginal cost of public funds measures the loss to society from raising an additional dollar of government revenue34. When it exceeds one, each dollar of spending costs society more than a dollar. OBG includes this cost as \(C(B)\) in the planner’s problem. If no use of money, including the universal cash payment, beats \(C'(B)\), the optimal budget is smaller and the money stays with taxpayers. The welfare effect of a tax cut can be measured the same way as a program’s, through its marginal value of public funds60.
A universal cash payment and a tax cut both return money to people, but to different people. A flat payment gives the same amount to everyone, while a tax cut returns more to those who pay more tax. Because OBG optimizes median income and median healthy life years, it weighs these two options differently, and the data decide between them.
Budget Impact Score (BIS)
The Budget Impact Score measures confidence in each category’s OSL estimate based on the quality and quantity of causal evidence. The scoring methodology draws on the established evidence hierarchy from the econometrics literature42,67.
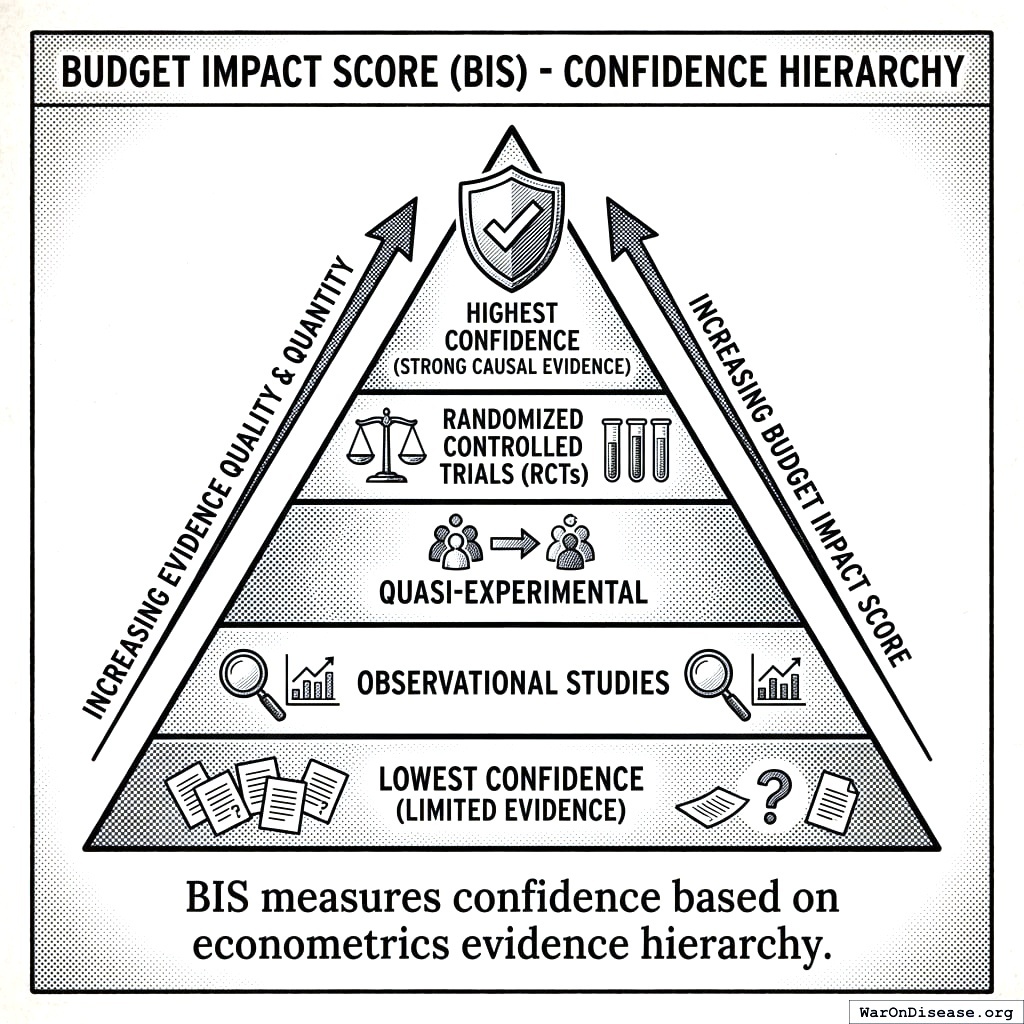
BIS Calculation
For each spending category \(i\):
Step 1: Gather effect estimates
Collect all available causal effect estimates \(\{\beta_{i,1}, \beta_{i,2}, ..., \beta_{i,n_i}\}\) from the econometric literature.
Step 2: Compute quality weights
| Identification Method | Quality Weight (\(w^Q\)) |
|---|---|
| Randomized controlled trial | 1.00 |
| Natural experiment (difference-in-differences, regression discontinuity) | 0.85 |
| Instrumental variables | 0.70 |
| Panel with fixed effects | 0.55 |
| Cross-sectional regression | 0.25 |
Step 3: Compute precision weights
\[ w^P_j = \frac{1}{\text{SE}(\beta_j)^2} \]
Step 4: Compute recency weights
\[ w^R_j = e^{-0.03(t_{now} - t_j)} \]
Step 5: Compute confidence score
\[ \text{BIS}_i = \min\left(1, \frac{\sum_j w^Q_j \cdot w^P_j \cdot w^R_j}{K}\right) \]
Where \(K\) is a calibration constant.
Evidence Grading from BIS
| BIS Range | Grade | Interpretation | OSL Confidence |
|---|---|---|---|
| 0.80 - 1.00 | A | Strong causal evidence | High - proceed with reallocation |
| 0.60 - 0.79 | B | Good evidence | Moderate - proceed with monitoring |
| 0.40 - 0.59 | C | Mixed evidence | Low - pilot before scaling |
| 0.20 - 0.39 | D | Weak evidence | Very low - research priority |
| 0.00 - 0.19 | F | Insufficient evidence | Unknown - cannot estimate OSL |
Gap Analysis and Priority Ranking
Computing Gaps
For each category \(i\):
\[ \text{Gap}_i = \text{OSL}_i - \text{Current}_i \]
- Gap > 0: Underinvestment (increase spending)
- Gap = 0: At optimal (maintain)
- Gap < 0: Overinvestment (decrease spending)
Priority Score
Prioritize reallocation by gap size weighted by confidence:
\[ \text{Priority}_i = |\text{Gap}_i| \times \text{BIS}_i \]
Categories with large gaps AND high confidence should be addressed first.
Illustrative Example: Priority Ranking
The following uses the same illustrative data from the dashboard example above. OSL estimates for pragmatic trials and vaccinations come from the worked examples in this paper, and the military OSL comes from the threat-based cost frontier. The agricultural subsidy OSL comes from the cash benchmark: a payment to one industry must beat giving the same dollar to everyone as cash. The example assumes that farm payments fail this test; the zero is an assumption until the payments’ returns are estimated. BIS scores summarize available causal evidence quality.
| Category | Current | OSL | Gap | BIS | Inc | Hlth | Priority | Action |
|---|---|---|---|---|---|---|---|---|
| Military | Cut $702 billion (90% CI: $671 billion-$728 billion) | 0.50 | − | − | 351 | Decrease | ||
| Pragmatic trials | $0.5B | $50B | +$49.5B | 0.90 | ++ | +++ | 44.6 | Scale 100x |
| Ag subsidies | $25B | $0B | -$25B | 0.59 | − | − | 14.8 | Eliminate |
| Vaccinations | $8B | $16B | +$8B | 0.95 | + | +++ | 7.6 | Increase |
| Basic research | $45B | Not derived | Not derived | ++ | ++ | None | Estimate OSL | |
| Early childhood | $50B | Not derived | Not derived | +++ | + | None | Estimate OSL |
Inc = effect on real after-tax median income growth. Hlth = effect on median healthy life years. Scale: +++ strong, ++ moderate, + weak, − negative. The military priority uses the central gap of about $702B.
Reallocation plan: Cut military spending by $702 billion (90% CI: $671 billion-$728 billion) and agricultural subsidies by $25B, and fund pragmatic clinical trials (+$49.5B) and vaccinations (+$8B). The cuts are much larger than the increases. The difference goes to its highest-value use under Proposition 1: categories whose OSLs are not derived yet (basic research and early childhood have the strongest evidence of benefit; see Appendix C), a universal cash payment, or lower taxes. This example does not estimate those marginal values yet, so it leaves the difference unassigned rather than choosing a use arbitrarily. Among the derived increases, pragmatic trials have the highest priority score because of extreme underinvestment combined with strong evidence, and they improve both welfare metrics.
Multi-Unit Reporting
The Problem with Abstract Scores
Composite scores (like 0-1 BIS values) obscure interpretability. Policymakers and citizens understand dollars, lives, and years - not abstract indices.
Reporting at Multiple Levels
| Level | Units | Use Case | Example |
|---|---|---|---|
| 0. Core metrics | pp/year income growth, healthy life years | Primary welfare outcomes | “+0.1 pp income growth, +0.05 healthy years” |
| 1. Natural | Domain-specific | Interpretation within domain | “Education: $2,100/student gap” |
| 2. Monetized | $ equivalent | Cross-domain comparison | “Expected welfare gain: $4.00 per $1” |
| 3. Health | QALYs/DALYs | Health-weighted comparison | “12,000 QALYs per $1B invested” |
| 4. Composite | 0-1 score | Ranking when monetization uncertain | “BIS = 0.85” |
Level 0 (Core Metrics) reports expected changes to the two welfare metrics directly. All other levels are derived from or convertible to these core outcomes. QALYs (Level 3) translate directly to median healthy life years. Monetized values (Level 2) combine income effects with health effects valued at standard rates.
Conversion Factors
| Conversion | Value | Source | Notes |
|---|---|---|---|
| Value of Statistical Life (VSL) | ~$10M | EPA, DOT | US regulatory standard |
| Value per QALY | $50K-$150K | ICER, WHO | Context-dependent |
| QALY → $ | $100K/QALY | Mid-range estimate | For cross-domain |
| Life-year → QALY | ~0.8-1.0 | Age/health adjusted | Quality weighting |
Worked Example: Multi-Unit Output
Category: Early Childhood Education (a hypothetical $20B increase; the OSL is not derived)
| Unit Level | Value | Interpretation |
|---|---|---|
| Natural | +$20B increase | Current: $50B; OSL not derived |
| Per-child | +$833/child | 24M children |
| Monetized ROI | ~4:1 benefit-cost (5% discount, conservative crime costs); 7-10% annual social return | 68 |
| Health (QALYs) | +8K QALYs/year | Per $1B additional |
| Composite (BIS) | Not graded | Randomized evidence of effects (small samples), but no derived OSL |
Recommendation: The evidence that more spending helps is strong; the level where returns fall to the opportunity cost is not derived. If Perry-level returns held at national scale, a $20B increase would yield about $80B in discounted benefits, about $60B net of cost.
Quality Requirements and Validation
Minimum Thresholds for OBG Estimation
| Criterion | Minimum | Rationale |
|---|---|---|
| Reference countries | 5+ | Avoid outlier bias |
| Dose-response studies | 3+ | Identify diminishing returns |
| Causal effect estimates | 2+ | Cross-validate |
| Data recency | Within 10 years | Relevance |
| BIS for reallocation | > 0.40 | Sufficient confidence |
Robustness Checks
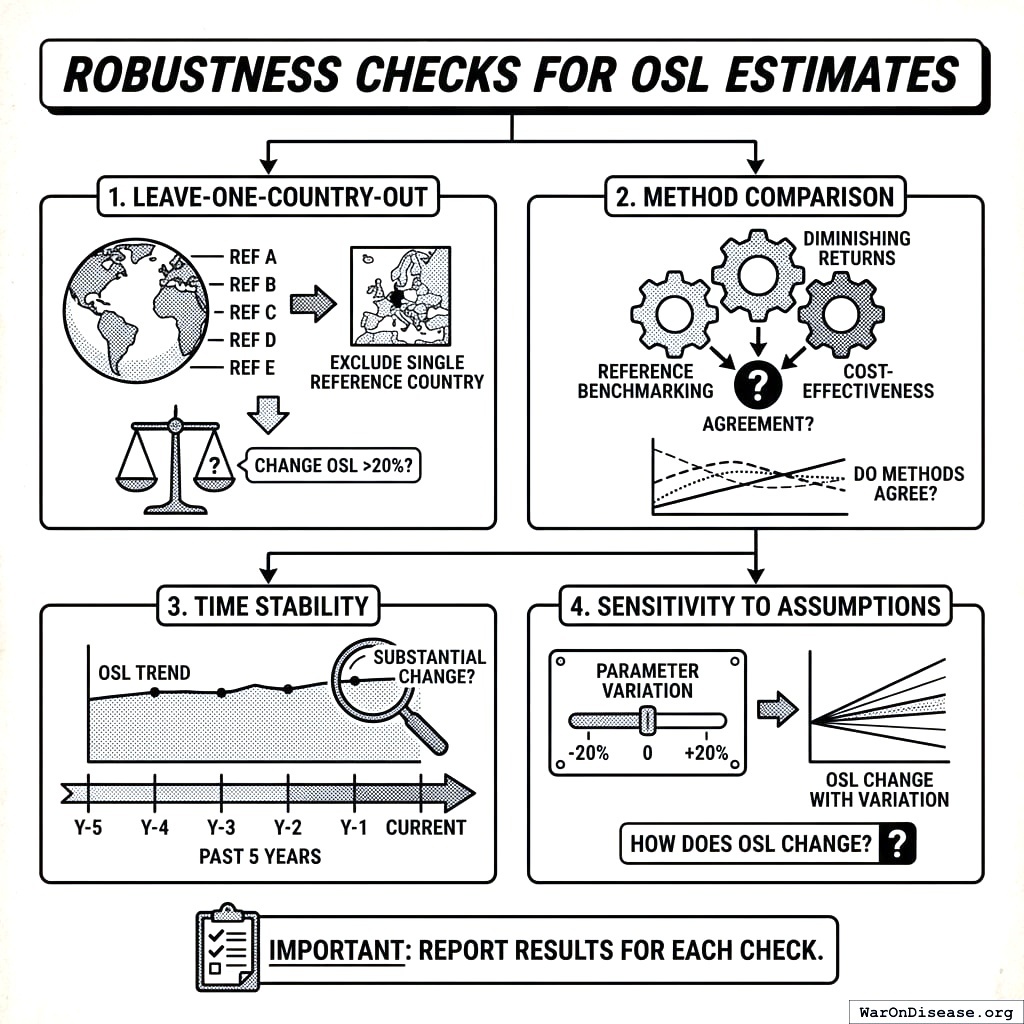
For each OSL estimate, report:
- Leave-one-country-out: Does excluding any single country change OSL by >20%?
- Method comparison: Do diminishing returns and cost-effectiveness methods agree?
- Time stability: Has OSL changed substantially over past 5 years?
- Sensitivity to assumptions: How does OSL change with ±20% parameter variation?
Interpreting Results
Gap Ranges and Recommended Actions
| Gap (% of current) | Interpretation | Recommended Action |
|---|---|---|
| > +50% | Severe underinvestment | Immediate scale-up |
| +20% to +50% | Moderate underinvestment | Phased increase |
| -10% to +20% | Near optimal | Monitor, fine-tune |
| -50% to -10% | Moderate overinvestment | Gradual reduction |
| < -50% | Severe overinvestment | Urgent reallocation |
What the Algorithm Cannot Tell You
| Factor | OBG Captures | OBG Does Not Capture |
|---|---|---|
| Evidence-optimal spending level | Yes | |
| Confidence in estimates | Yes | |
| Direction of reallocation | Yes | |
| Political feasibility | No | |
| Implementation capacity | No | |
| Transition costs | No | |
| Distributional effects | No | |
| Novel interventions | No |
OBG provides evidence-based targets. Political judgment is still required for implementation strategy.
Pilot Program Prioritization
Value of Information for Uncertain Categories
Categories with low BIS but potentially high returns warrant research investment:
\[ \text{VOI}_i = \text{Potential Gap}_i \times (1 - \text{BIS}_i) \times P(\text{high return}) \]
High-VOI categories should receive pilot funding to generate better evidence.
Recommended Pilot Designs
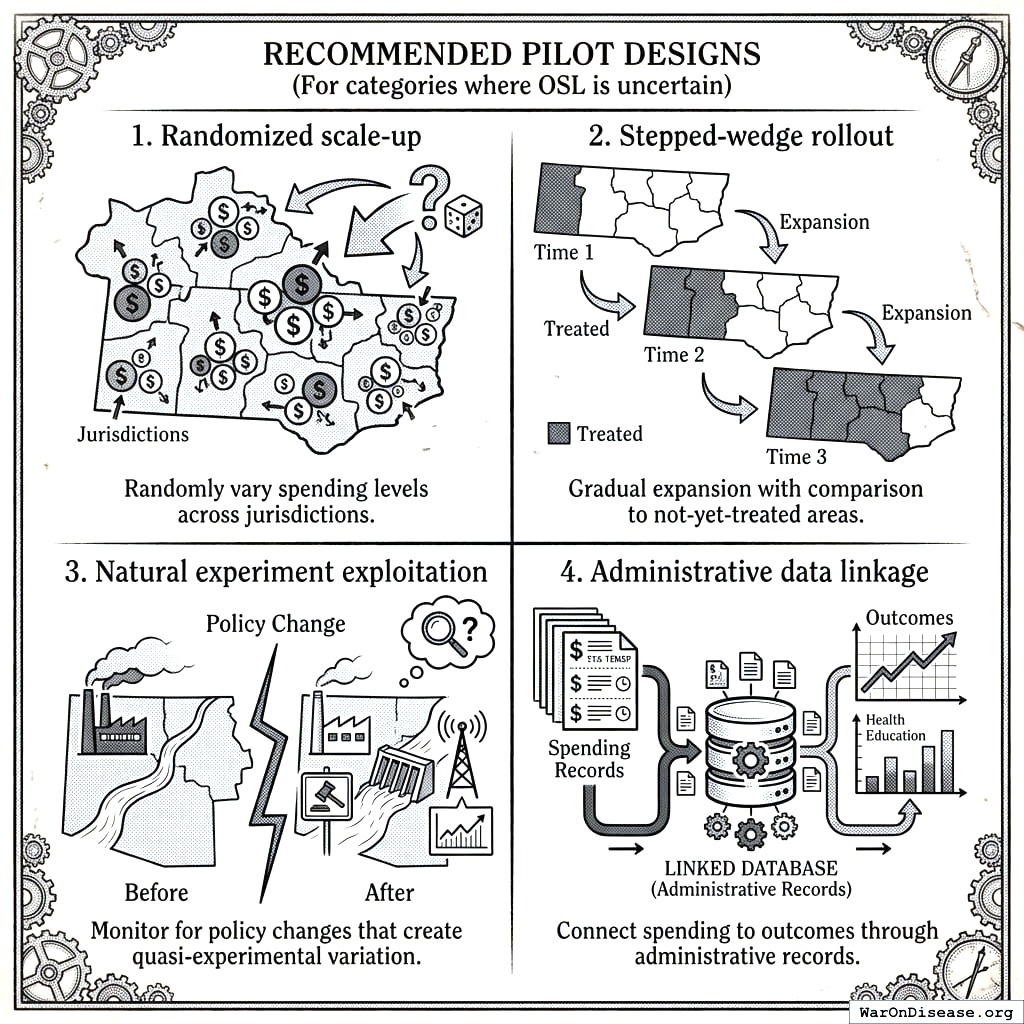
For categories where OSL is uncertain:
- Randomized scale-up: Randomly vary spending levels across jurisdictions
- Stepped-wedge rollout: Gradual expansion with comparison to not-yet-treated areas
- Natural experiment exploitation: Monitor for policy changes that create quasi-experimental variation
- Administrative data linkage: Connect spending to outcomes through administrative records
Learning Feedback Loop
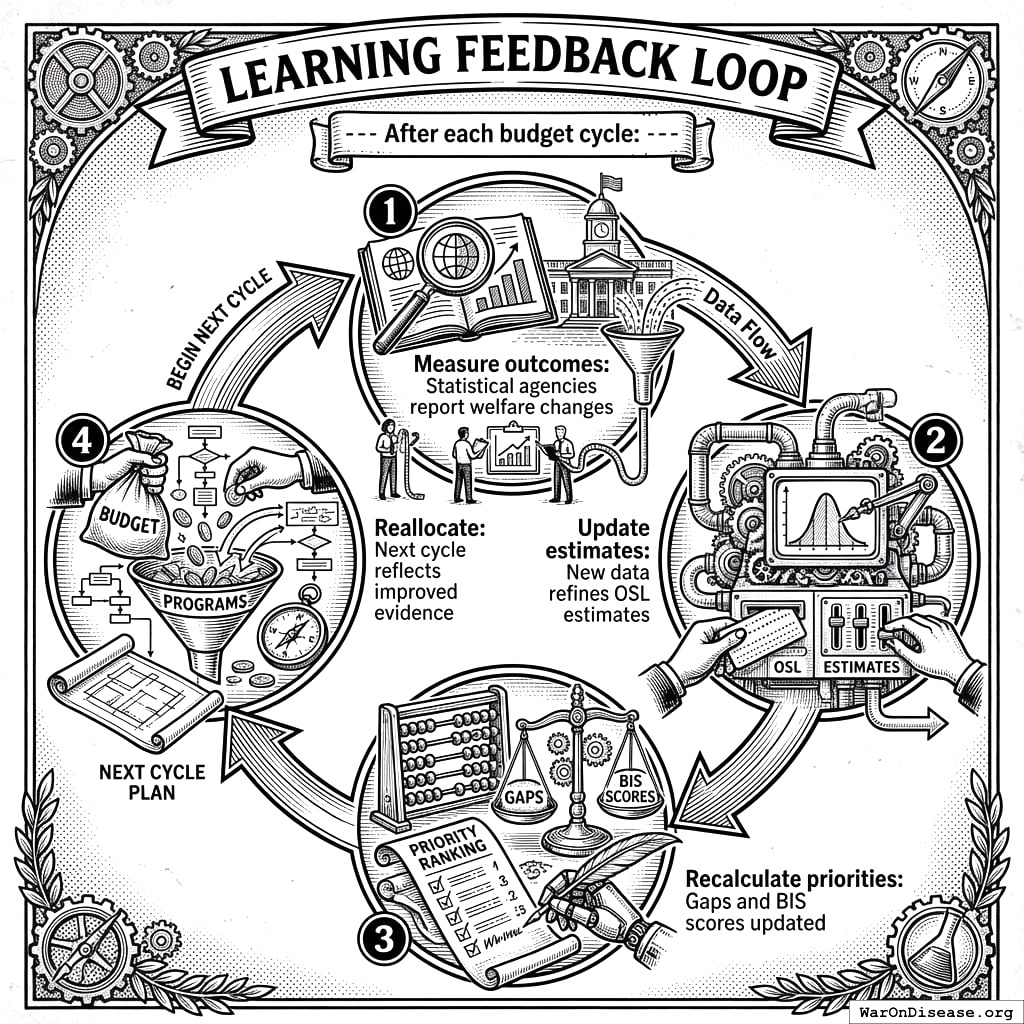
After each budget cycle:
- Measure outcomes: Statistical agencies report welfare changes
- Update estimates: New data refines OSL estimates
- Recalculate priorities: Gaps and BIS scores updated
- Reallocate: Next cycle reflects improved evidence
Data Sources
Cross-Country Databases
International organizations maintain standardized cross-country spending and outcome data essential for diminishing returns analysis. The OECD provides the most comprehensive harmonized data for high-income countries12.
| Database | Coverage | URL | Use Case |
|---|---|---|---|
| OECD iLibrary | 38 OECD members | oecd-ilibrary.org69 | Education, health, social spending |
| World Bank WDI | 217 countries | data.worldbank.org70 | Broad spending and outcomes |
| SIPRI | Global | sipri.org71 | Military spending |
| WHO GHED | 194 countries | who.int/data/gho72 | Health expenditure |
| UNESCO UIS | Global | uis.unesco.org73 | Education spending |
Cost-Effectiveness Databases
| Database | Coverage | URL | Use Case |
|---|---|---|---|
| CEA Registry | 8,000+ analyses | cearegistry.org74 | Health cost-effectiveness |
| Disease Control Priorities | LMICs | dcp-3.org75 | Global health priorities |
| Cochrane Library | 8,000+ reviews | cochranelibrary.com76 | Health intervention effects |
| Copenhagen Consensus | Development | copenhagenconsensus.com77 | Development priorities |
These databases enable systematic ranking of interventions by cost-effectiveness. For example, GiveWell’s 2011 analysis, which it now marks out of date, put deworming at about $28 to $70 per DALY averted for schistosomiasis and about $83 for soil-transmitted worms; GiveWell now judges deworming mainly by its later effect on income78.
US Budget Data
| Source | Coverage | URL | Use Case |
|---|---|---|---|
| OMB Historical Tables | 1789-present | whitehouse.gov/omb79 | Federal spending |
| CBO Budget Analyses | Federal | cbo.gov80 | Fiscal impact scoring10 |
| USASpending | Federal awards | usaspending.gov81 | Program-level detail |
| Census of Governments | State & local | census.gov82 | Subnational spending |
Limitations
Diminishing Returns Uncertainty
- Functional form: True relationship may not match assumed function
- Extrapolation: Estimating returns outside observed spending range
- Interaction effects: Returns may depend on other spending categories
Mitigation: Report confidence intervals, use multiple functional forms, acknowledge extrapolation limits.
Status-Quo Bias in the Evidence Base
Most program evaluations study programs that governments already run. Delivery methods that no government has tried, or tried only at small scale, have little evidence and so receive low BIS scores. Without correction, this would bias OBG toward existing public programs. OBG corrects for it in three ways: every program must beat a universal cash payment and lower taxes, neither peer spending nor current spending can set a target, and low-evidence methods with high potential returns receive pilot funding instead of exclusion.
Mitigation: Report which OSLs are not derived, fund pilots of untried delivery methods, and update OSLs as new evidence arrives.
Implementation Capacity
Higher spending may not translate to outcomes if implementation capacity is lacking.
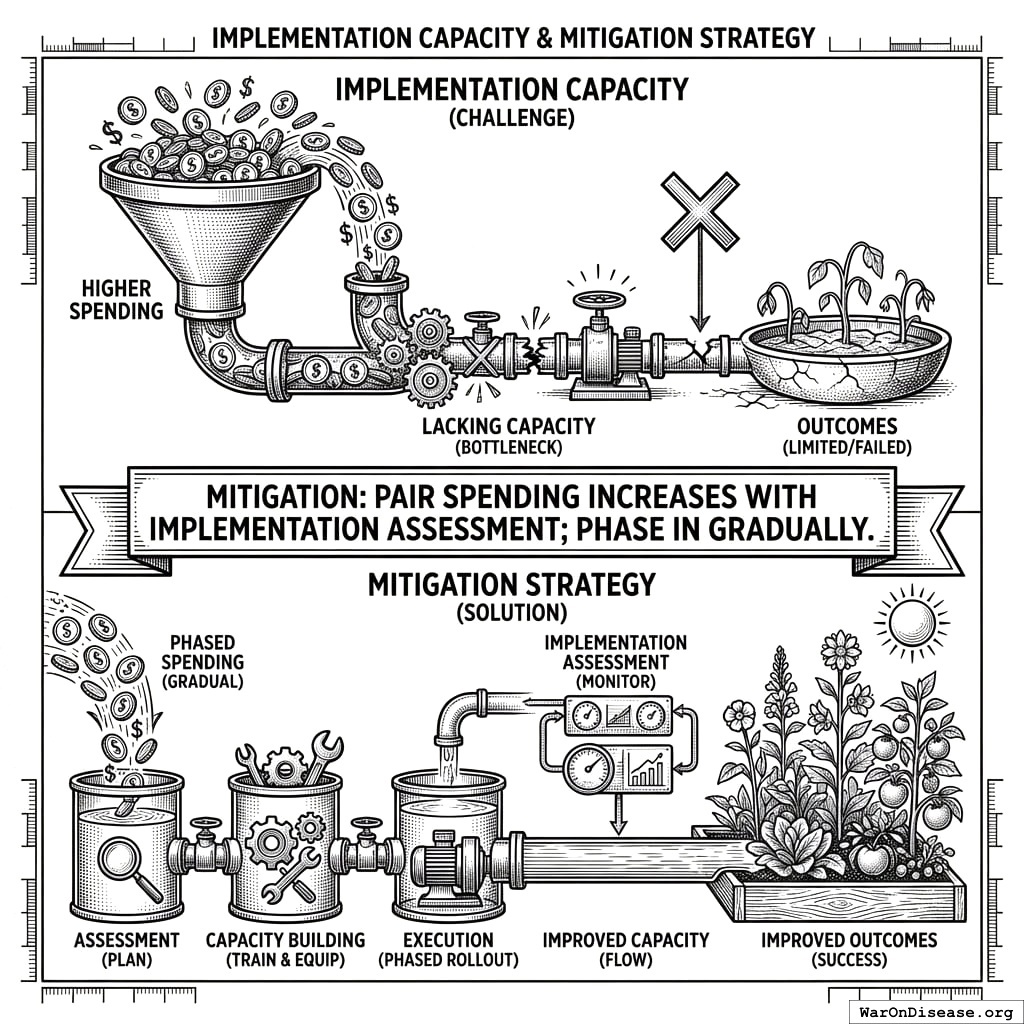
Mitigation: Pair spending increases with implementation assessment; phase in gradually.
Benchmarking Framework
This section defines how OBG should be benchmarked against historical and prospective budget outcomes.
Retrospective Validation
Question: Did jurisdictions that moved toward OSL achieve better outcomes than those that diverged?
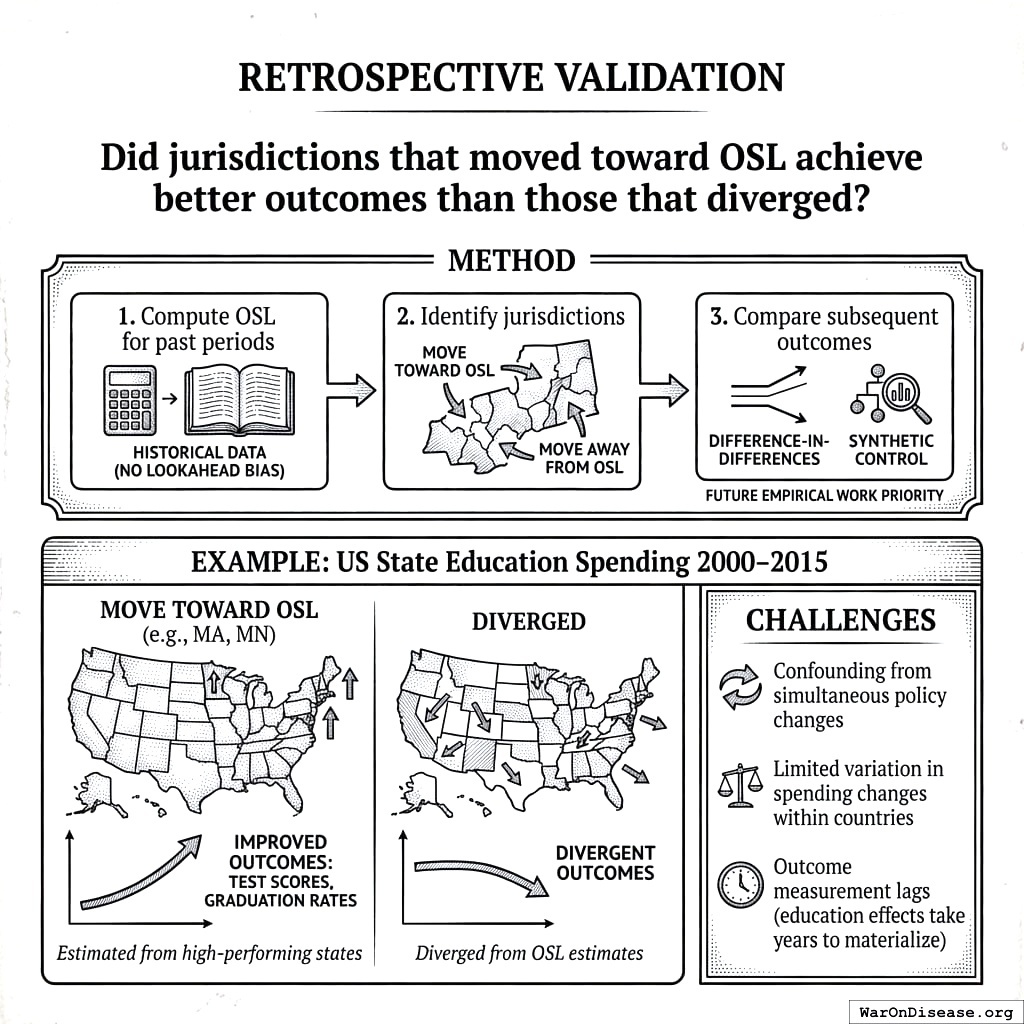
Method: 1. Compute OSL for past periods using only data available at that time (to avoid lookahead bias) 2. Identify jurisdictions that moved toward/away from OSL 3. Compare subsequent outcomes using difference-in-differences or synthetic control methods83
Example: US State Education Spending 2000-2015
A retrospective analysis can examine whether states that moved toward education OSL (estimated from high-performing states like Massachusetts and Minnesota) subsequently showed improved test scores and graduation rates relative to states that diverged.
Challenges:
- Confounding from simultaneous policy changes
- Limited variation in spending changes within countries
- Outcome measurement lags (education effects take years to materialize)
Prospective Validation
Question: Do OBG-guided reallocations improve outcomes going forward?
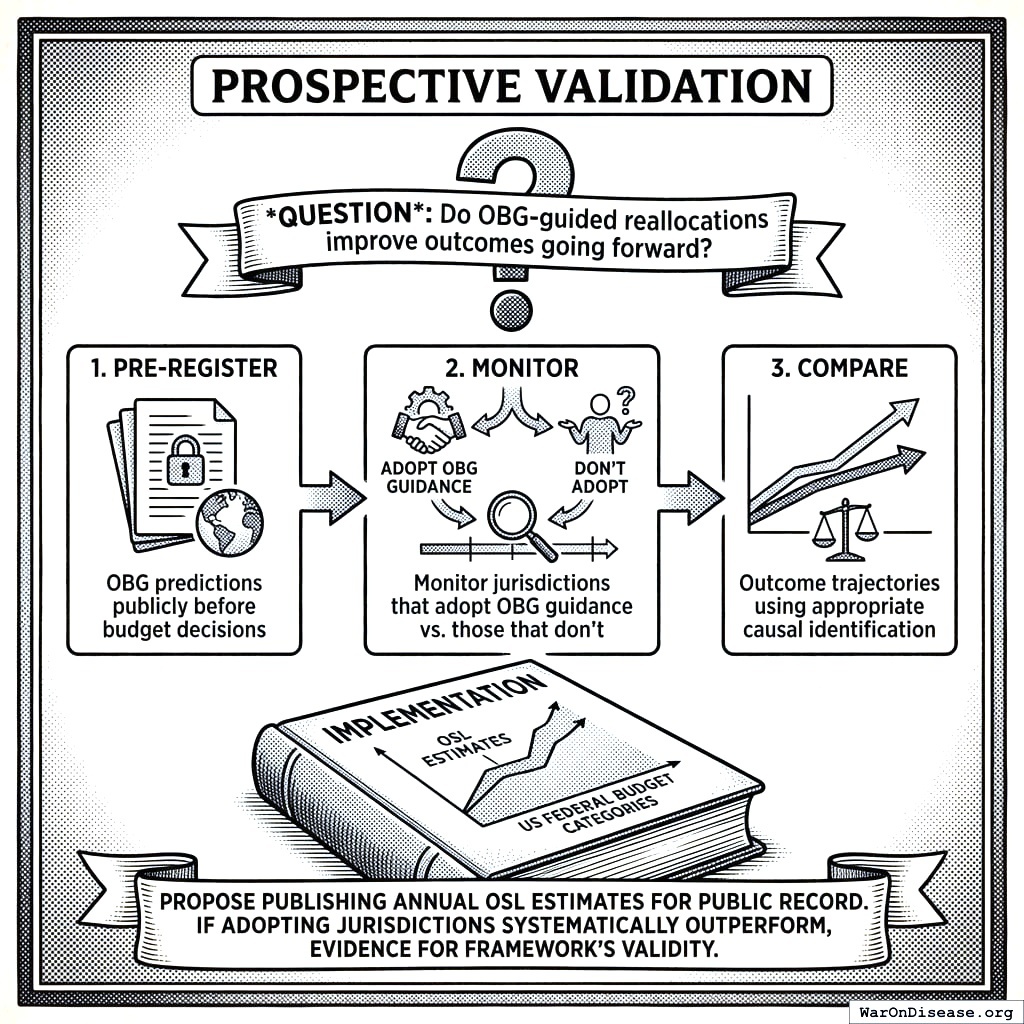
Method: 1. Pre-register OBG predictions publicly before budget decisions 2. Monitor jurisdictions that adopt OBG guidance vs. those that don’t 3. Compare outcome trajectories using appropriate causal identification
Implementation: Publish annual OSL estimates for US federal budget categories, creating a public record for prospective benchmarking. If jurisdictions that adopt OBG guidance systematically outperform those that do not, the framework is doing its job.
Success Metrics
| Metric | Definition | Target | Interpretation |
|---|---|---|---|
| Gap reduction | Did spending move toward OSL? | > 50% of gap closed in 10 years | Tests political feasibility |
| Outcome improvement | Did welfare metrics improve more in OBG-following jurisdictions? | > 10% relative improvement | Tests welfare prediction accuracy |
| Prediction accuracy | Did estimated returns match actual returns? | Correlation r > 0.5 | Tests underlying model |
| Cross-method consistency | Do diminishing returns and cost-effectiveness methods converge? | Agreement within 30% | Tests methodological robustness |
Evidence Base and Benchmarking
OBG rests on the underlying studies cited throughout (e.g.,43 for education,46 and47 for vaccinations) plus a continuous benchmarking program:
- Data collection: Longitudinal spending and outcome data across jurisdictions
- Historical OSL estimation: Compute past OSL using only contemporaneously available data
- Causal analysis: Identify spending → outcome effects with strong quasi-experimental designs
- Publication: Publish pre-registered benchmark studies and annual scorecards
Sensitivity Analysis
Parameter Sensitivity
| Parameter | Default | Test Range | Impact on OSL |
|---|---|---|---|
| Country data set | All OECD | OECD + G20, High-income only | ±15% |
| Discount rate | 5% | 3-7% | ±20% |
| BIS confidence threshold | 0.40 | 0.30-0.60 | Category inclusion |
| Recency decay rate | 0.03/year | 0.01-0.05 | Estimate weights |
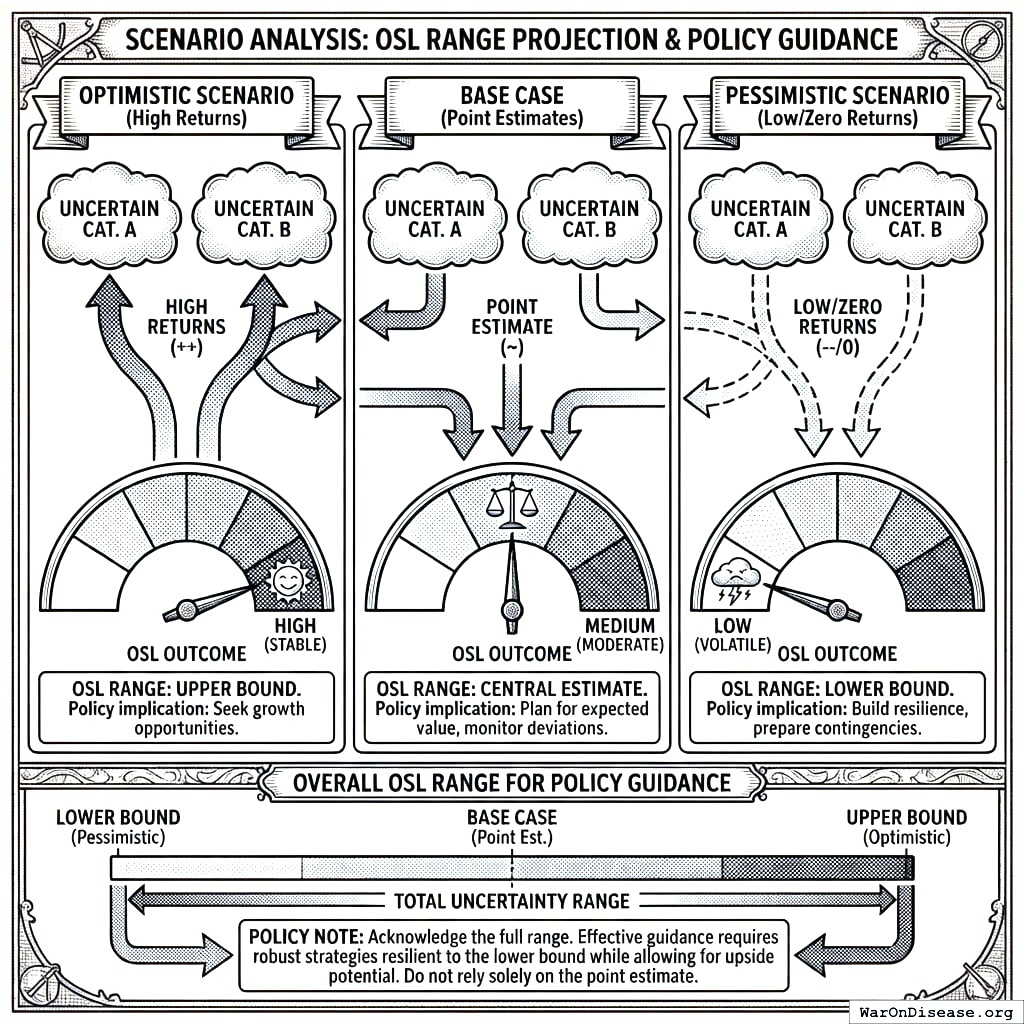
Scenario Analysis
Optimistic scenario: All uncertain categories have high returns Pessimistic scenario: Uncertain categories have low/zero returns Base case: Use point estimates
Report OSL range across scenarios for policy guidance.
Conclusion
The Optimal Budget Generator framework provides a systematic, evidence-based approach to budget allocation. Unlike marginal-return frameworks that can justify infinite spending on high-return categories, OBG recognizes that every category has an optimal level - like the Recommended Daily Allowance for nutrients.
The framework answers three questions:
- What is the target? OBG provides evidence-based spending levels for each category
- How far are we? Gap analysis shows where current spending diverges from optimal
- How confident are we? BIS scores evidence quality so policymakers know which OSL estimates are reliable
Even with imperfect evidence, systematically moving from severe misallocation (in the illustrative example, military spending $702 billion (90% CI: $671 billion-$728 billion) above the cost of defending the country, and vaccinations 50% below their derived OSL) toward evidence-based targets should produce substantially larger welfare gains than current lobbying-driven allocation achieves. Because every program must beat a universal cash payment and lower taxes, those gains do not depend on keeping today’s total budget or today’s programs.
Acknowledgments
The author thanks seminar participants and anonymous reviewers for helpful comments and suggestions. All errors remain the author’s own.
Appendix A: Analysis Workflow
Complete OBG Analysis Pipeline
+-------------------------------------------------------------+
|                    OBG ANALYSIS WORKFLOW                      |
+-------------------------------------------------------------+

Phase 1: DATA COLLECTION
-------------------------
1. Budget data ingestion
   +-- Pull current spending by category (OMB, USASpending)

   +-- Normalize categories to standard taxonomy
   +-- Identify subcategories for detailed analysis
   +-- Flag data quality issues

2. Cross-country spending data
   +-- Pull spending data from OECD, World Bank
   +-- Include all comparable countries
   +-- Normalize to per-capita and % GDP
   +-- Prepare for regression analysis

3. Effect estimate data
   +-- Search systematic reviews and meta-analyses
   +-- Extract effect sizes with standard errors
   +-- Code study quality (RCT, natural experiment, etc.)
   +-- Build literature database by category

Phase 2: OSL ESTIMATION
-----------------------
4. Diminishing returns modeling
   +-- Fit nonlinear spending-outcome functions
   +-- Identify "knee" of curve
   +-- Calculate marginal returns at current spending
   +-- Estimate optimal level

5. Cost-effectiveness analysis (health/life-saving)
   +-- Identify interventions below CE threshold
   +-- Calculate scale-up costs
   +-- Sum to category OSL
   +-- Document assumptions

6. Method reconciliation
   +-- Compare OSL estimates across methods
   +-- Weight by method reliability
   +-- Produce consensus OSL estimate
   +-- Flag discrepancies

Phase 3: EVIDENCE QUALITY
-------------------------
7. BIS calculation
   +-- Compute quality weights per study
   +-- Compute precision weights
   +-- Compute recency weights
   +-- Aggregate to category BIS

8. Evidence grading
   +-- Assign A-F grade based on BIS
   +-- Document key evidence
   +-- Identify research gaps
   +-- Flag high-uncertainty categories

Phase 4: GAP ANALYSIS
---------------------
9. Compute gaps
    +-- Gap = OSL - Current
    +-- Calculate % gap
    +-- Classify as under/over/optimal
    +-- Apply BIS weighting

10. Priority ranking
    +-- Priority = |Gap| × BIS
    +-- Rank categories
    +-- Identify reallocation pairs
    +-- Estimate welfare gains

Phase 5: OUTPUT GENERATION
--------------------------
11. Multi-unit reporting
    +-- Natural units ($/capita, % GDP)
    +-- Monetized (ROI, opportunity cost)
    +-- Health units (QALYs where applicable)
    +-- Composite (BIS, evidence grade)

12. Sensitivity analysis
    +-- Vary key parameters
    +-- Test country data subsets
    +-- Report OSL ranges
    +-- Identify robust conclusions

13. Documentation
    +-- Generate category reports
    +-- Create methodology audit trail
    +-- Version control estimates
    +-- Publish to dashboard/API
Appendix B: Glossary
Core Concepts
- Optimal Budget Generator (OBG): The framework/methodology for generating integrated budget recommendations based on evidence of spending-outcome relationships. OBG chooses both the size and the composition of the budget, comparing every use of money with a universal cash payment and with lower taxes, and produces Optimal Spending Level (OSL) estimates for each goal.
Optimal Spending Level (OSL): The evidence-based target spending level for each category, produced by the OBG framework. \(\text{OSL}_i\) represents the optimal spending level for category \(i\). Below OSL indicates underinvestment; above OSL indicates diminishing returns.
Budget Impact Score (BIS): A 0-1 score measuring confidence in each category’s OSL estimate based on the quality and quantity of causal evidence. Higher BIS indicates more reliable OSL recommendations.
Spending Gap: The difference between current spending and the evidence-based target for each category. Positive gaps indicate underinvestment; negative gaps indicate overinvestment.
Diminishing Returns: The economic principle that marginal returns to spending decrease as spending increases. The optimal level is where marginal return equals opportunity cost.
Estimation Methods
Cost-Effectiveness Threshold: The maximum acceptable cost per QALY (or other health outcome) for including an intervention in target calculations. Typically $50K-$150K per QALY.
Dose-Response Curve: The relationship between spending level (dose) and outcome (response). Used to identify diminishing returns and estimate optimal spending levels.
Efficiency Frontier: The most output that any jurisdiction gets at each spending level. The distance to the frontier is waste; the frontier’s slope is the best attainable marginal return.
Cost Frontier: The least cost, at efficient prices, of each capability a goal requires. OBG uses it for defense, where no single output can be measured across countries.
Evidence Quality
Quality Weight (\(w^Q\)): Weight assigned to a study based on identification strategy. RCTs receive 1.0; cross-sectional studies receive 0.25.
Precision Weight (\(w^P\)): Weight assigned based on standard error. More precise estimates receive higher weight.
Recency Weight (\(w^R\)): Weight assigned based on publication date. More recent studies receive higher weight via exponential decay.
Evidence Grade: Letter grade (A-F) summarizing confidence in each category’s target estimate. A = strong evidence; F = insufficient evidence.
Output Concepts
Priority Score: Product of gap magnitude and BIS. Used to rank categories for reallocation priority.
Value of Information (VOI): Expected benefit of additional research on uncertain categories. High-VOI categories warrant pilot funding.
Multi-Unit Reporting: Presenting results in natural units, monetized equivalents, health units, and composite scores for interpretability.
Appendix C: Illustrative Comparison to US Budget
This appendix applies the OBG methodology to US federal budget categories as an illustrative exercise. “Current” figures are approximate FY2024 spending. The military row is FY2024 defense discretionary budget authority51; the Social Security, Medicare, Medicaid, and net interest rows are FY2024 outlays. Each OSL has a stated basis: a worked example (pragmatic trials and vaccinations), the threat-based cost frontier (military), or the cash benchmark (agricultural subsidies, as an assumption). The K-12 worked example covers total K-12 spending, which is mostly state and local, so it does not set the federal education row. Rows marked “Not derived” have evidence on the direction of change only; OBG does not set their OSLs as a multiple of current spending. BIS scores summarize the strength of the causal evidence.
Illustrative data. These figures show the output format, not recommendations. Rows marked “Not derived” show the direction of the evidence only.
Illustrative US Federal Spending vs. OSL Targets
| Category | Current | OSL | Gap | Basis | BIS | Inc | Hlth | Priority |
|---|---|---|---|---|---|---|---|---|
| Military | Cut $702 billion (90% CI: $671 billion-$728 billion) (79.2% (90% CI: 75.7%-82.2%)) | Cost frontier | 0.50 | − | − | 351 | ||
| Pragmatic clinical trials | $0.5B | $50B | +$49.5B (+9,900%) | Worked example | 0.90 | ++ | +++ | 44.6 |
| Agricultural subsidies (mostly mandatory) | $25B | $0 | -$25B (-100%) | Cash benchmark (assumed) | 0.59 | − | − | 14.8 |
| Vaccinations | $8B | $16B | +$8B (+100%) | Worked example | 0.95 | + | +++ | 7.6 |
| Health research | $50B | Not derived | Increase likely | Direction only | + | +++ | ||
| Infrastructure | $100B | Not derived | Increase likely | Direction only26 | ++ | + | ||
| Basic research | $45B | Not derived | Increase likely | Direction only28 | ++ | ++ | ||
| Education (federal) | $80B | Not derived | Increase likely | Direction only43 | +++ | + | ||
| Early childhood | $50B | Not derived | Increase likely | Direction only68 | +++ | + | ||
| Universal cash payment | $0 | Not estimated | Outside option | ++ | + | |||
| Social Security | $1,461B | Not estimated | Cash transfer to retirees; competes with the universal cash payment | |||||
| Medicare (net of premiums) | $874B | Not estimated | Frontier analysis of health care delivery | |||||
| Medicaid (federal grants to states) | $618B | Not estimated | Frontier analysis of health care delivery | |||||
| Net interest | $882B | Not a choice | Set by past borrowing |
Inc = effect on real after-tax median income growth. Hlth = effect on median healthy life years. Scale: +++ strong positive, ++ moderate, + weak, − negative. Rows with a derived OSL are sorted by priority; the military priority uses the central gap of about $702B. Pragmatic trials may be funded through health research agencies, so those two rows can overlap. Social Security, Medicare, Medicaid, and net interest are FY2024 net outlays from the Monthly Treasury Statement52.
Key findings:
- Extreme underinvestment in pragmatic trials: Current spending is about 1% of the OSL. The platform that runs these trials returns 439 (90% CI: 321-600):1 in R&D cost savings alone (see the pragmatic trials worked example).
- Overinvestment in military spending: Defending the country, priced one threat at a time, costs $184 billion (90% CI: $158 billion-$215 billion), so reaching the OSL is a cut of $702 billion (90% CI: $671 billion-$728 billion). Peer-country benchmarks give a higher figure only because they price a smaller version of the US role in defending other countries (see the military worked example).
- Underinvestment in outcomes: Vaccinations sit 50% below their derived OSL. Health research, basic research, and early childhood have strong evidence that more spending helps, but their OSLs are not derived yet.
- Spending that fails the cash benchmark: The example assumes that agricultural subsidies fail it, so their OSL is zero until their returns are estimated.
- Most of the budget is not estimated yet: Social Security, Medicare, Medicaid, and net interest were 57% of the $6.75 trillion in FY2024 federal outlays52. Medicare and Medicaid are the main candidates for frontier analysis, because the United States spends far more on health care than peer countries that have better outcomes13. Social Security is a cash transfer to retirees, so it competes with the universal cash payment. Net interest is set by past borrowing.
- Reallocation potential: The listed cuts exceed the listed increases. The difference goes to its highest-value use under Proposition 1, which can be a category not listed here, a universal cash payment, or lower taxes. The example does not estimate those marginal values yet, so it does not assign the difference.
Corresponding Author: Mike P. Sinn, Institute for Accelerated Medicine ([email protected])
Conflicts of Interest: The author declares no conflicts of interest.
Funding: This work received no external funding.
Data Availability: All data sources referenced in this paper are publicly available: OECD iLibrary (education, health spending), World Bank WDI (cross-country indicators), SIPRI Military Expenditure Database (defense spending), and CDC vaccination cost data. URLs are provided in the Data Sources section. A complete replication package including analysis code, data extraction scripts, and worked example calculations will be deposited in a public repository (GitHub/Zenodo) upon publication.
Ethics Statement: This is a methodological specification. No human subjects research was conducted.