Ubiquitous Pragmatic Trial Impact Analysis: How to Prevent a Year of Death and Suffering for 84 Cents
Abstract
Of 9.5 million combinations (90% CI: 6.68 million combinations-12.8 million combinations) plausible drug-disease pairings, only 0.342% (90% CI: 0%-1%) have been clinically tested. At the current discovery rate of 15 diseases/year (95% CI: 8 diseases/year-30 diseases/year), clearing this backlog would take ~443 years (90% CI: 255 years-841 years). An open protocol integrating pragmatic clinical trials into standard healthcare at $929 (95% CI: $97-$3,000)/patient (vs. $41,000 (95% CI: $20,000-$120,000) traditional) increases trial capacity 12.3x (90% CI: 4.92x-50.8x), reducing backlog clearance to 36 years (90% CI: 8.15 years-106 years). Combined with eliminating the 8.2 years (90% CI: 4.84 years-11.5 years) post-safety efficacy delay through opt-in trial participation after Phase I, treatments arrive 212 years (90% CI: 124 years-398 years) earlier on average. This timeline shift saves 10.7 billion deaths (90% CI: 6.24 billion deaths-20.3 billion deaths), averts 565 billion DALYs (90% CI: 309 billion DALYs-1.08 trillion DALYs), and eliminates 1.93 quadrillion hours (90% CI: 1.04 quadrillion hours-3.75 quadrillion hours) of suffering (YLD portion of 565 billion DALYs (90% CI: 309 billion DALYs-1.08 trillion DALYs) converted to hours) at $0.842 (90% CI: $0.264-$1.49)/DALY, competitive with bed nets ($89 (95% CI: $78-$100)/DALY) at vastly greater scale. Using standard health economic valuation ($150,000 (90% CI: $100,384-$198,679)/DALY, the US cost-effectiveness threshold; conservative relative to EPA/DOT Value of Statistical Life estimates), full impact yields $84.8 quadrillion (90% CI: $42.9 quadrillion-$172 quadrillion) in cumulative value (565 billion DALYs (90% CI: 309 billion DALYs-1.08 trillion DALYs) cumulative DALYs over the 212 years (90% CI: 124 years-398 years) timeline shift, not annual; 178 thousand (90% CI: 92 thousand-575 thousand):1 ROI).
Keywords
war-on-disease, 1-percent-treaty, medical-research, public-health, peace-dividend, decentralized-trials, dfda, dih, victory-bonds, health-economics, cost-benefit-analysis, clinical-trials, drug-development, regulatory-reform, military-spending, peace-economics, decentralized-governance, wishocracy, blockchain-governance, impact-investing
Executive Summary
There are 9,500 compounds (95% CI: 7,000 compounds-12,000 compounds) that have already been proven safe for human consumption. There are 6,650 diseases (90% CI: 5,700 diseases-8,232 diseases) with zero approved treatments. The number of possible combinations between those safe compounds and those untreated diseases is 9.5 million combinations (90% CI: 6.68 million combinations-12.8 million combinations). The fraction that has actually been tested is 0.342% (90% CI: 0%-1%). At the current rate of 15 per year, testing the rest would take ~443 years (90% CI: 255 years-841 years). Your species is sitting on a combinatorial goldmine of potential cures and has chosen to explore it with a teaspoon.
Of 2.4 billion people (95% CI: 2 billion people-2.8 billion people) with chronic disease, only 1.9 million participate in trials annually (0.06%).
The Solution: An open protocol for embedded pragmatic trials135: the learning-health-system model that PCORnet already runs at small scale (ADAPTABLE was a PCORnet trial136), given a common standard that existing DCT platforms, EHRs, and health apps adopt, like HTTP or FHIR rather than a platform. The protocol enables:
- Subsidized Patient Participation: Patients receive subsidies that offset the costs of taking part (time, travel, devices)
- Universal Trial Access: Any patient can join trials from home via their phone or computer - no travel to research centers required
- Real-World Data Aggregation: Outcomes from all participants are aggregated into a unified database
- Treatment Rankings: Standardized effectiveness rankings for every treatment-condition pair, updated continuously with real-world evidence
- Outcome Labels: “Nutrition facts for drugs” showing exactly what happened to real patients who tried each treatment
The Receipts
| Metric | Value | Context |
|---|---|---|
| Cost-Effectiveness | $0.842 (90% CI: $0.264-$1.49)/DALY | Competitive with bed nets ($89 (95% CI: $78-$100)/DALY) at vastly greater scale |
| Lives Saved | One-time benefit from 212 years (90% CI: 124 years-398 years) timeline shift | |
| DALYs Averted | Captures both mortality and morbidity | |
| Suffering Eliminated | 1.93 quadrillion hours (90% CI: 1.04 quadrillion hours-3.75 quadrillion hours) |
YLD portion of DALYs (39%) x 8,760 hrs/yr over timeline shift |
| Total Economic Value | $84.8 quadrillion (90% CI: $42.9 quadrillion-$172 quadrillion) |
Cumulative DALYs x $150K/DALY (WHO threshold) over 212 years (90% CI: 124 years-398 years) shift |
| Efficacy Lag Eliminated | Post-Phase I access via trial participation | |
| ROI (R&D Savings) | 439 (90% CI: 321-600):1 | 44.1x (90% CI: 12.8x-210x) cheaper trials |
| Annual R&D Savings | From 97.7% (90% CI: 92%-100%) cost reduction | |
| Trial Capacity Increase | Enabling parallel therapeutic space exploration |
Why These Numbers Are Large
The economic value figure ($84.8 quadrillion (90% CI: $42.9 quadrillion-$172 quadrillion)) exceeds global GDP ($115 trillion). This is expected, not an error. Three points of context:
1. Standard methodology, applied at scale. The $150,000 (90% CI: $100,384-$198,679)/DALY valuation is the US cost-effectiveness threshold (ICER). It is conservative relative to EPA and DOT Value of Statistical Life estimates, which imply higher per-DALY values when converted (~$300K-$600K/DALY). We did not invent this number. We multiplied it by the number of sick people.
2. GDP measures transactions, not the value of being alive. GDP does not count the value of not being dead, not being in pain, or not watching your children die of treatable diseases. Health economists have measured these values for decades. The global burden of disease (2.88 billion DALYs/year (90% CI: 2.63 billion DALYs/year-3.12 billion DALYs/year)) valued at $150,000 (90% CI: $100,384-$198,679)/DALY produces $400 trillion (90% CI: $252 trillion-$544 trillion)/year in health losses, roughly 3.5x global GDP. This is consistent with the established finding that the value of health substantially exceeds market output137,138.
3. The figure is cumulative over 212 years (90% CI: 124 years-398 years), not annual. This is the total value of permanently accelerating medical progress, the same methodology used to value smallpox eradication ($300M program -> millions of future lives saved) and climate infrastructure (multi-trillion dollar damage estimates that exceed annual GDP). The only debatable input is whether the timeline shift is really ~212 years; see The Discovery Capacity Model for that derivation.
Key Metric Derivations
Lives Saved:
\[
\begin{gathered}
Lives_{max} \\
= Deaths_{disease,daily} \times T_{accel,max} \times 338 \\
= 150{,}000 \times 212 \times 338 \\
= 10.7B
\end{gathered}
\]
where:
\[
T_{accel,max} = T_{accel} + T_{lag} = 204 + 8.2 = 212
\]
where:
\[
\begin{gathered}
T_{accel} \\
= T_{first,SQ} \times \left(1 - \frac{1}{k_{capacity}}\right) \\
= 222 \times \left(1 - \frac{1}{12.3}\right) \\
= 204
\end{gathered}
\]
where:
\[
\begin{gathered}
T_{first,SQ} \\
= T_{queue,SQ} \times 0.5 \\
= 443 \times 0.5 \\
= 222
\end{gathered}
\]
where:
\[
\begin{gathered}
T_{queue,SQ} \\
= \frac{N_{untreated}}{Treatments_{new,ann}} \\
= \frac{6{,}650}{15} \\
= 443
\end{gathered}
\]
where:
\[
\begin{gathered}
N_{untreated} \\
= N_{rare} \times 0.95 \\
= 7{,}000 \times 0.95 \\
= 6{,}650
\end{gathered}
\]
where:
\[
\begin{gathered}
k_{capacity} \\
= \frac{N_{fundable,ref}}{Slots_{curr}} \\
= \frac{23.4M}{1.9M} \\
= 12.3
\end{gathered}
\]
where:
\[
\begin{gathered}
N_{fundable,ref} \\
= \frac{Subsidies_{trial,ref}}{Cost_{pragmatic,pt}} \\
= \frac{\$21.8B}{\$929} \\
= 23.4M
\end{gathered}
\]
where:
\[
\begin{gathered}
Subsidies_{trial,ref} \\
= Funding_{trial,ref} - OPEX_{trial} \\
= \$21.8B - \$40M \\
= \$21.8B
\end{gathered}
\]
where:
\[
\begin{gathered}
OPEX_{trial} \\
= Cost_{platform} + Cost_{staff} + Cost_{infra} \\
+ Cost_{regulatory} + Cost_{community} \\
= \$15M + \$10M + \$8M + \$5M + \$2M \\
= \$40M
\end{gathered}
\]
Suffering Hours Eliminated:
\[
\begin{gathered}
Hours_{suffer,max} \\
= DALYs_{max} \times Pct_{YLD} \times 8760 \\
= 565B \times 0.39 \times 8760 \\
= 1930T
\end{gathered}
\]
where:
\[
\begin{gathered}
DALYs_{max} \\
= DALYs_{global,ann} \times Pct_{avoid,DALY} \times T_{accel,max} \\
= 2.88B \times 92.6\% \times 212 \\
= 565B
\end{gathered}
\]
where:
\[
T_{accel,max} = T_{accel} + T_{lag} = 204 + 8.2 = 212
\]
where:
\[
\begin{gathered}
T_{accel} \\
= T_{first,SQ} \times \left(1 - \frac{1}{k_{capacity}}\right) \\
= 222 \times \left(1 - \frac{1}{12.3}\right) \\
= 204
\end{gathered}
\]
where:
\[
\begin{gathered}
T_{first,SQ} \\
= T_{queue,SQ} \times 0.5 \\
= 443 \times 0.5 \\
= 222
\end{gathered}
\]
where:
\[
\begin{gathered}
T_{queue,SQ} \\
= \frac{N_{untreated}}{Treatments_{new,ann}} \\
= \frac{6{,}650}{15} \\
= 443
\end{gathered}
\]
where:
\[
\begin{gathered}
N_{untreated} \\
= N_{rare} \times 0.95 \\
= 7{,}000 \times 0.95 \\
= 6{,}650
\end{gathered}
\]
where:
\[
\begin{gathered}
k_{capacity} \\
= \frac{N_{fundable,ref}}{Slots_{curr}} \\
= \frac{23.4M}{1.9M} \\
= 12.3
\end{gathered}
\]
where:
\[
\begin{gathered}
N_{fundable,ref} \\
= \frac{Subsidies_{trial,ref}}{Cost_{pragmatic,pt}} \\
= \frac{\$21.8B}{\$929} \\
= 23.4M
\end{gathered}
\]
where:
\[
\begin{gathered}
Subsidies_{trial,ref} \\
= Funding_{trial,ref} - OPEX_{trial} \\
= \$21.8B - \$40M \\
= \$21.8B
\end{gathered}
\]
where:
\[
\begin{gathered}
OPEX_{trial} \\
= Cost_{platform} + Cost_{staff} + Cost_{infra} \\
+ Cost_{regulatory} + Cost_{community} \\
= \$15M + \$10M + \$8M + \$5M + \$2M \\
= \$40M
\end{gathered}
\]
Cost per DALY:
\[
\begin{gathered}
Cost_{direct,DALY} \\
= \frac{NPV_{direct}}{DALYs_{max}} \\
= \frac{\$476B}{565B} \\
= \$0.842
\end{gathered}
\]
where:
\[
\begin{gathered}
NPV_{direct} \\
= \frac{T_{queue,trial}}{Funding_{trial,ref} \times r_{discount}} \\
= \frac{36}{\$21.8B \times 3\%} \\
= \$476B
\end{gathered}
\]
where:
\[
\begin{gathered}
T_{queue,trial} \\
= \frac{T_{queue,SQ}}{k_{capacity}} \\
= \frac{443}{12.3} \\
= 36
\end{gathered}
\]
where:
\[
\begin{gathered}
T_{queue,SQ} \\
= \frac{N_{untreated}}{Treatments_{new,ann}} \\
= \frac{6{,}650}{15} \\
= 443
\end{gathered}
\]
where:
\[
\begin{gathered}
N_{untreated} \\
= N_{rare} \times 0.95 \\
= 7{,}000 \times 0.95 \\
= 6{,}650
\end{gathered}
\]
where:
\[
\begin{gathered}
k_{capacity} \\
= \frac{N_{fundable,ref}}{Slots_{curr}} \\
= \frac{23.4M}{1.9M} \\
= 12.3
\end{gathered}
\]
where:
\[
\begin{gathered}
N_{fundable,ref} \\
= \frac{Subsidies_{trial,ref}}{Cost_{pragmatic,pt}} \\
= \frac{\$21.8B}{\$929} \\
= 23.4M
\end{gathered}
\]
where:
\[
\begin{gathered}
Subsidies_{trial,ref} \\
= Funding_{trial,ref} - OPEX_{trial} \\
= \$21.8B - \$40M \\
= \$21.8B
\end{gathered}
\]
where:
\[
\begin{gathered}
OPEX_{trial} \\
= Cost_{platform} + Cost_{staff} + Cost_{infra} \\
+ Cost_{regulatory} + Cost_{community} \\
= \$15M + \$10M + \$8M + \$5M + \$2M \\
= \$40M
\end{gathered}
\]
where:
\[
\begin{gathered}
DALYs_{max} \\
= DALYs_{global,ann} \times Pct_{avoid,DALY} \times T_{accel,max} \\
= 2.88B \times 92.6\% \times 212 \\
= 565B
\end{gathered}
\]
where:
\[
T_{accel,max} = T_{accel} + T_{lag} = 204 + 8.2 = 212
\]
where:
\[
\begin{gathered}
T_{accel} \\
= T_{first,SQ} \times \left(1 - \frac{1}{k_{capacity}}\right) \\
= 222 \times \left(1 - \frac{1}{12.3}\right) \\
= 204
\end{gathered}
\]
where:
\[
\begin{gathered}
T_{first,SQ} \\
= T_{queue,SQ} \times 0.5 \\
= 443 \times 0.5 \\
= 222
\end{gathered}
\]
The Discovery Capacity Model
The 212 years (90% CI: 124 years-398 years) figure comes from a discovery capacity model of medical research. Think of the therapeutic search space as the set of all untested drug-disease combinations, with trial capacity determining how fast we can explore it.
| Parameter | Status Quo | Proposed | Impact |
|---|---|---|---|
| Untreated diseases | Same backlog | ||
| Discovery rate (first treatments/year) | 185 diseases/year (90% CI: 63.8 diseases/year-816 diseases/year) |
12.3x (90% CI: 4.92x-50.8x) faster | |
| Time to explore search space | Centuries saved | ||
| Expected time to first treatment | ~443/2 | ~36/2 | 204 years (90% CI: 116 years-390 years) earlier |
Why treatments arriving sooner saves lives:
A disease that would receive its first effective treatment in year 200 under the status quo might receive it in year 16 with the protocol. During those 184 years, people die from that disease who could have been saved. The 10.7 billion figure captures the cumulative lives saved across all diseases during their acceleration periods.
The two components:
- Discovery acceleration (204 years (90% CI: 116 years-390 years)): Higher discovery rate explores the therapeutic space faster, moving treatments forward
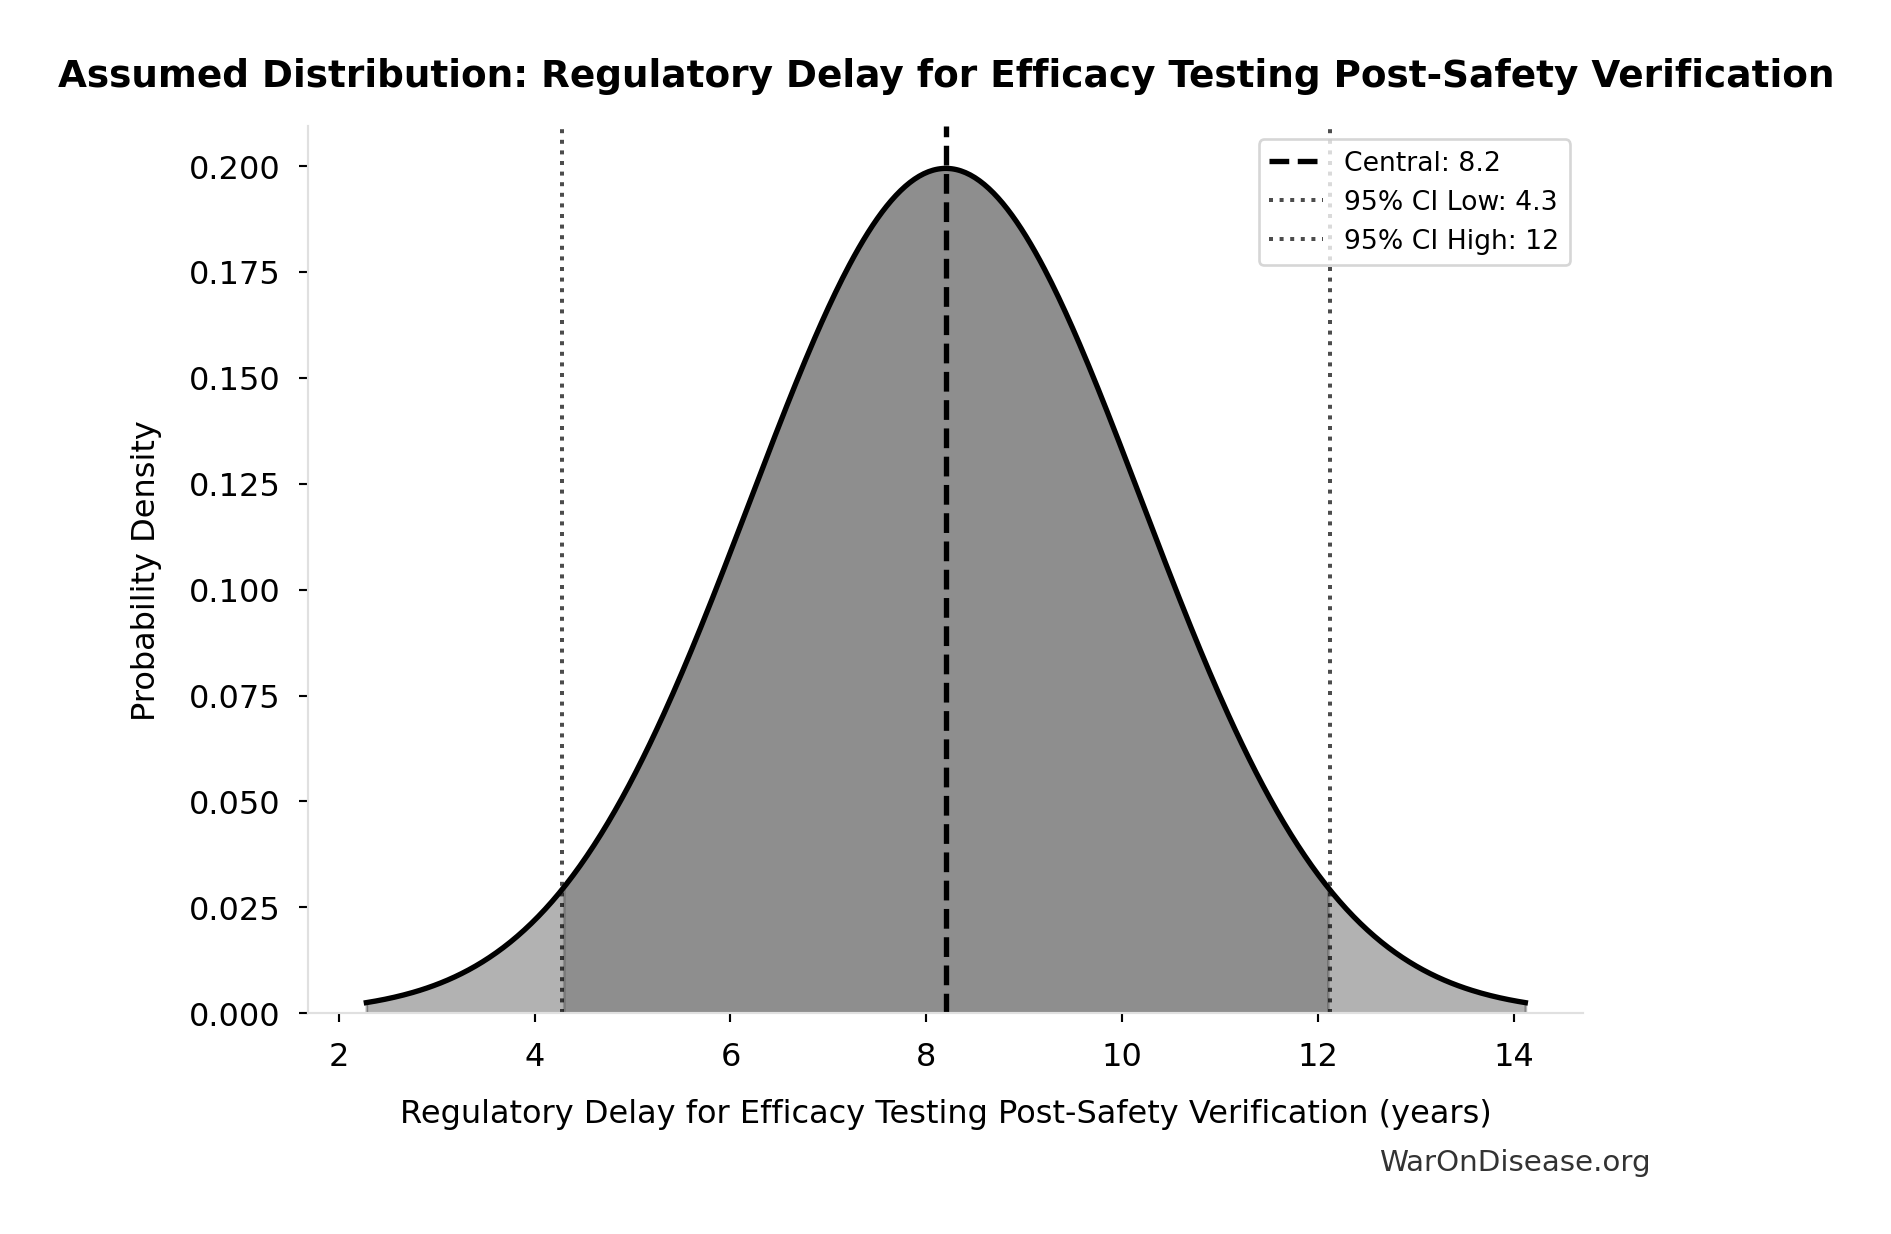
- Efficacy lag elimination (8.2 years (90% CI: 4.84 years-11.5 years)): Once discovered, treatments reach patients immediately instead of waiting for Phase II/III
Total timeline shift: 212 years (90% CI: 124 years-398 years) = 204 years (90% CI: 116 years-390 years) + 8.2 years (90% CI: 4.84 years-11.5 years)
How the 12.3x (90% CI: 4.92x-50.8x) capacity increase works: With $21.8 billion/year in trial funding at $929 (95% CI: $97-$3,000)/patient (based on ADAPTABLE trial), the protocol enables 23.4 million annual trial participants vs. current 1.9 million patients/year (95% CI: 1.5 million patients/year-2.3 million patients/year), increasing trial completion rate from 15 diseases/year (95% CI: 8 diseases/year-30 diseases/year) to 185 diseases/year (90% CI: 63.8 diseases/year-816 diseases/year). Currently less than 0.06% of willing patients can access trials, and over 9,500 compounds (95% CI: 7,000 compounds-12,000 compounds) proven-safe (FDA-approved drugs + GRAS substances) remain untested for most conditions they could improve.
Capabilities
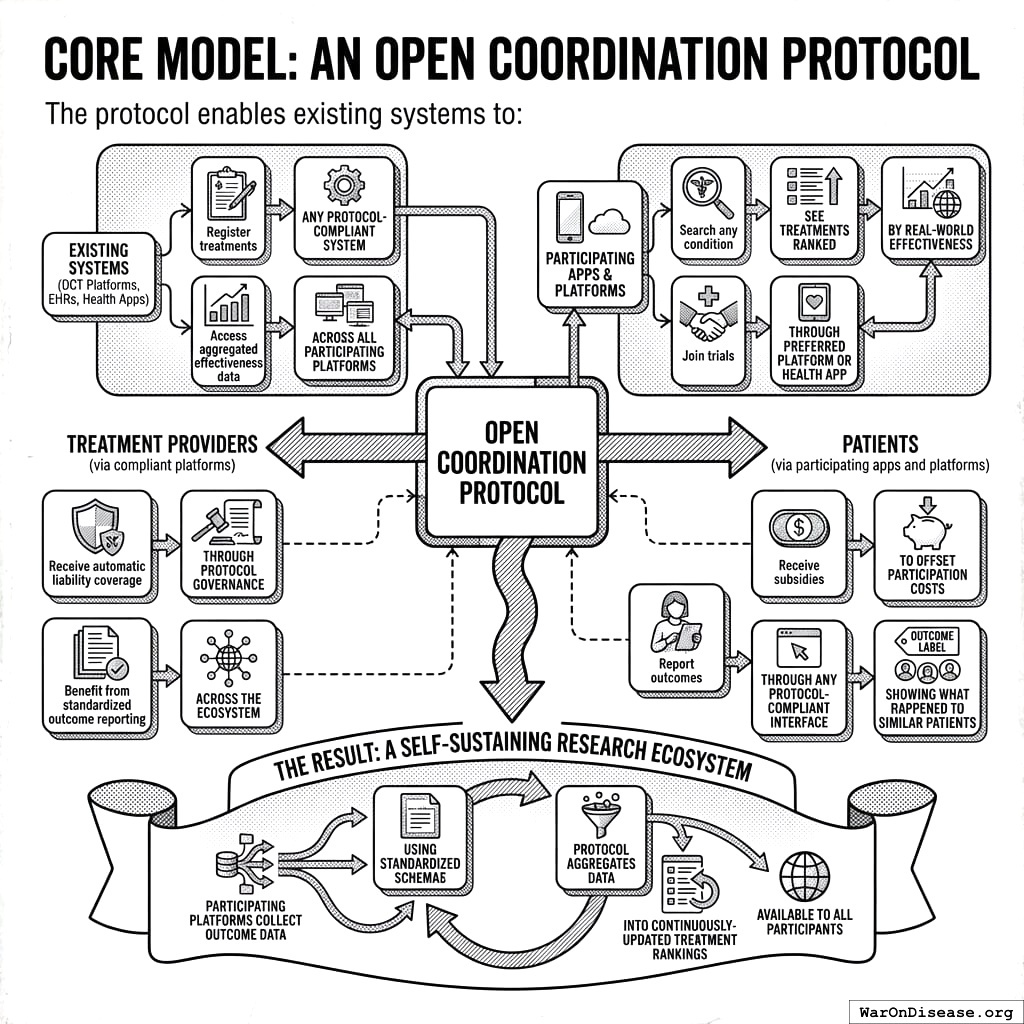
Core Model: An Open Coordination Protocol
The protocol enables existing systems (DCT platforms, EHRs, health apps) to:
For Treatment Providers (via compliant platforms):
- Register treatments through any protocol-compliant system
- Access aggregated effectiveness data across all participating platforms
- Receive liability coverage through the protocol’s pooled insurance
- Benefit from standardized outcome reporting across the network
For Patients (via participating apps and platforms):
- Search any condition, see treatments ranked by real-world effectiveness
- Join trials through their preferred platform or health app
- Receive subsidies to offset participation costs
- Report outcomes through any protocol-compliant interface
- Access “Outcome Labels” showing what happened to similar patients
The Result: A self-sustaining research network where participating platforms collect outcome data using standardized formats, and the protocol aggregates this into continuously-updated treatment rankings available to all participants.
Scenario and Assumptions
Why “Eventually Avoidable” Matters
A critical assumption in this analysis is that 92.6% (95% CI: 50%-98%) of disease deaths are “eventually avoidable” - meaning they could be prevented with sufficient biomedical research over time.
Why this assumption is conservative:
Historical trend: In 1900, life expectancy was ~47 years. Today it’s ~79. Most of that gain came from preventing deaths that were once considered inevitable (infectious disease, childhood mortality, cardiovascular disease).
Known mechanisms exist: For most major disease categories, we understand enough biology to know that interventions are theoretically possible. Cancer is caused by specific mutations. Heart disease has identifiable risk factors. The question is finding the right treatments, not whether treatments can exist.
Already-discovered treatments prove the space: 30% of approved drugs gain new indications, demonstrating that effective treatments exist but haven’t been found yet.
What if this assumption is wrong?
The health impact figures scale linearly with this assumption: at 50% avoidability (the low end of the confidence interval), lives saved and DALYs averted roughly halve and cost per DALY roughly doubles, still far below the bed nets benchmark. The R&D savings case (439 (90% CI: 321-600):1 ROI) does not depend on it at all.
Trial Funding Scenario
This analysis models a scenario with $21.8 billion/year allocated to pragmatic clinical trials. At $929 (95% CI: $97-$3,000)/patient, this funds approximately 23.4 million patient-years annually.
On the Funding Assumption
This analysis demonstrates what becomes possible when the funding constraint is removed. The $21.8 billion/year figure is achievable through multiple mechanisms:
- Philanthropic mega-donors: A single Gates Foundation-scale commitment could fund the protocol build, though not the trial budget
- Sovereign wealth funds: Norway’s $1.4T fund or similar could view this as humanity-scale infrastructure
- WHO/multilateral coordination: Comparable to GAVI or the Global Fund
- Military reallocation: Less than 1% of global military spending ($2.72 trillion/year)
- Industry consortium: Pharma collectively spends $60 billion (95% CI: $50 billion-$75 billion)/year on trials; redirecting just over a third of it would cover this budget
Protocol Costs (ROM Estimates)
The protocol is open standards and APIs that existing clinical trial systems adopt, the way HTTP lets any browser reach any website and FHIR lets health records move between systems. Like HTTP and FHIR, it needs a steward: an open standards body, modeled on HL7, that publishes the specification, runs conformance testing, and administers the pooled liability insurance. The steward holds no patient data (records stay in the source EHRs and apps and are queried in place) and runs no trials. The technical specification135 itemizes the build; the rough-order-of-magnitude totals:
- Upfront protocol build (reference implementation, conformance suite, compliance and legal setup, ~2.5 years): $37.5M - $46 million
- Annual protocol operations (hosting, maintenance, security audits, participant support): $11M - $26.5M/year. At 5 million participants that is $2.20 - $5.30 per participant per year; each additional participant costs pennies, since nearly all of the cost is fixed.
- Integration adoption fund (one-time, to help EHR and DCT platforms connect): $20M - $50M
These figures cover the protocol, not the trials. Trial participation is funded separately (the $21.8 billion/year scenario above); the protocol coordinates information and does not move the money.
Who Participates
The protocol connects existing clinical trial infrastructure:
| Participant | Current Investment | How They Integrate |
|---|---|---|
| DCT Platforms | $1B+ collectively in VC funding | Adopt outcome reporting standards |
| Major EHR Systems | Billions in infrastructure | Enable federated queries |
| Pharma Sponsors | $60 billion (95% CI: $50 billion-$75 billion)/year on trials | Submit trials via compliant systems |
| Academic Medical Centers | Research infrastructure | Contribute federated data nodes |
| Consumer Health Apps | Consumer health data | Report patient outcomes to protocol |
DCT platforms and major EHR systems have already built the infrastructure for patient recruitment, data collection, and trial management. The protocol doesn’t replicate this work; it makes their existing investments more valuable by letting data flow across systems. Each has a reason to connect: DCT platforms and academic centers gain larger patient pools and trial funding, EHR vendors gain a market for research queries, and sponsors gain cheaper trials and faster enrollment.
Broader Initiative Costs (Scenario Estimates)
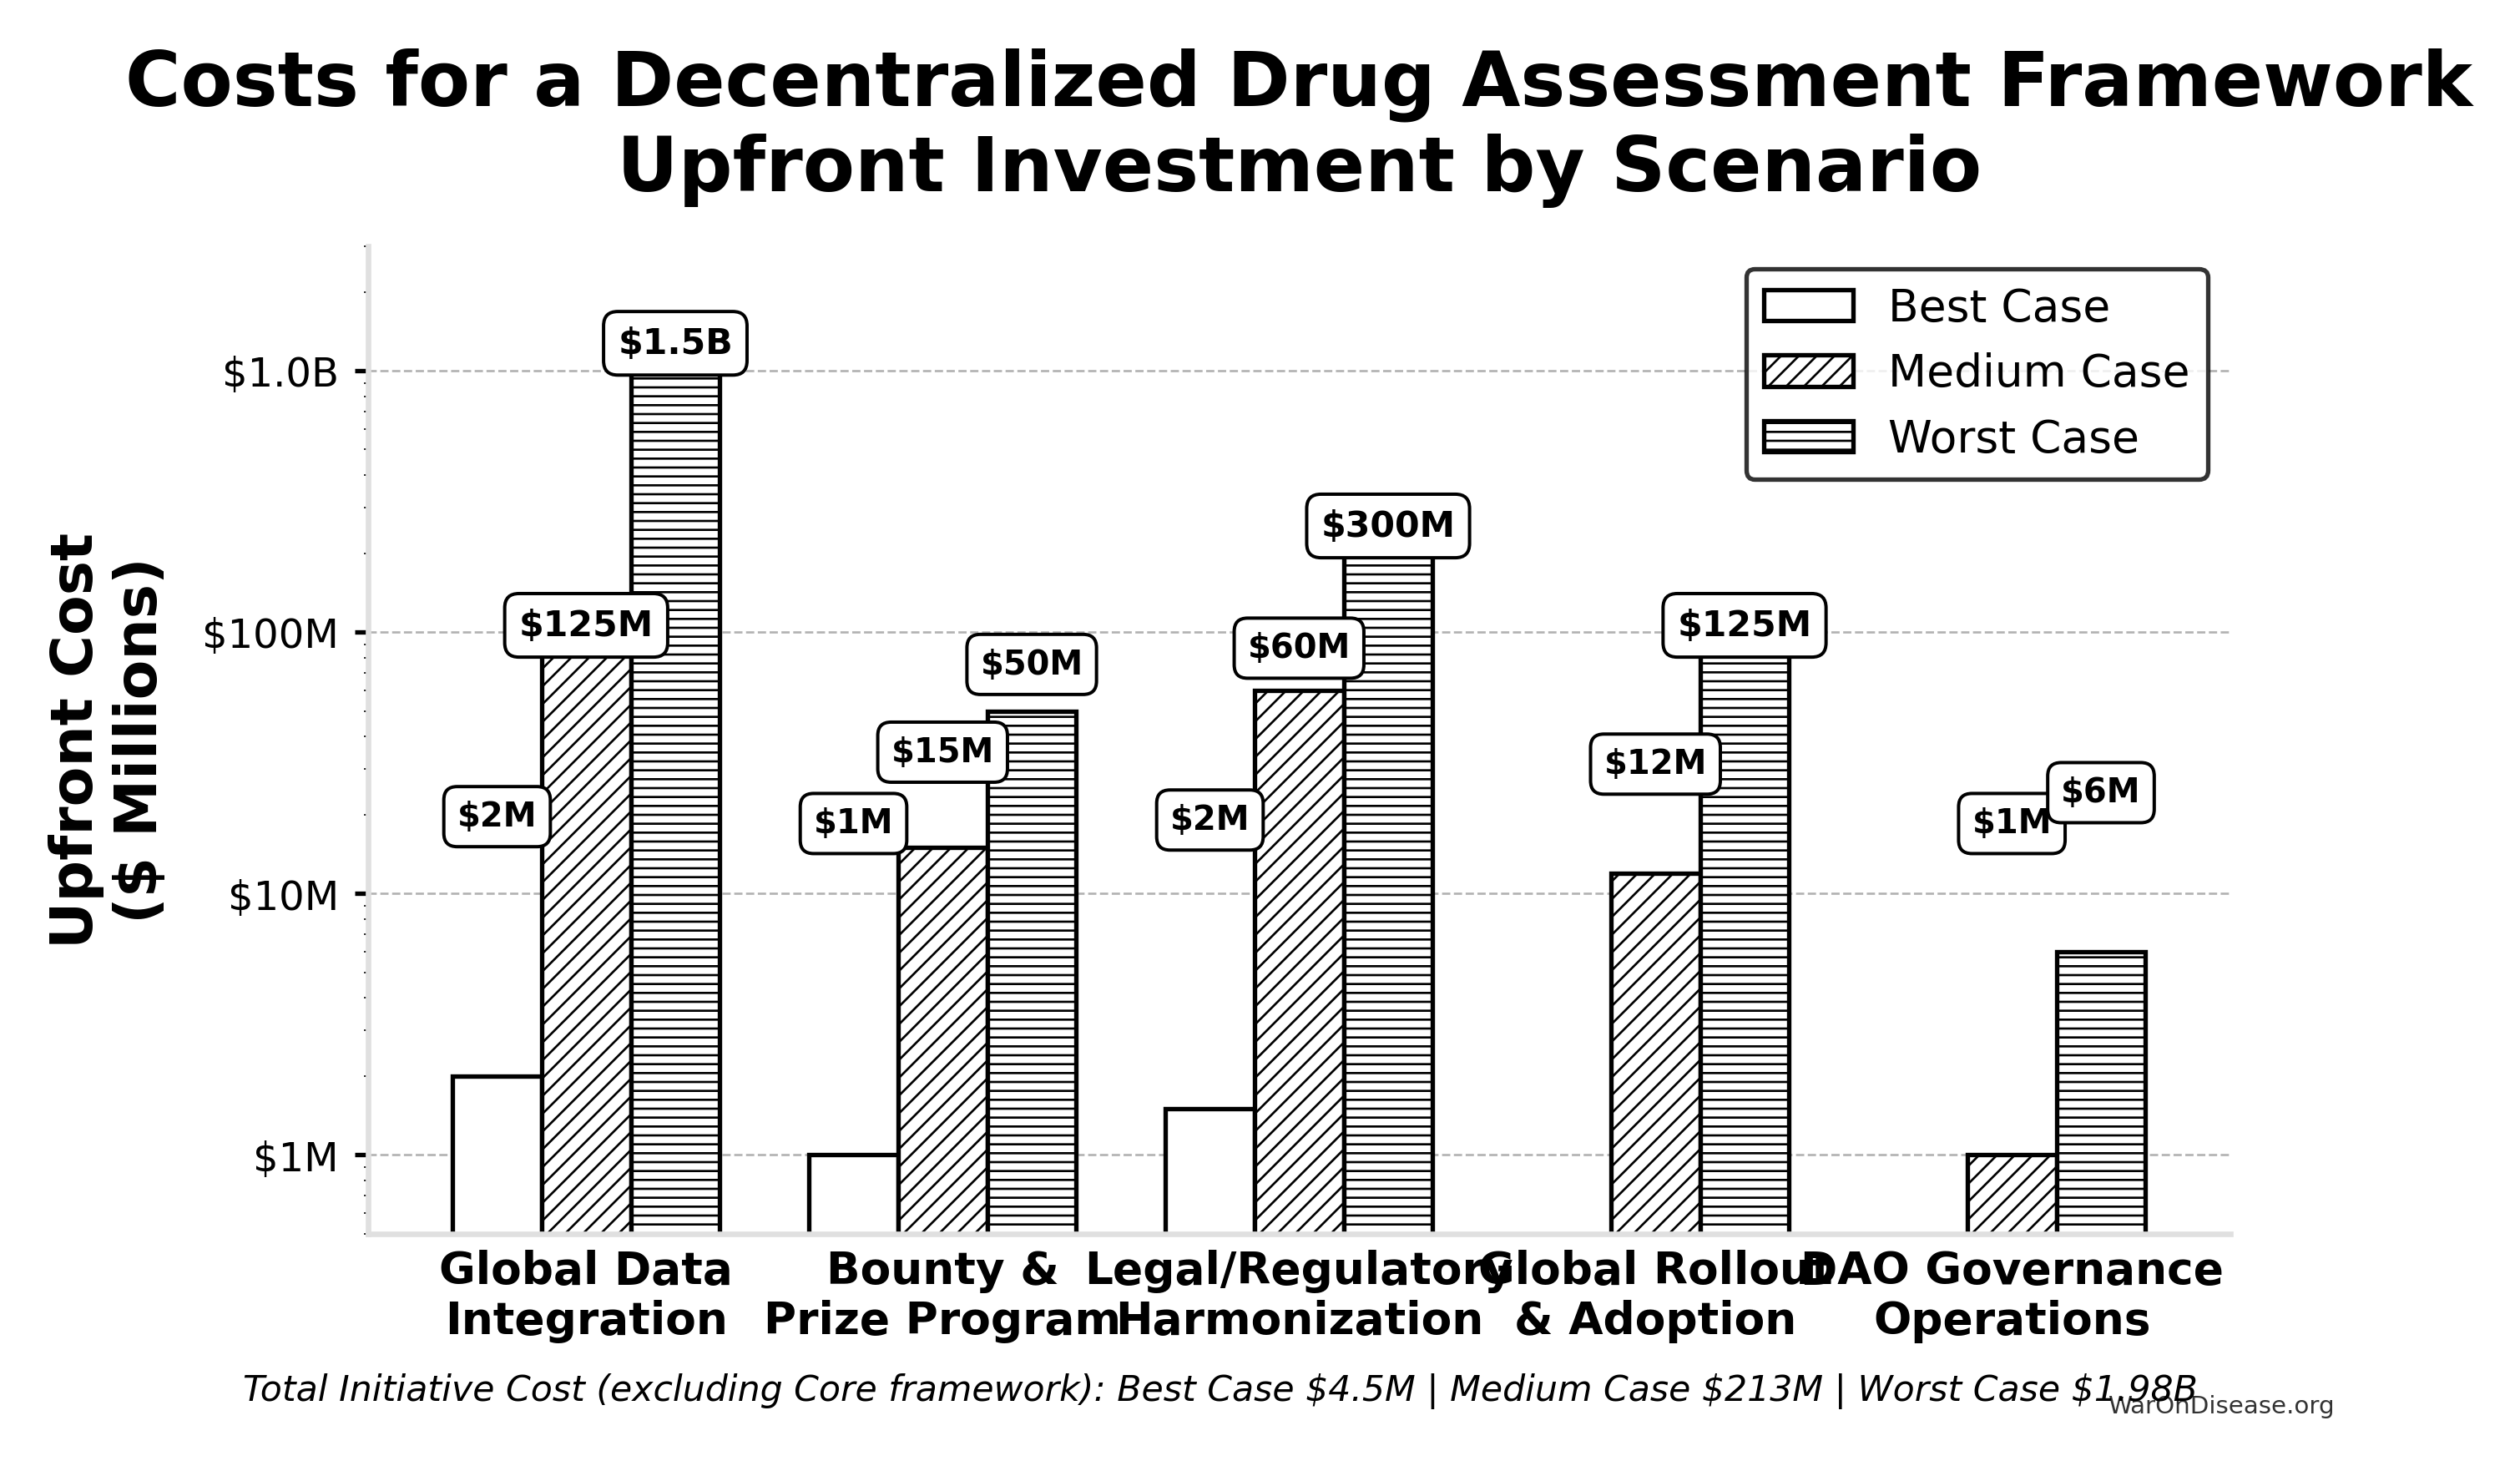
Beyond the core protocol, global integration, legal harmonization, and rollout costs depend on how much automation and vendor cooperation actually materialize:
| Component | Best Case (Upfront / Annual) | Medium Case (Upfront / Annual) | Worst Case (Upfront / Annual) | Key Assumptions & Variables Driving Range |
|---|---|---|---|---|
| Global Data Integration | $2M / ~$0 | $125M / $10M | $1.5B / $150M | Success of AI/automation, standards adoption, #systems, vendor cooperation. |
| Bounty & Prize Program | $1M (Prizes) / ~$0 | $15M (Bounties) / $2M | $50M (Major Bounties) / $10M | Whether plugin developers show up on their own vs. need bounties to build critical tools. |
| Legal/Regulatory Harmonization | $1.5M / ~$0 | $60M / $3M | $300M / $30M | Effectiveness of AI legal tools, political will, complexity of global law. |
| Global Rollout & Adoption | ~$0 / ~$0 | $12M / $3M | $125M / $30M | Need for training/support beyond protocol adoption, user interface complexity. |
| Governance Operations | ~$0 / ~$0 | ~$1M / $0.3M | ~$6M / $1M | Automation level, need for audits, grants, core support staff. |
| — TOTAL — | ~$4.5M / ~$0 | ~$213M / ~$18.3M | ~$1.98B+ / ~$221M+ | Total initiative cost excluding core protocol build/ops. |
The medium case puts the full initiative in the low hundreds of millions upfront and the low tens of millions per year. The worst case, dominated by integration and legal costs if automation and vendor cooperation fall short, reaches ~$2B upfront and ~$220M/year. The core protocol costs tens of millions; the broader initiative is where the large numbers live.
Benefit Analysis - Quantifying the Savings
This section quantifies the potential societal benefits of the protocol, focusing primarily on R&D cost savings and health outcome improvements.
Market Size and Impact
Annual global spending on clinical trials is approximately $60 billion (95% CI: $50 billion-$75 billion). Much of this spending could be made far more efficient through protocol standardization.
- Current Average Costs: Estimates suggest $2.6 billion (95% CI: $1.5 billion-$4 billion) to bring a new drug from discovery through FDA approval, spread across ~10 years.
- Per-Patient Phase III Costs: Often $41,000 (95% CI: $20,000-$120,000) (site fees, overhead, staff, monitoring, data management).
Decentralized Trial Costs Modeled on Pragmatic Trials
Oxford RECOVERY: Achieved ~$500 (95% CI: $400-$2,500). Key strategies included:
- Embedding trial protocols within routine hospital care.
- Minimizing overhead by using existing staff, resources, and electronic data capture.
- Focused, pragmatic trial designs.
Systematic Review Evidence: A systematic review of 64 embedded pragmatic clinical trials found a median cost per patient of $97 (95% CI: $19-$478)94. This confirms that low-cost execution is a replicable property of the pragmatic design, not an anomaly of any single trial.
ADAPTABLE Trial (PCORnet): The US-based ADAPTABLE trial136 ($14 million (95% CI: $14 million-$20 million) / 15,076 patients = $929 (95% CI: $929-$1,400)/patient) provides a more representative benchmark for pragmatic trial costs in typical healthcare settings without emergency conditions.
Protocol Cost Projection: Our projections use $929 (95% CI: $97-$3,000)/patient based on ADAPTABLE. Confidence interval ($500-$3,000) captures range from RECOVERY-like efficiency to complex chronic disease trials.
Input: Pragmatic Trial Cost Distribution
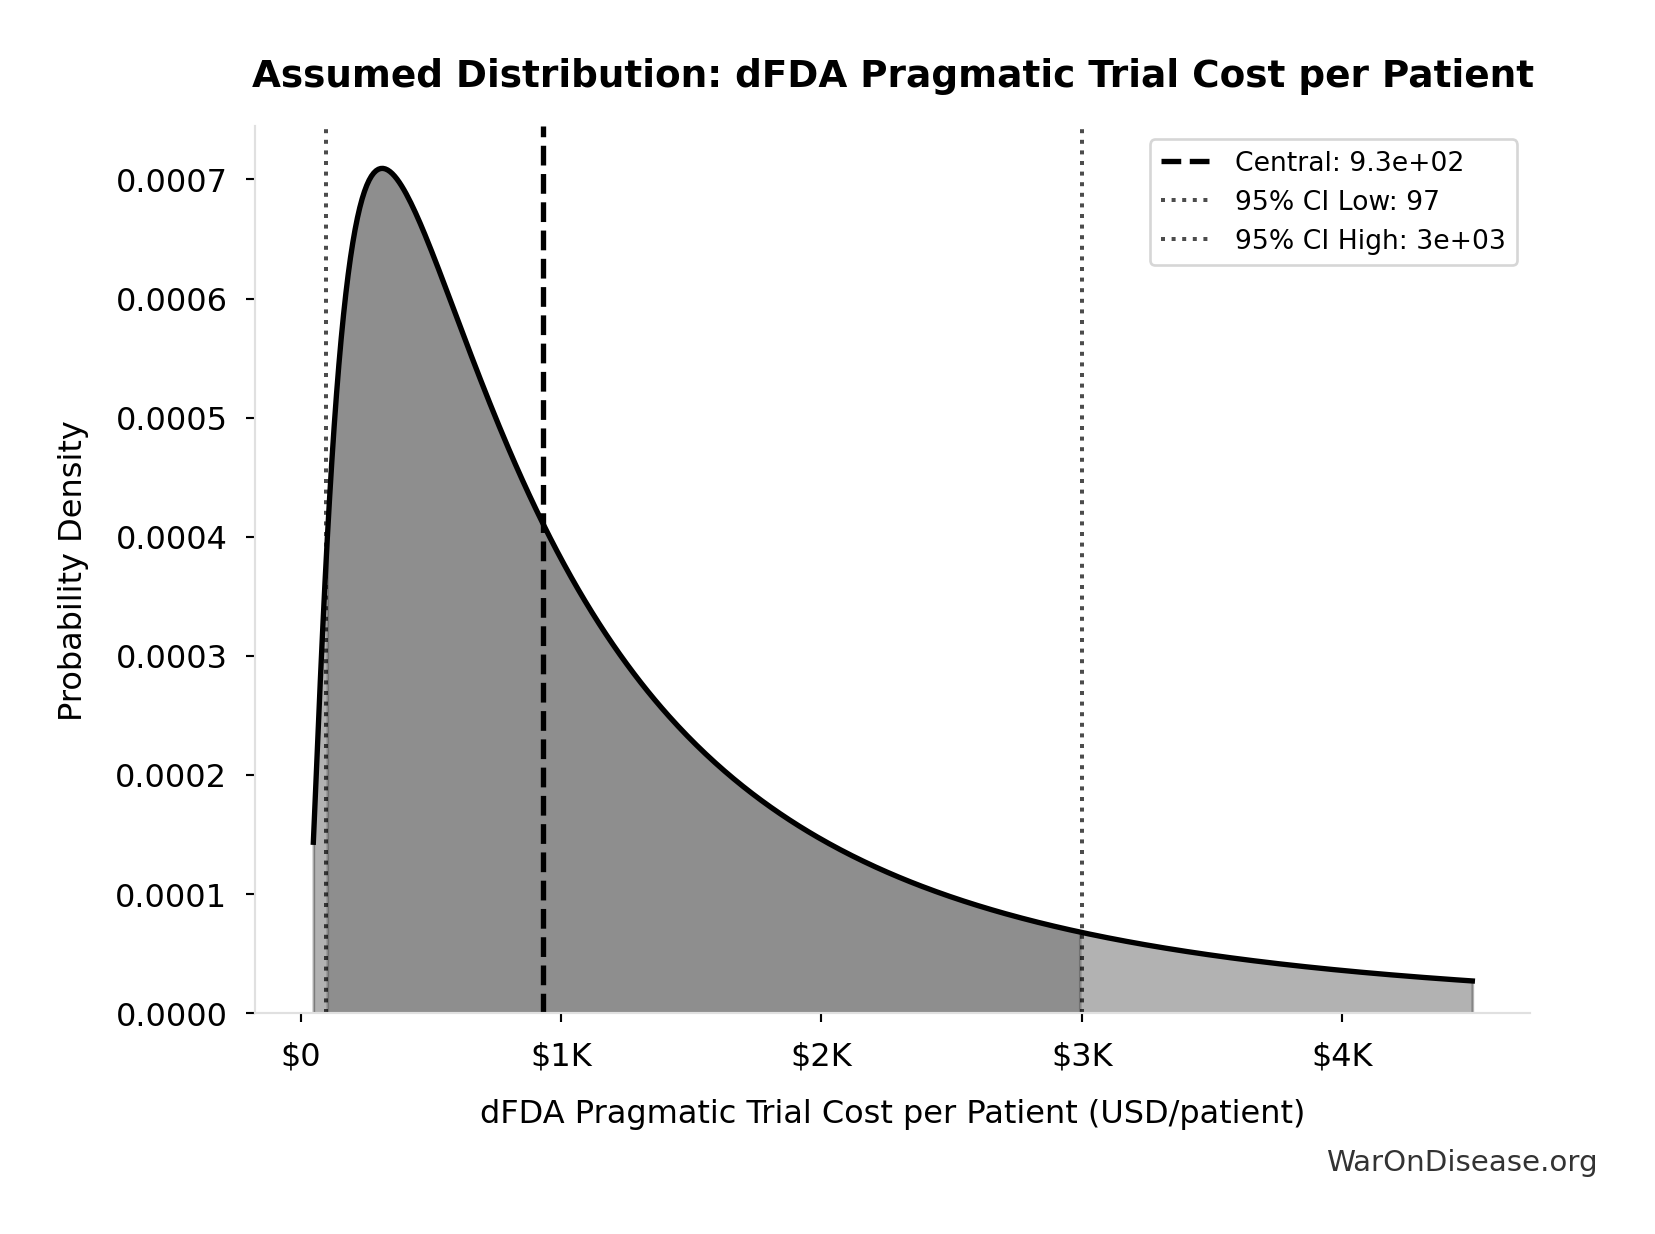
This chart shows the assumed probability distribution for this parameter. The shaded region represents the 95% confidence interval where we expect the true value to fall.
Extrapolation to New System:
- A well-integrated global protocol could achieve $929 (95% CI: $97-$3,000) in many cases, especially for pragmatic or observational designs.
- Up to ~44.1x (90% CI: 12.8x-210x) cost reduction is achievable by comparing pragmatic trial costs ($929 (95% CI: $97-$3,000)) against traditional costs of $41,000 (95% CI: $20,000-$120,000).
The cost reduction factor:
\[ \begin{gathered} k_{reduce} \\ = \frac{Cost_{P3,pt}}{Cost_{pragmatic,pt}} \\ = \frac{\$41K}{\$929} \\ = 44.1 \end{gathered} \]
The percentage reduction:
\[ \begin{gathered} Reduce_{pct} \\ = 1 - \frac{Cost_{pragmatic,pt}}{Cost_{P3,pt}} \\ = 1 - \frac{\$929}{\$41K} \\ = 97.7\% \end{gathered} \]
Scope of Cost Reduction
The reduction applies to Phase II/III efficacy trials, which are 69% (90% CI: 61%-77%) of global trial spending. Phase I first-in-human trials keep their current design and cost, and Phase IV is excluded from the savings to stay conservative. Within efficacy trials, per-patient cost varies with the endpoints: simple comparative studies approach RECOVERY’s $500 (95% CI: $400-$2,500) while trials needing imaging or biopsies run closer to $3,000. The $929 (95% CI: $97-$3,000) central estimate and its confidence interval already carry that spread, so the 97.7% (90% CI: 92%-100%) figure is not discounted a second time for trial complexity.
Gross R&D Savings from the Protocol
- Parameter: Percentage reduction in addressable clinical trial costs due to the protocol.
- Central Estimate: 97.7% (90% CI: 92%-100%) (44.1x (90% CI: 12.8x-210x))
- Source/Rationale:
- Decentralized Clinical Trials (DCTs) demonstrate significant cost reductions139 through reduced site management, travel, and streamlined data collection.
The annual gross R&D savings can be calculated as:
\[ S_{\text{annual}} = \alpha \cdot \phi \cdot R_d \]
Where:
- \(\alpha \in [0,1]\) is the cost reduction percentage (as decimal)
- \(\phi\) = 69% (90% CI: 61%-77%), the Phase II/III share of trial spending
- \(R_d\) = $60 billion (95% CI: $50 billion-$75 billion) global clinical trial spending
Base Case Calculation:
Using 97.7% (90% CI: 92%-100%) cost reduction (pragmatic trial costs of $929 (95% CI: $97-$3,000) vs traditional $41,000 (95% CI: $20,000-$120,000)) on the Phase II/III share of spending:
\[
\begin{gathered}
Benefit_{RD,ann} \\
= Spending_{trials} \times Pct_{P2+P3} \times Reduce_{pct} \\
= \$60B \times 69\% \times 97.7\% \\
= \$40.5B
\end{gathered}
\]
where:
\[
\begin{gathered}
Reduce_{pct} \\
= 1 - \frac{Cost_{pragmatic,pt}}{Cost_{P3,pt}} \\
= 1 - \frac{\$929}{\$41K} \\
= 97.7\%
\end{gathered}
\]
Uncertainty Analysis - R&D Savings:
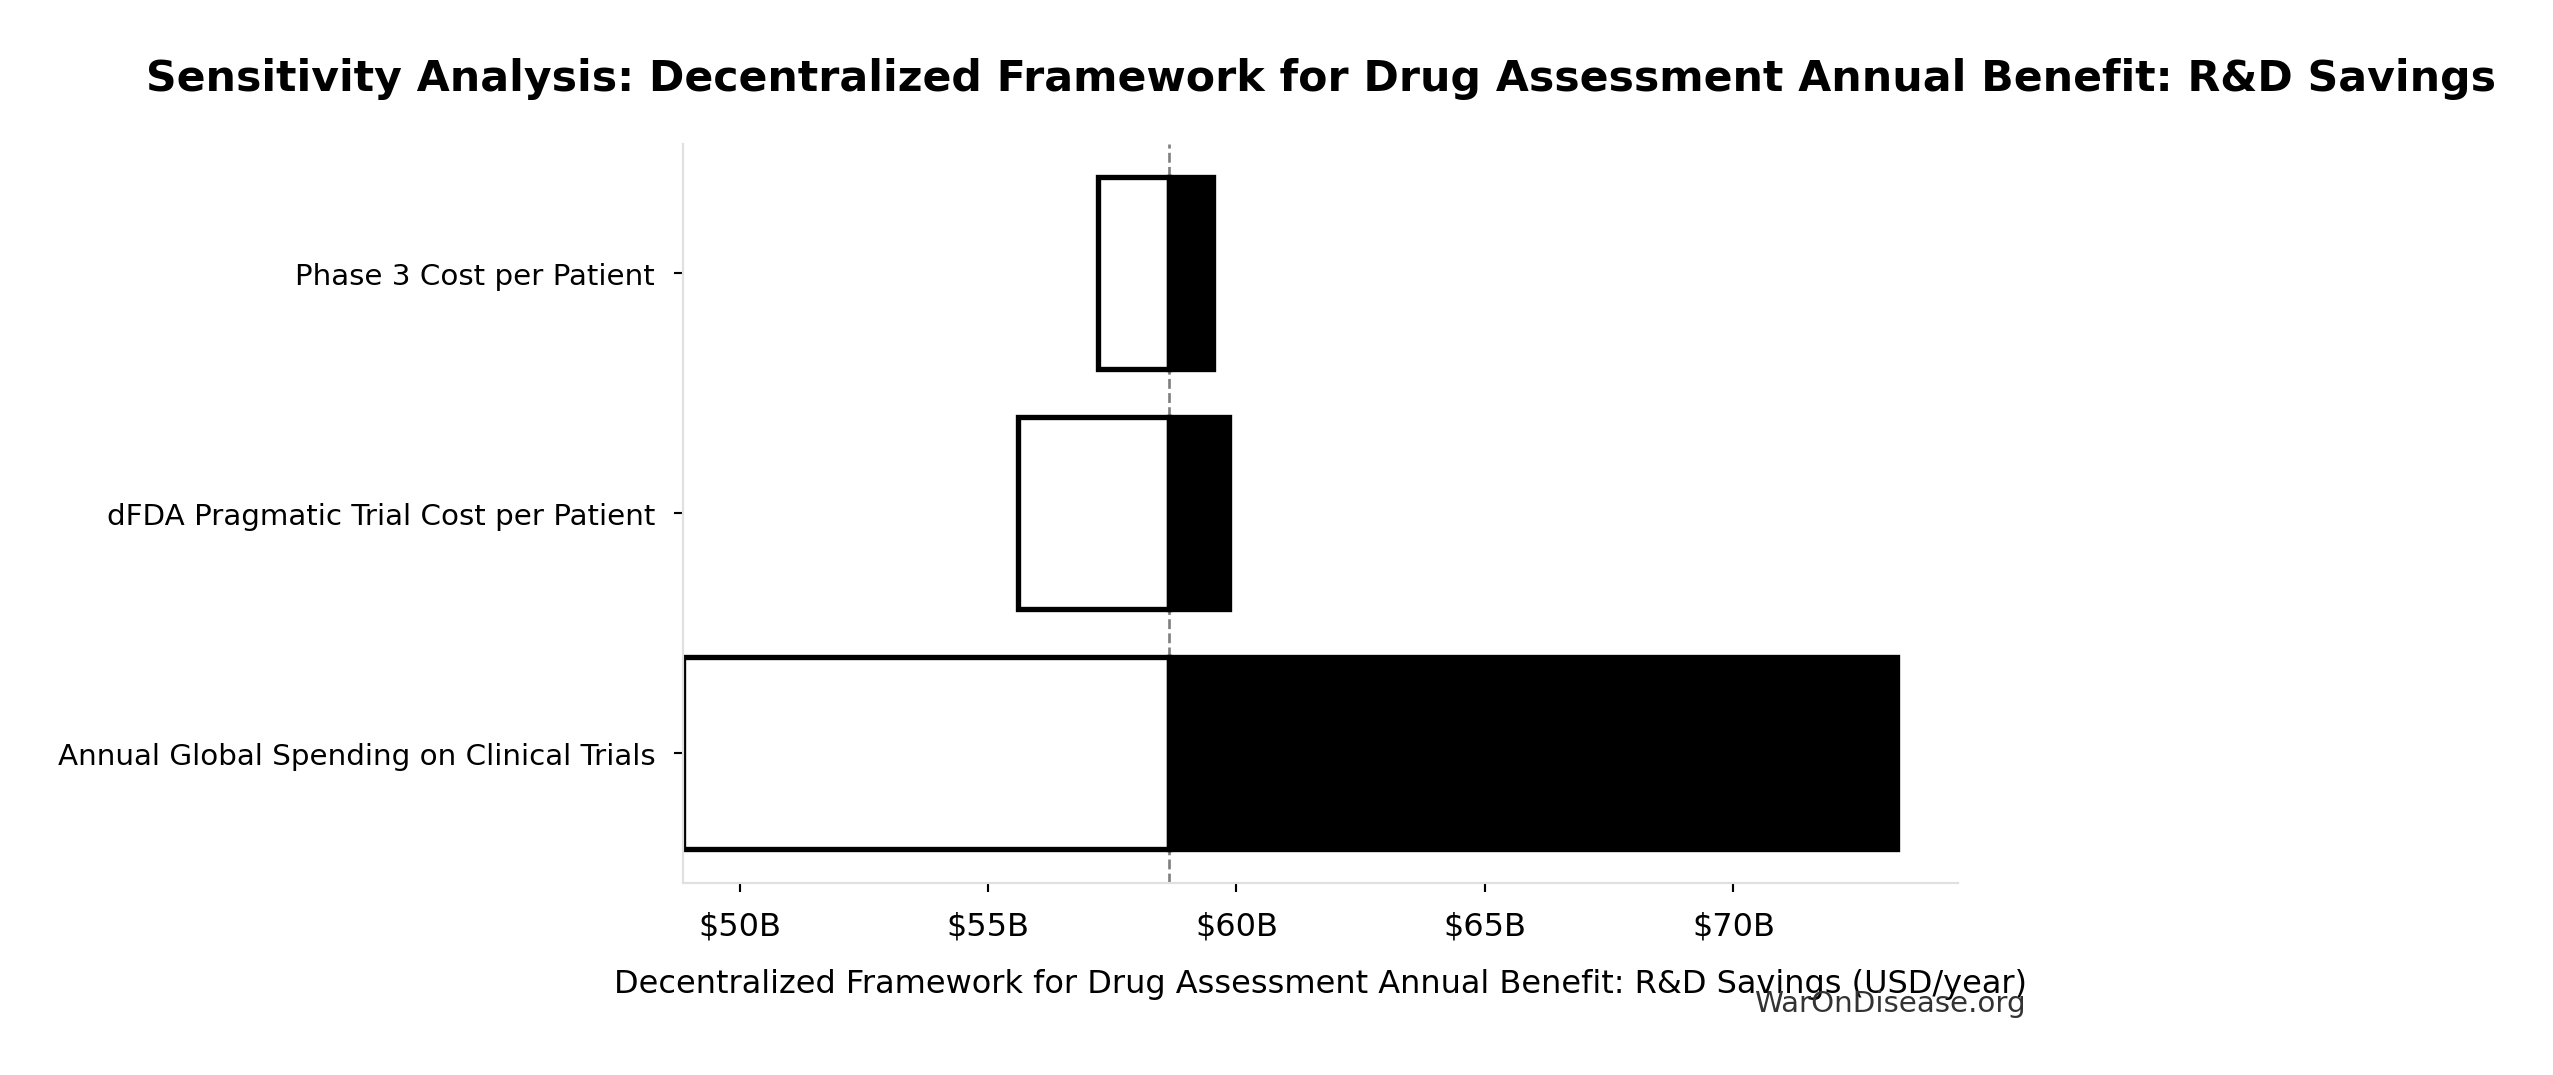
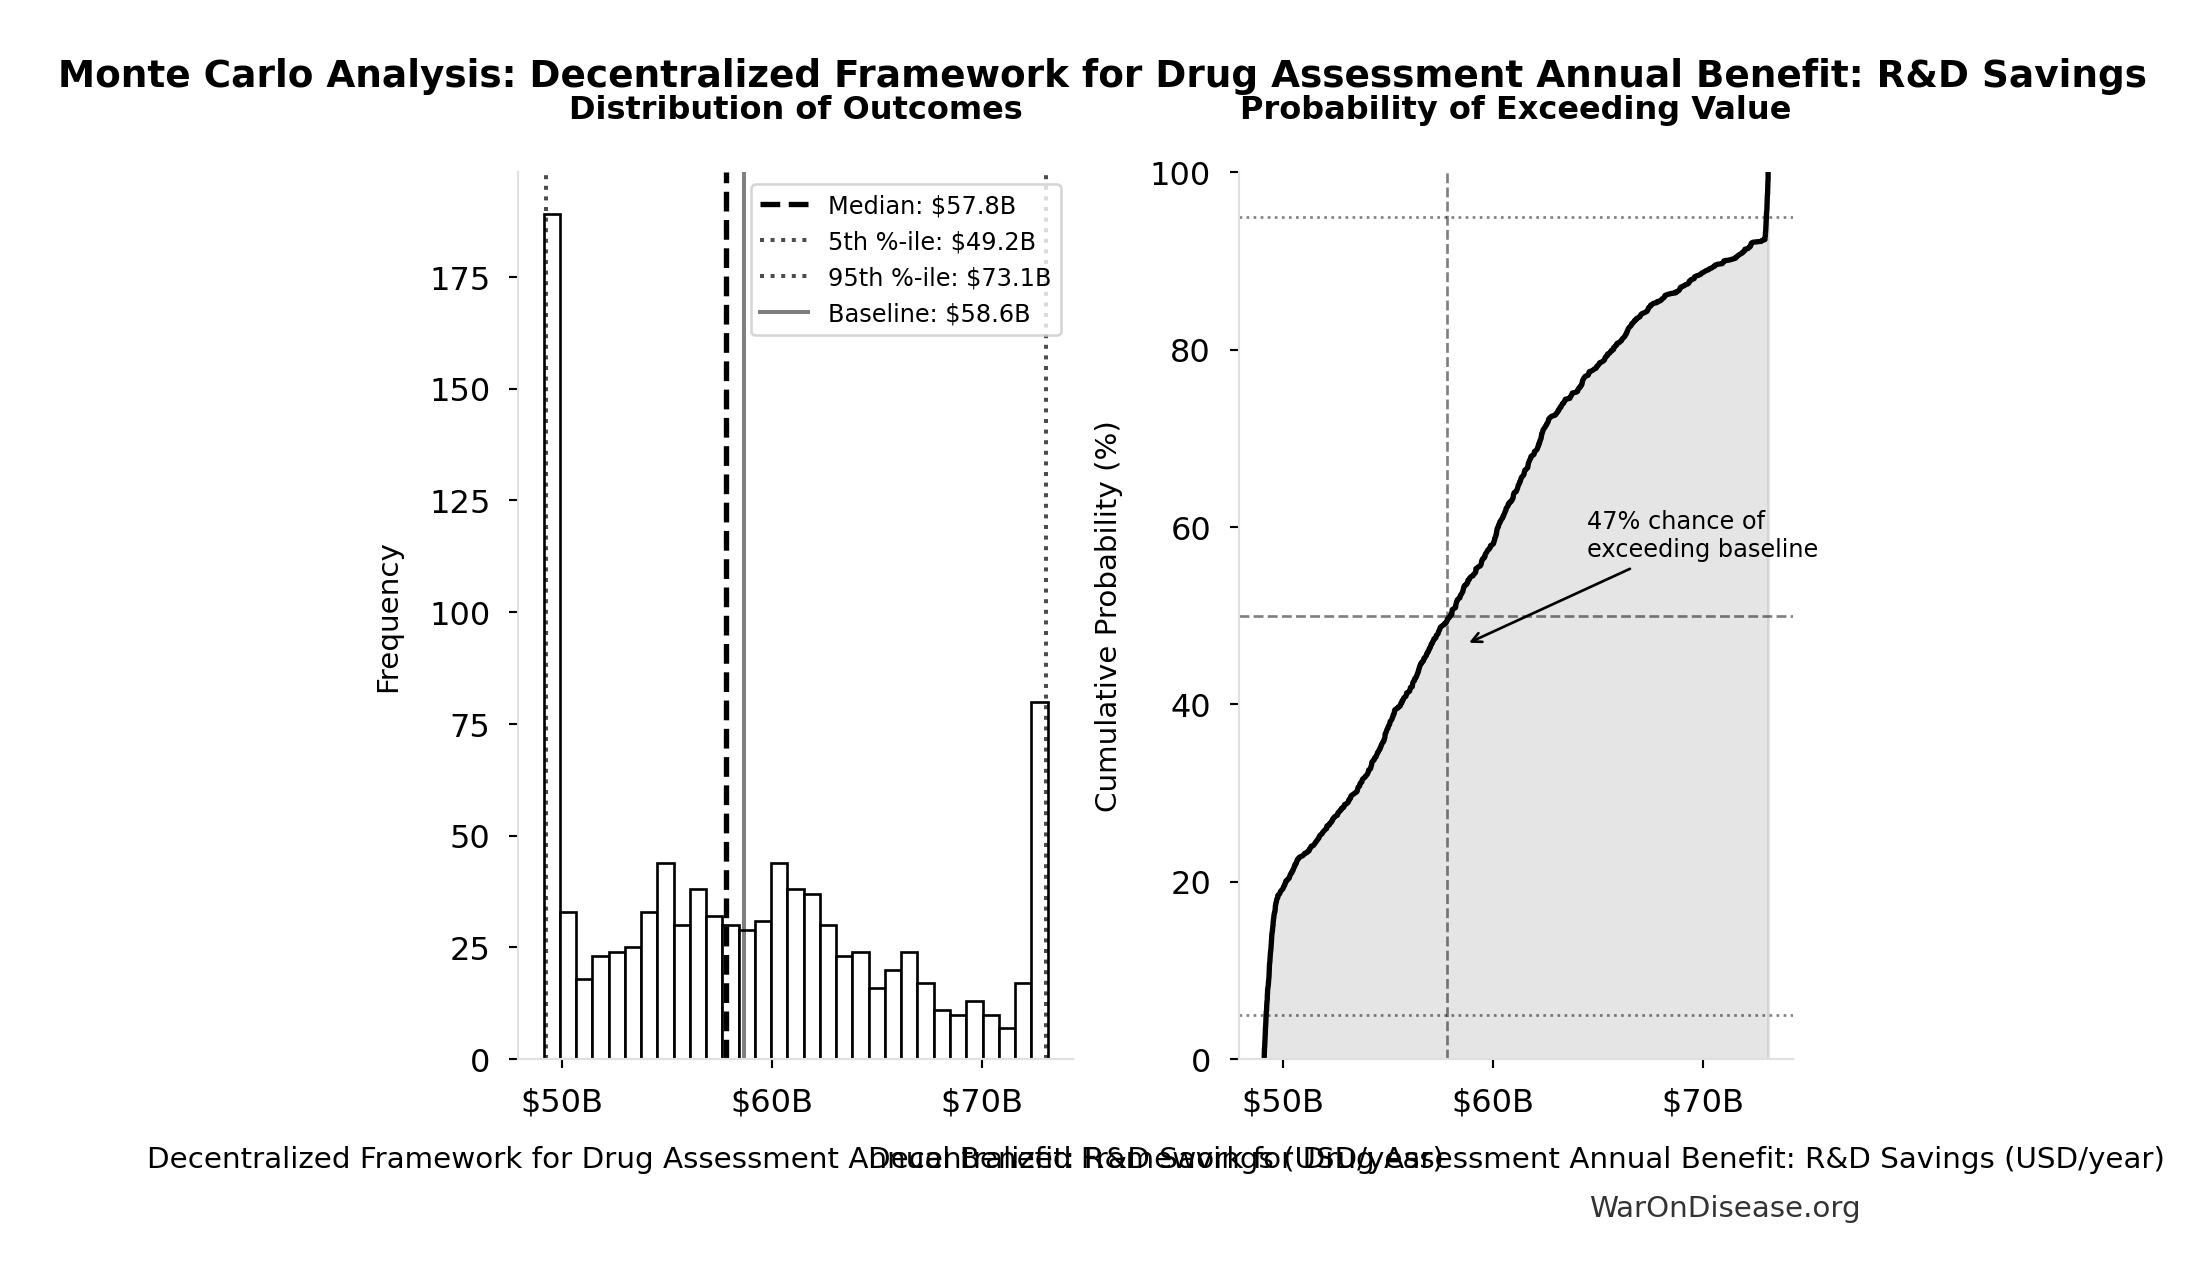
Simulation Results Summary: Annual R&D Savings from Pragmatic Trials
| Statistic | Value |
|---|---|
| Baseline (deterministic) | $40.5 billion |
| Mean (expected value) | $40.3 billion |
| Median (50th percentile) | $39.6 billion |
| Standard Deviation | $6.21 billion |
| 90% Range (5th-95th percentile) | [$31.4 billion, $51.5 billion] |
The histogram shows 1,000 of the 10,000 Monte Carlo draws for Annual R&D Savings from Pragmatic Trials; the summary statistics use all 10,000. The exceedance curve (right) shows the probability of the outcome exceeding any given value.
Post-Safety Efficacy Lag Elimination
The smaller of the two timeline-shift components. Once a treatment has passed Phase I safety testing (2.3 years, unchanged), patients can take it through trial participation rather than waiting the 8.2 years (90% CI: 4.84 years-11.5 years) that Phase II/III currently add before approval, with efficacy measured from the trial data as it accumulates. Removing that wait contributes 8.2 years (90% CI: 4.84 years-11.5 years) of the 212 years (90% CI: 124 years-398 years) total shift (8.77 billion DALYs (90% CI: 4.88 billion DALYs-13.2 billion DALYs), 416 million deaths (90% CI: 244 million deaths-587 million deaths)); discovery acceleration contributes the other 204 years (90% CI: 116 years-390 years), over 10× more. Methodology for the lag estimate: invisible-graveyard.warondisease.org.
Safety and Risk Management
Common concern: Won’t faster trials with lower costs compromise safety?
Current System Limitations: Dangerously Blind to Real-World Harms
The current system is not safe - it just appears safe because harms go undetected.
The FDA’s voluntary adverse event reporting system (MedWatch) captures only 1-10% of actual adverse events. Long-term harms that develop gradually over years - the most insidious and deadly kind - are virtually invisible:
- Vioxx (rofecoxib): Caused 38,000-55,000 cardiovascular deaths over 5 years before detection through voluntary reporting
- Hormone Replacement Therapy: Prescribed for decades before the Women’s Health Initiative revealed increased cancer and cardiovascular risk - risks invisible to voluntary reporting
- Opioids: The overdose crisis killed 500,000+ Americans; the addiction signal was undetectable in short trials with cherry-picked populations
- Avandia (rosiglitazone): 83,000 excess heart attacks estimated before restrictions; signal emerged years post-approval
The current “safety” system doesn’t prevent harm - it delays detection until bodies accumulate. Continuous EHR monitoring across a treated population compares outcomes to matched controls as prescriptions accumulate, rather than waiting for doctors to notice, remember, and file a report.
Specific limitations of the current system:
- Voluntary adverse event reporting captures only 1-10% of actual events
- Traditional Phase III trials follow 300-3,000 patients for months to a few years, then monitoring stops
- Approximately 50% of trial results go unpublished, with publication bias favoring positive findings 3:1
- 86.1% of patients excluded due to age, comorbidities, or medications - safety signals in these populations go undetected
- Long-term effects (>1 year) rarely captured in pre-approval trials
- FDA’s Sentinel System already runs automated surveillance on claims and dispensing data from more than 100 million people140, but it answers specific safety questions the agency poses; no routine screen watches every marketed drug for gradual harms
Proposed System Safety Advantages
- Preserved Phase I Safety Testing: Rigorous Phase I safety testing (~2.3 years) is maintained. What changes is eliminating the 8.2 years (90% CI: 4.84 years-11.5 years) efficacy delay after safety is verified.
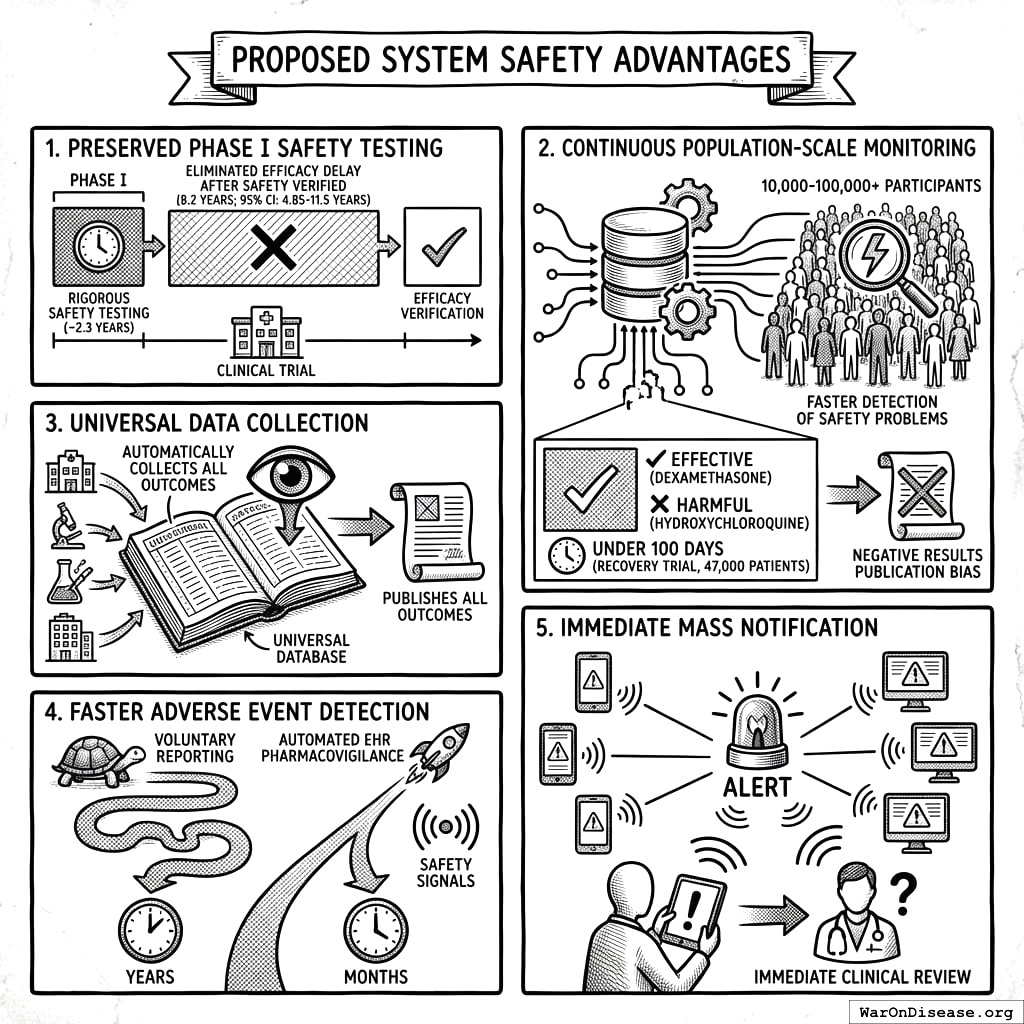
Continuous Population-Scale Monitoring: Pragmatic trials with 10,000-100,000+ participants monitored continuously through EHR integration detect safety problems faster than small, time-limited traditional trials. The RECOVERY trial identified an effective treatment (dexamethasone) and an ineffective one (hydroxychloroquine) within about 100 days of launch, and went on to enroll 47,000 patients.
Universal Data Collection: The system automatically collects and publishes outcome data on all treatments, eliminating the publication bias that currently hides negative results.
Faster Adverse Event Detection: Automated EHR pharmacovigilance detects safety signals in months rather than the years required by voluntary reporting systems.
Immediate Mass Notification: When safety signals are detected, all patients taking the drug receive automated alerts through patient portals, enabling immediate clinical review.
Comparative Safety Surveillance
| Safety Dimension | Traditional Trials | Pragmatic Trials + EHR Monitoring |
|---|---|---|
| Sample size | 300-3,000 patients | 10,000-100,000+ patients |
| Patient selection | 86.1% excluded | All volunteers (real-world populations) |
| Monitoring duration | 3-12 months (then stops) | Continuous via EHR (indefinite) |
| Publication rate | ~50% unpublished | 100% automatically published |
| Adverse event detection | Voluntary reporting (1-10% capture) | Automated EHR surveillance of every enrolled patient |
Pooled Liability Insurance
The protocol includes pooled liability coverage for sponsors, reducing individual company risk while ensuring patient compensation for adverse events. This removes a major barrier to trial participation for smaller sponsors while maintaining accountability.
ROI Analysis
Monte Carlo Distributions
Simulation Results Summary: ROI from Pragmatic Trial R&D Savings Only
| Statistic | Value |
|---|---|
| Baseline (deterministic) | 439:1 |
| Mean (expected value) | 445:1 |
| Median (50th percentile) | 436:1 |
| Standard Deviation | 85.7:1 |
| 90% Range (5th-95th percentile) | [321:1, 600:1] |
The histogram shows 1,000 of the 10,000 Monte Carlo draws for ROI from Pragmatic Trial R&D Savings Only; the summary statistics use all 10,000. The exceedance curve (right) shows the probability of the outcome exceeding any given value.
Simulation Results Summary: NPV Net Benefit (R&D Only)
| Statistic | Value |
|---|---|
| Baseline (deterministic) | $268 billion |
| Mean (expected value) | $267 billion |
| Median (50th percentile) | $263 billion |
| Standard Deviation | $41.3 billion |
| 90% Range (5th-95th percentile) | [$208 billion, $341 billion] |
The histogram shows 1,000 of the 10,000 Monte Carlo draws for NPV Net Benefit (R&D Only); the summary statistics use all 10,000. The exceedance curve (right) shows the probability of the outcome exceeding any given value.
Simulation Results Summary: Pragmatic Trial Platform Total NPV Cost
| Statistic | Value |
|---|---|
| Baseline (deterministic) | $611 million |
| Mean (expected value) | $609 million |
| Median (50th percentile) | $606 million |
| Standard Deviation | $69.3 million |
| 90% Range (5th-95th percentile) | [$499 million, $729 million] |
The histogram shows 1,000 of the 10,000 Monte Carlo draws for Pragmatic Trial Platform Total NPV Cost; the summary statistics use all 10,000. The exceedance curve (right) shows the probability of the outcome exceeding any given value.
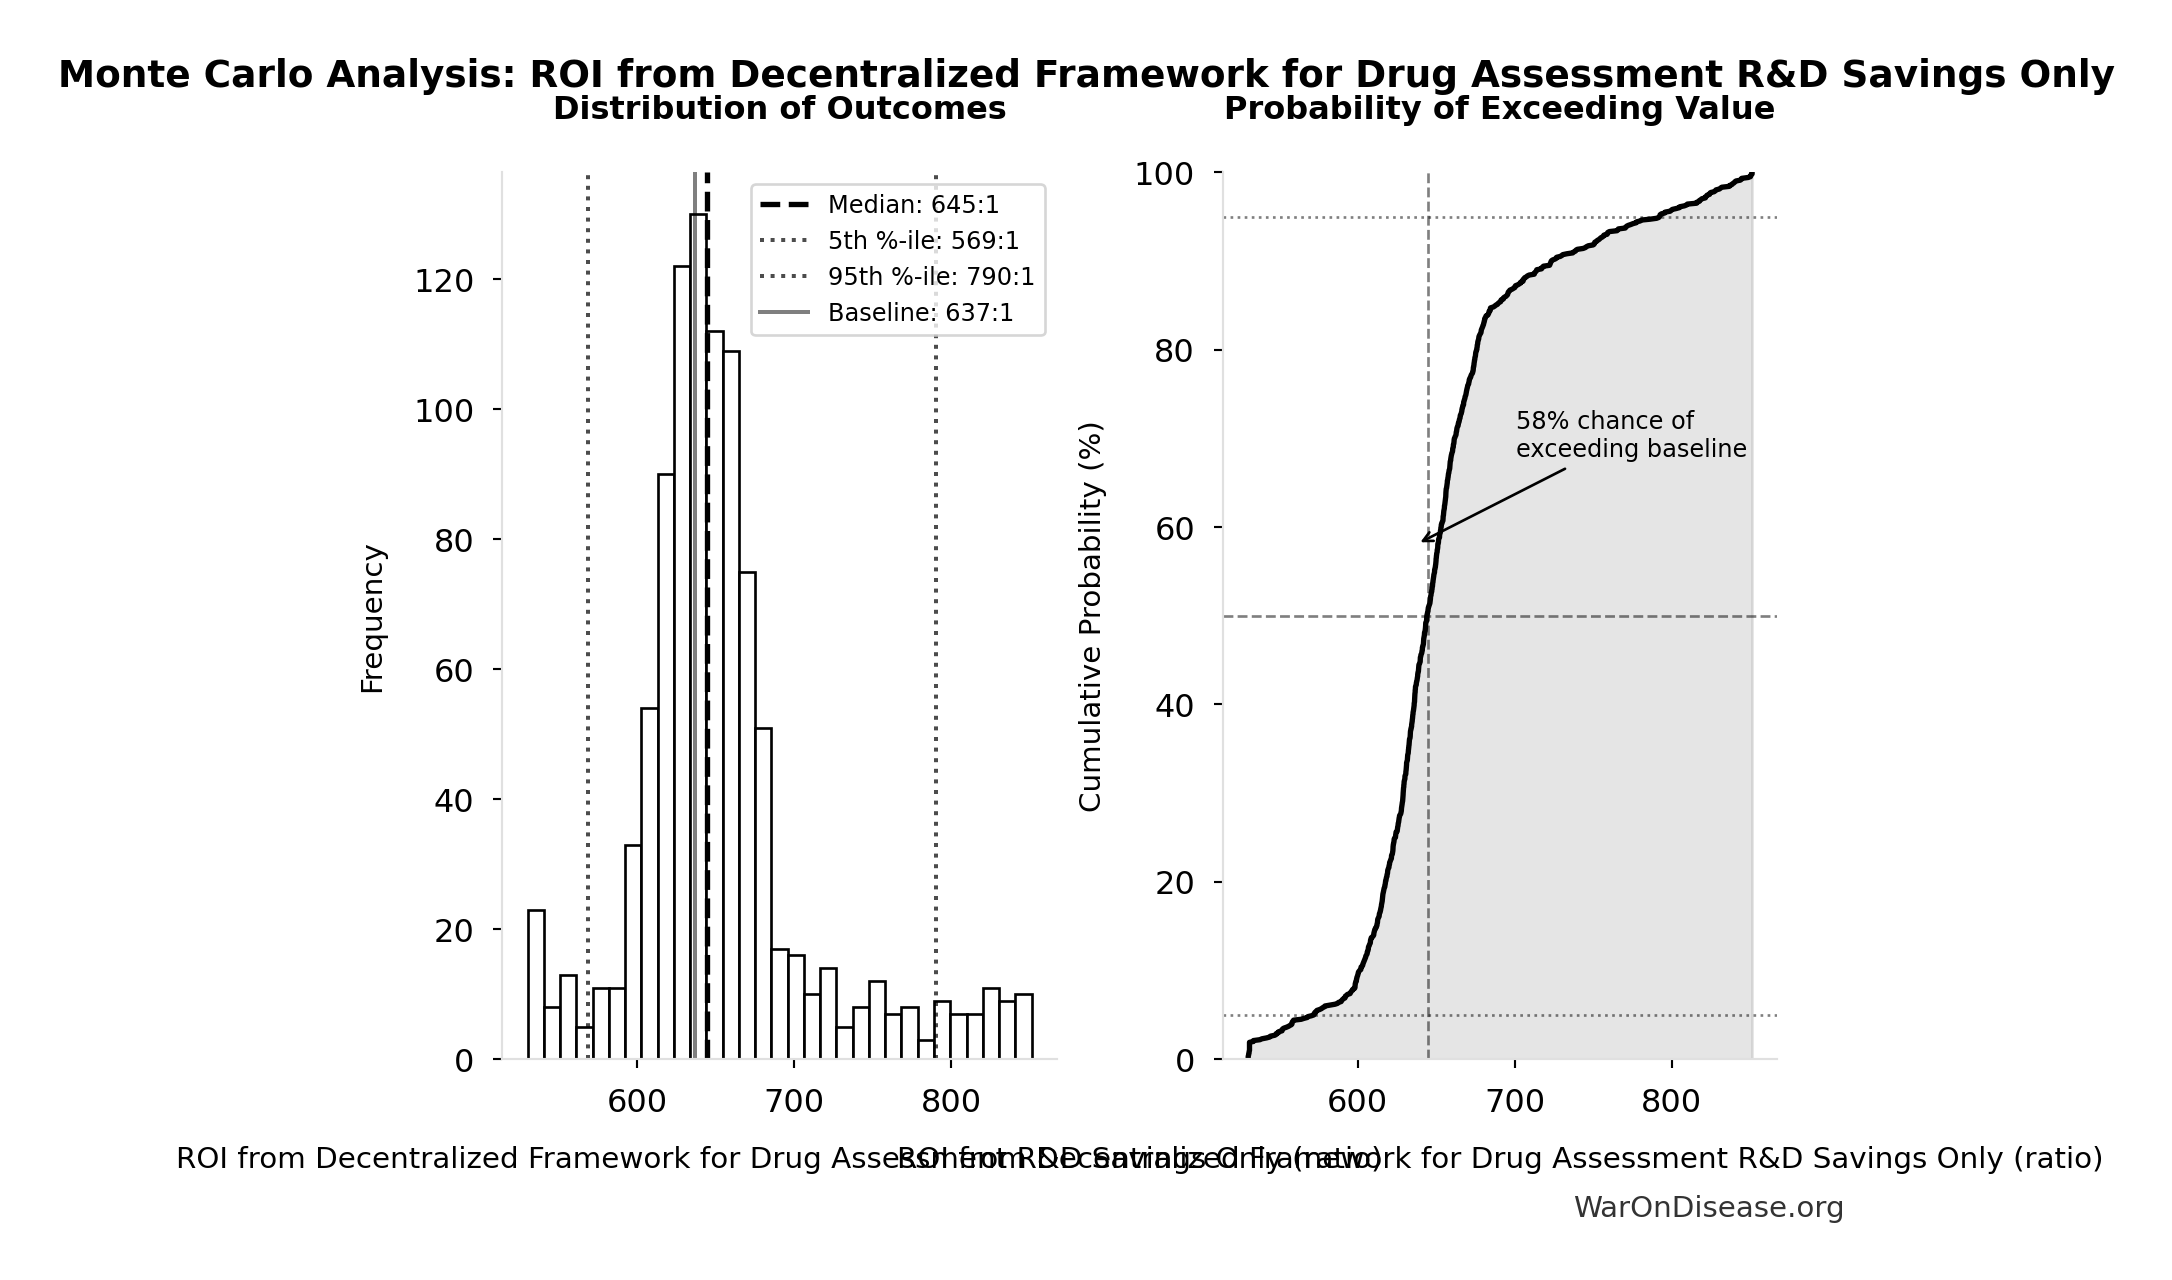
This exceedance probability chart shows the likelihood that ROI from Pragmatic Trial R&D Savings Only will exceed any given threshold. The higher the curve at a threshold, the more likely the value exceeds it.
Research Acceleration Mechanism
The 12.3x (90% CI: 4.92x-50.8x) research acceleration transforms our ability to explore a therapeutic space that is almost entirely untested.
The Unexplored Therapeutic Frontier
The fundamental problem isn’t that cures are hard to discover. It’s that we’re barely looking:
- 9.5 million combinations (90% CI: 6.68 million combinations-12.8 million combinations) plausible drug-disease pairings exist (9,500 compounds (95% CI: 7,000 compounds-12,000 compounds) safe × 1,000 diseases (95% CI: 800 diseases-1,200 diseases))
- Only 0.342% (90% CI: 0%-1%) of these combinations have been tested - 99.7% (90% CI: 99%-100%) remains unexplored
- Only 12% of the human interactome has ever been targeted by drugs
- 30% of approved drugs gain new indications, proving undiscovered uses exist
\[
\begin{gathered}
Ratio_{explore} \\
= \frac{N_{tested}}{N_{combos}} \\
= \frac{32{,}500}{9.5M} \\
= 0.342\%
\end{gathered}
\]
where:
\[
\begin{gathered}
N_{combos} \\
= N_{safe} \times N_{diseases,trial} \\
= 9{,}500 \times 1{,}000 \\
= 9.5M
\end{gathered}
\]
Some of those treatments are probably sitting among compounds already proven safe. Nobody has looked. See The Discovery Capacity Model for how 12.3x (90% CI: 4.92x-50.8x) trial capacity produces the 212 years (90% CI: 124 years-398 years) timeline shift.
Addressing the Returns Question: Diminishing, Linear, or Compounding?
A common objection is that “more trials won’t produce proportionally more cures” - the diminishing returns hypothesis. This deserves serious consideration, but the evidence suggests the opposite may be true.
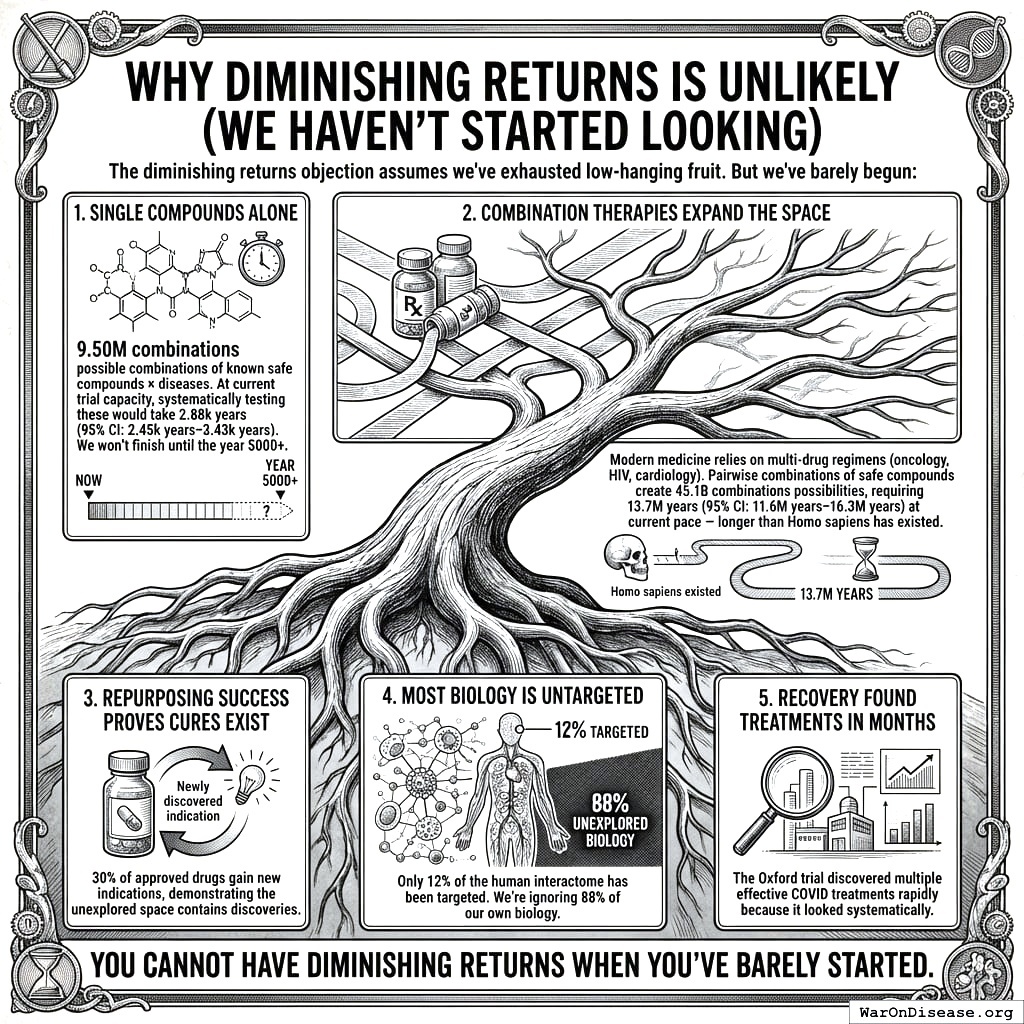
Why Diminishing Returns Is Unlikely (We Haven’t Started Looking)
The diminishing returns objection assumes we’ve exhausted low-hanging fruit. But we’ve barely begun:
- Single compounds alone: 9.5 million combinations (90% CI: 6.68 million combinations-12.8 million combinations) possible combinations of known safe compounds × diseases. At current trial capacity, systematically testing these would take 2,879 years (90% CI: 1,976 years-4,041 years). We won’t finish until the year 5000+.
\[
\begin{gathered}
T_{explore,safe} \\
= \frac{N_{combos}}{Trials_{ann,curr}} \\
= \frac{9.5M}{3{,}300} \\
= 2{,}880
\end{gathered}
\]
where:
\[
\begin{gathered}
N_{combos} \\
= N_{safe} \times N_{diseases,trial} \\
= 9{,}500 \times 1{,}000 \\
= 9.5M
\end{gathered}
\]
Combination therapies expand the space: Modern medicine relies on multi-drug regimens (oncology, HIV, cardiology). Pairwise combinations of safe compounds create 45.1 billion combinations (90% CI: 25 billion combinations-72.6 billion combinations) possibilities, requiring 13.7 million years (90% CI: 7.45 million years-22.6 million years) at current pace - longer than Homo sapiens has existed.
Repurposing success proves cures exist: 30% of approved drugs gain new indications, demonstrating the unexplored space contains discoveries.
Most biology is untargeted: Only 12% of the human interactome has been targeted. We’re ignoring 88% of our own biology.
RECOVERY found treatments in months: The Oxford trial discovered multiple effective COVID treatments rapidly because it looked systematically.
Mathematical Framework: When Would Diminishing Returns Dominate?
We can formalize the competing models to identify when diminishing returns would actually matter.
Model 1: Linear (Baseline)
\[ T_{discovered} = k_0 \cdot N_{trials} \]
Where \(k_0\) is the constant discovery rate (effective treatments per trial). This assumes the therapeutic space is sampled uniformly at random.
Model 2: Diminishing Returns (Pessimistic)
As we exhaust the therapeutic space, the hit rate decreases:
\[ k_{dim}(s) = k_0 \cdot (1 - s) \]
Where \(s = S_{explored}/S_{total}\) is the fraction of therapeutic space already tested. At current exploration (\(s < 0.01\)), this gives \(k_{dim} \approx 0.99 \cdot k_0\), virtually identical to linear.
Model 3: Learning/Compounding (Optimistic)
Each trial improves our biological models, increasing future hit rates:
\[ k_{learn}(n) = k_0 \cdot \left(1 + \alpha \cdot \ln(1 + n)\right) \]
Where \(\alpha\) is the learning coefficient and \(n\) is cumulative trials completed. Even modest learning (\(\alpha = 0.1\)) with 100,000 trials yields \(k_{learn} \approx 2.15 \cdot k_0\).
Model 4: Combined (Realistic)
Both effects operate simultaneously:
\[ k_{combined}(s, n) = k_0 \cdot (1 - s) \cdot \left(1 + \alpha \cdot \ln(1 + n)\right) \]
The Crossover Point: When Does Depletion Dominate Learning?
Diminishing returns dominates when the depletion factor exceeds the learning factor. Solving for the critical exploration fraction:
\[ s_{crossover} = 1 - \frac{1}{1 + \alpha \cdot \ln(1 + n)} \]
| Learning Coefficient (\(\alpha\)) | Trials Completed (\(n\)) | Crossover Exploration (\(s_{crossover}\)) |
|---|---|---|
| 0.05 (weak) | 100,000 | 37% |
| 0.10 (modest) | 100,000 | 53% |
| 0.15 (strong) | 100,000 | 63% |
Interpretation: Even with weak learning effects, diminishing returns only dominates after exploring 37%+ of therapeutic space. With modest learning, the crossover occurs at 53%+ exploration.
Timeline to Crossover:
At current exploration of 0.342% (90% CI: 0%-1%) (<1%), reaching the 53% crossover would require ~1,500 years at current pace or ~125 years with the protocol. For combination therapies (45.1 billion combinations (90% CI: 25 billion combinations-72.6 billion combinations)), reaching 53% exploration would take millions of years.
Conclusion: For any plausible planning horizon, learning effects dominate. Diminishing returns is a theoretical concern for civilizations operating on multi-century timescales, not a practical constraint for the next 100+ years of medical research.
The Conservative Default: Linear Assumption
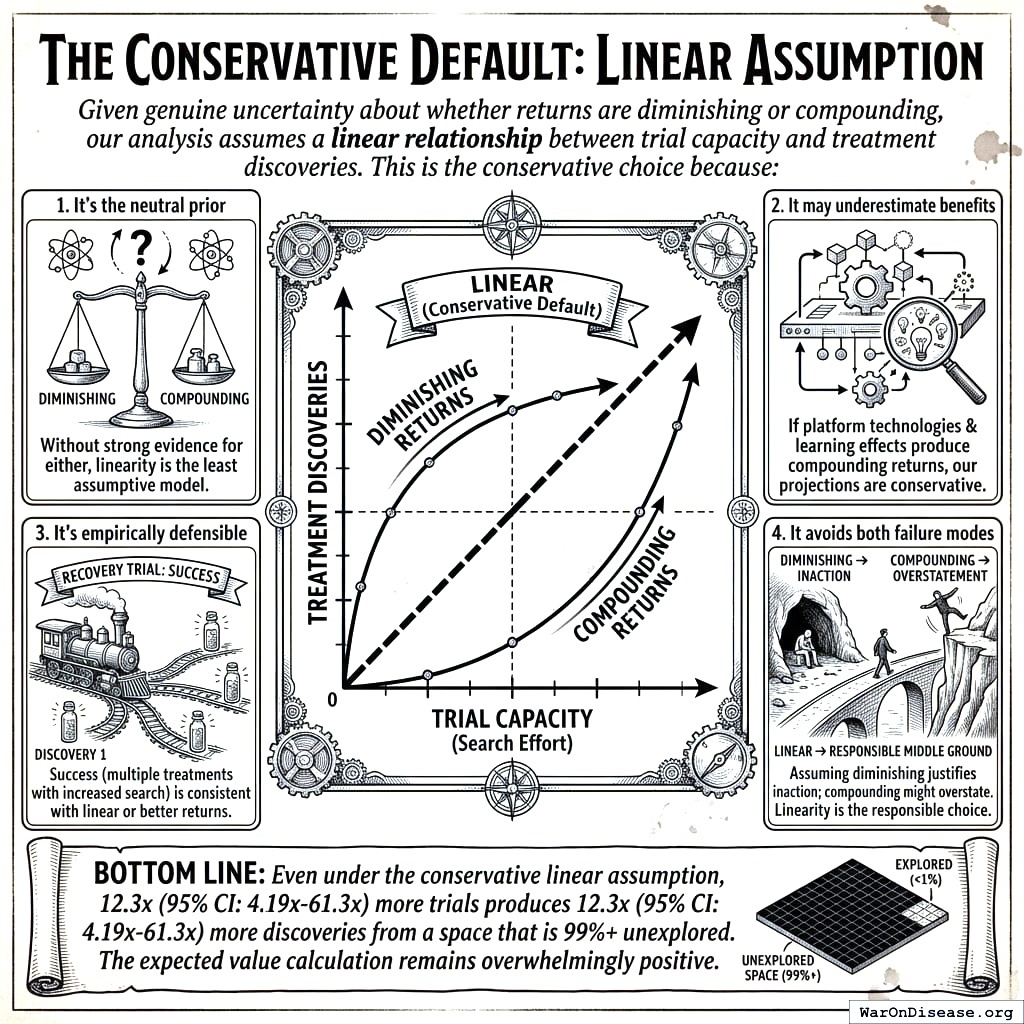
Given genuine uncertainty about whether returns are diminishing or compounding, our analysis assumes a linear relationship between trial capacity and treatment discoveries. This is the conservative choice because:
- It’s the neutral prior: Without strong evidence for either diminishing or compounding returns, linearity is the least assumptive model
- It may underestimate benefits: If platform technologies and learning effects produce compounding returns, our projections are conservative
- It’s empirically defensible: The RECOVERY trial’s success (multiple treatments found with increased search) is consistent with linear or better returns
Bottom line: Even under the conservative linear assumption, 12.3x (90% CI: 4.92x-50.8x) more trials produces 12.3x (90% CI: 4.92x-50.8x) more discoveries from a space that is 99%+ unexplored.
Funding Level vs. Cost-Effectiveness
While the analysis above addresses whether trials produce proportionally more cures, a separate question is how funding level affects cost per DALY averted. The acceleration formula \(T_{accel} = T_{baseline} \times (1 - 1/k)\), where \(k\) is the trial capacity multiplier, produces natural diminishing returns: each additional dollar buys less acceleration as \(k\) grows. Figure 110.1 shows cost per DALY rising with funding, while Figure 110.2 shows total DALYs approaching an asymptotic ceiling.
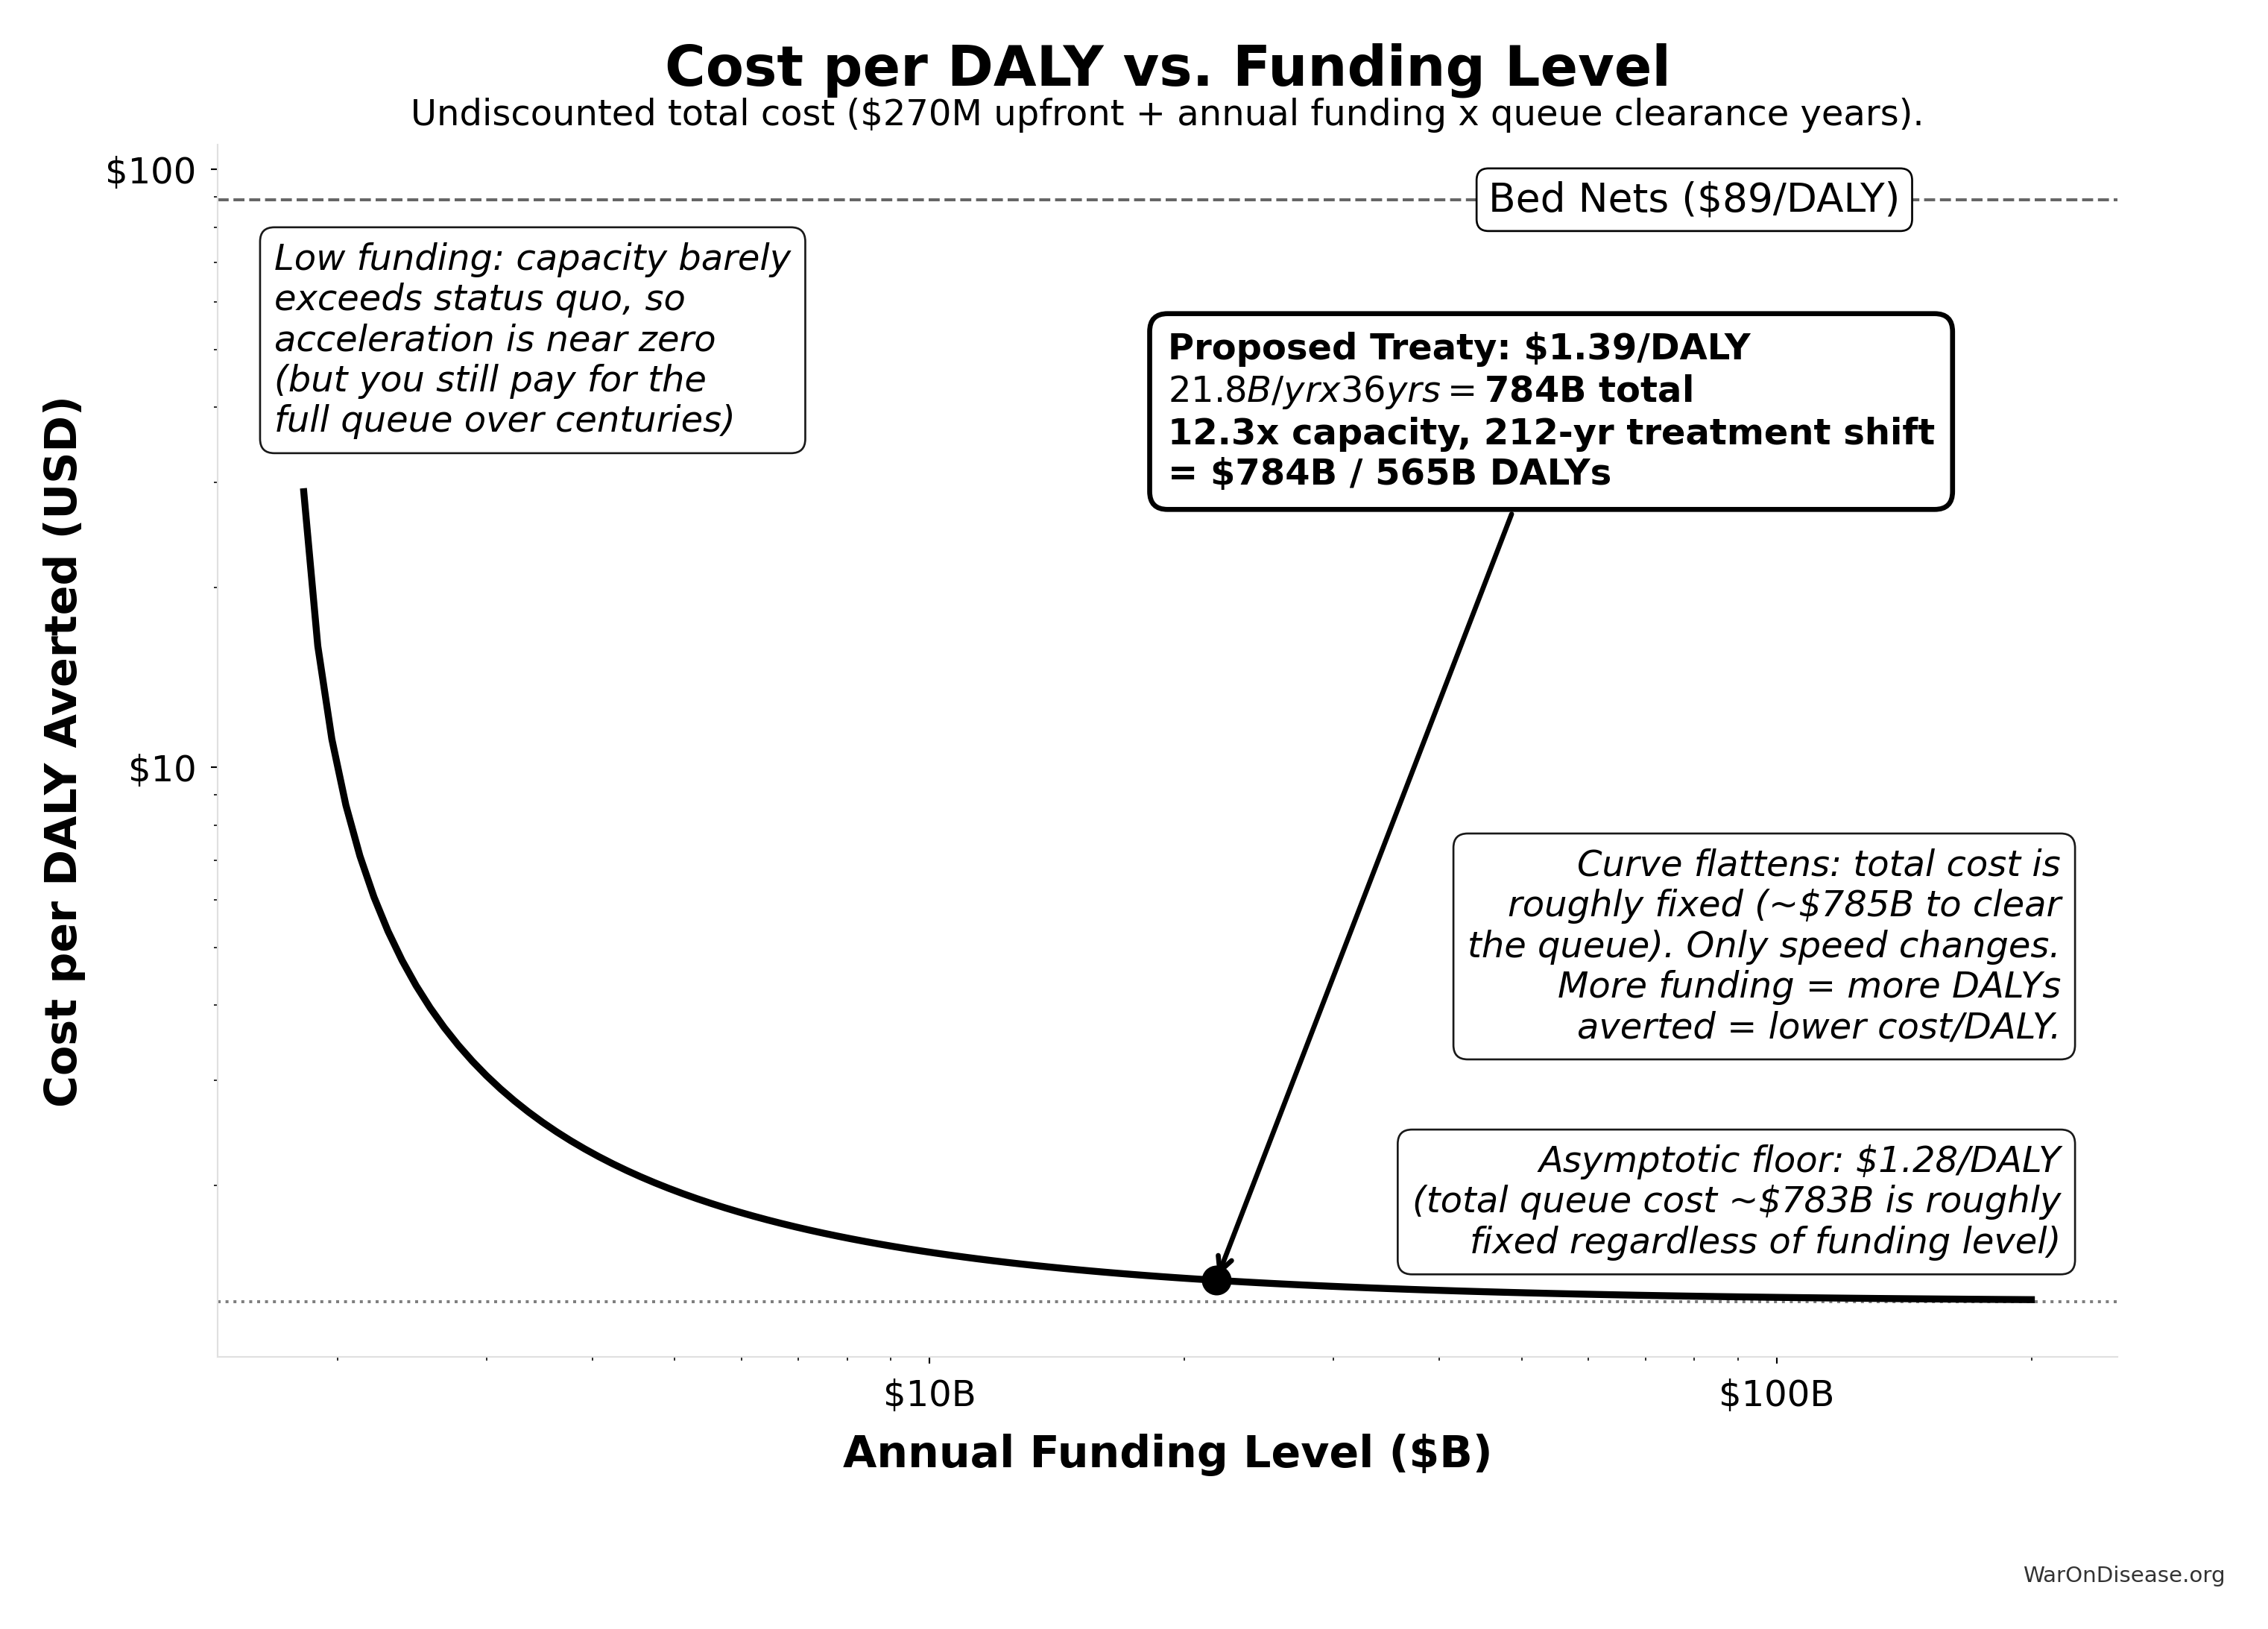
Verification at proposed funding ($21.8B/yr):
  Trial capacity multiplier: 12.3x
  Queue clearance: 36.0 years
  Treatment acceleration: 203.7 years
  Total timeline shift: 211.9 years
  DALYs averted: 565.2B
  Upfront cost: $270M
  Total undiscounted cost: $784.2B
  Cost per DALY: $1.39
  Asymptotic floor: $1.28/DALY (total queue cost: $783B)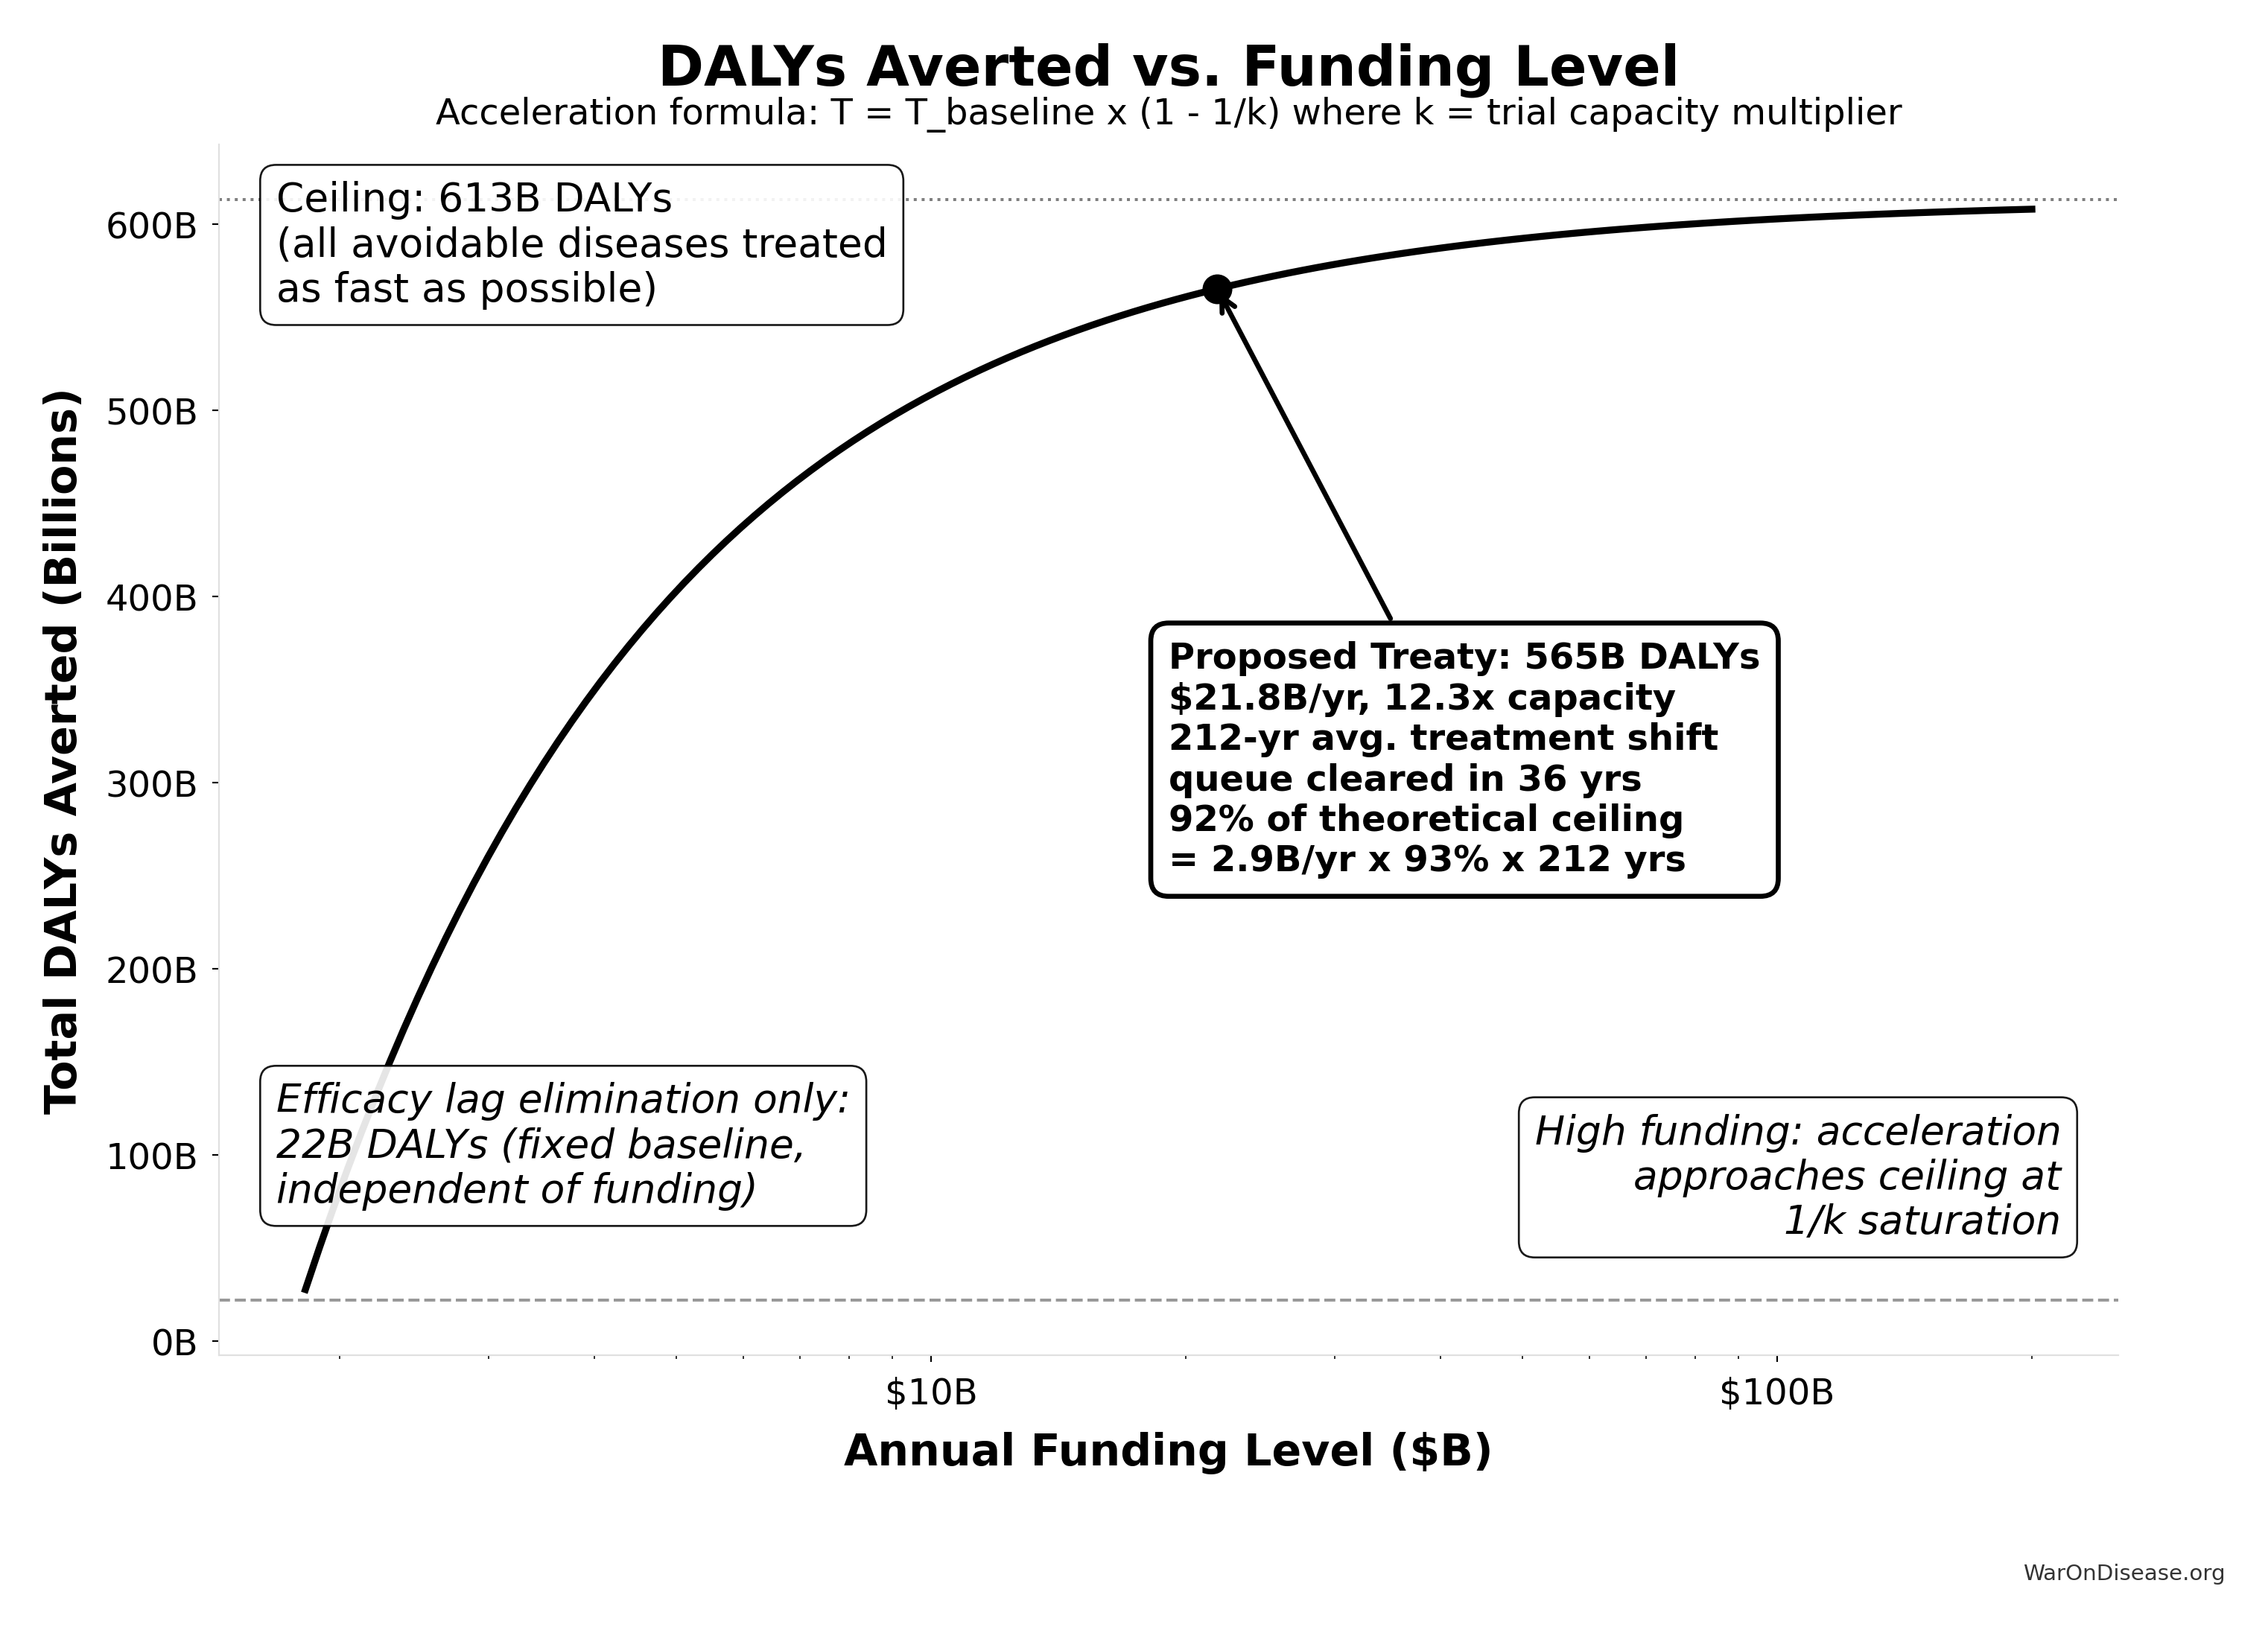
Verification at proposed funding ($21.8B/yr):
  Trial capacity multiplier: 12.3x
  Queue clearance: 36.0 years
  Treatment acceleration: 203.7 years
  Total timeline shift: 211.9 years
  DALYs averted: 565B
  Ceiling DALYs: 613B
  Utilization: 92.2% of ceiling
  Efficacy lag baseline: 22B DALYs
The proposed funding level ($21.8 billion/year) sits in the steep part of the curve, where cost-effectiveness is strongest. Even at much higher funding levels, the cost per DALY remains far below the bed nets benchmark ($89 (95% CI: $78-$100)/DALY).
Data Sources and Methodological Notes
Cost of Current Drug Development:
- Tufts Center for the Study of Drug Development often cited for $1.0 - $2.6 billion/drug.
- Journal articles and industry reports (IQVIA, Deloitte) also highlight $2+ billion figures.
ROI Calculation Method:
- Simplified approach comparing aggregated R&D spending to potential savings.
- Does not account for intangible factors (opportunity costs, IP complexities, time-value of money) beyond a basic Net Present Value (NPV) perspective.
Scale & Adoption Rates:
- The largest uncertainties revolve around uptake speed, regulatory harmonization, and participant willingness.
- Projections assume widespread adoption by major pharmaceutical companies and global health authorities.
Conclusion
The protocol reduces clinical trial costs by a factor of 44.1x (90% CI: 12.8x-210x), brings treatments to patients sooner, and extends trials to diseases no sponsor would otherwise fund. The 10-year NPV total cost is $611 million (90% CI: $499 million-$729 million) (upfront plus discounted annual operations), generating $268 billion (90% CI: $208 billion-$341 billion) in net R&D savings. Given that the pharmaceutical industry collectively spends $60 billion (95% CI: $50 billion-$75 billion) annually on clinical trials, 69% (90% CI: 61%-77%) of it on Phase II/III efficacy testing, a 97.7% (90% CI: 92%-100%) reduction on that share yields an ROI of 439 (90% CI: 321-600):1 at scale.
Beyond direct savings, the effects on medical progress are substantial: expanded therapeutic exploration, real-time treatment effectiveness rankings, and research on off-patent treatments that currently lack commercial incentives. With appropriate privacy protections and international coordination, the protocol enables evidence-based personalized medicine at global scale.
Disclaimer
All figures in this document are estimates based on publicly available information, industry benchmarks, and simplifying assumptions. Real-world costs, savings, and ROI will vary greatly depending on the scope of implementation, the speed of adoption, regulatory cooperation, and numerous other factors. Nonetheless, this high-level exercise illustrates the substantial potential gains from a global, continuously learning clinical trial system.
Verification: Complete Derivation Chains
For economist verification, this section provides complete derivation chains for all headline figures. Each metric traces back to primary data sources.
Trial Capacity Multiplier Derivation
Result: 12.3x (90% CI: 4.92x-50.8x)
Step 1: Current trial capacity
- Current trial participants: 1.9 million
- Current first treatments: 15 diseases/year (95% CI: 8 diseases/year-30 diseases/year)
Step 2: Capacity with $21.8 billion/year
- Cost per patient: $929 (95% CI: $97-$3,000)
- Fundable patients: 23.4 million
Step 3: Calculate multiplier
\[
\begin{gathered}
k_{capacity} \\
= \frac{N_{fundable,ref}}{Slots_{curr}} \\
= \frac{23.4M}{1.9M} \\
= 12.3
\end{gathered}
\]
where:
\[
\begin{gathered}
N_{fundable,ref} \\
= \frac{Subsidies_{trial,ref}}{Cost_{pragmatic,pt}} \\
= \frac{\$21.8B}{\$929} \\
= 23.4M
\end{gathered}
\]
where:
\[
\begin{gathered}
Subsidies_{trial,ref} \\
= Funding_{trial,ref} - OPEX_{trial} \\
= \$21.8B - \$40M \\
= \$21.8B
\end{gathered}
\]
where:
\[
\begin{gathered}
OPEX_{trial} \\
= Cost_{platform} + Cost_{staff} + Cost_{infra} \\
+ Cost_{regulatory} + Cost_{community} \\
= \$15M + \$10M + \$8M + \$5M + \$2M \\
= \$40M
\end{gathered}
\]
Timeline Shift Derivation
Result: 212 years (90% CI: 124 years-398 years)
Components:
| Component | Value | Source |
|---|---|---|
| Efficacy Lag Elimination | FDA drug approval timeline data | |
| Discovery Acceleration | Capacity vs. backlog model | |
| Combined Total | 212 years (90% CI: 124 years-398 years) | Sum of components |
\[
T_{accel,max} = T_{accel} + T_{lag} = 204 + 8.2 = 212
\]
where:
\[
\begin{gathered}
T_{accel} \\
= T_{first,SQ} \times \left(1 - \frac{1}{k_{capacity}}\right) \\
= 222 \times \left(1 - \frac{1}{12.3}\right) \\
= 204
\end{gathered}
\]
where:
\[
\begin{gathered}
T_{first,SQ} \\
= T_{queue,SQ} \times 0.5 \\
= 443 \times 0.5 \\
= 222
\end{gathered}
\]
where:
\[
\begin{gathered}
T_{queue,SQ} \\
= \frac{N_{untreated}}{Treatments_{new,ann}} \\
= \frac{6{,}650}{15} \\
= 443
\end{gathered}
\]
where:
\[
\begin{gathered}
N_{untreated} \\
= N_{rare} \times 0.95 \\
= 7{,}000 \times 0.95 \\
= 6{,}650
\end{gathered}
\]
where:
\[
\begin{gathered}
k_{capacity} \\
= \frac{N_{fundable,ref}}{Slots_{curr}} \\
= \frac{23.4M}{1.9M} \\
= 12.3
\end{gathered}
\]
where:
\[
\begin{gathered}
N_{fundable,ref} \\
= \frac{Subsidies_{trial,ref}}{Cost_{pragmatic,pt}} \\
= \frac{\$21.8B}{\$929} \\
= 23.4M
\end{gathered}
\]
where:
\[
\begin{gathered}
Subsidies_{trial,ref} \\
= Funding_{trial,ref} - OPEX_{trial} \\
= \$21.8B - \$40M \\
= \$21.8B
\end{gathered}
\]
where:
\[
\begin{gathered}
OPEX_{trial} \\
= Cost_{platform} + Cost_{staff} + Cost_{infra} \\
+ Cost_{regulatory} + Cost_{community} \\
= \$15M + \$10M + \$8M + \$5M + \$2M \\
= \$40M
\end{gathered}
\]
Lives Saved Derivation
Result: 10.7 billion deaths (90% CI: 6.24 billion deaths-20.3 billion deaths)
Step 1: Daily mortality from eventually avoidable causes
- Global disease deaths: 150,000/day14
- Eventually avoidable percentage: 92.6% (95% CI: 50%-98%)
Step 2: Timeline shift period
- Total shift: 212 years (90% CI: 124 years-398 years)
Step 3: Calculate lives saved
\[
\begin{gathered}
Lives_{max} \\
= Deaths_{disease,daily} \times T_{accel,max} \times 338 \\
= 150{,}000 \times 212 \times 338 \\
= 10.7B
\end{gathered}
\]
where:
\[
T_{accel,max} = T_{accel} + T_{lag} = 204 + 8.2 = 212
\]
where:
\[
\begin{gathered}
T_{accel} \\
= T_{first,SQ} \times \left(1 - \frac{1}{k_{capacity}}\right) \\
= 222 \times \left(1 - \frac{1}{12.3}\right) \\
= 204
\end{gathered}
\]
where:
\[
\begin{gathered}
T_{first,SQ} \\
= T_{queue,SQ} \times 0.5 \\
= 443 \times 0.5 \\
= 222
\end{gathered}
\]
where:
\[
\begin{gathered}
T_{queue,SQ} \\
= \frac{N_{untreated}}{Treatments_{new,ann}} \\
= \frac{6{,}650}{15} \\
= 443
\end{gathered}
\]
where:
\[
\begin{gathered}
N_{untreated} \\
= N_{rare} \times 0.95 \\
= 7{,}000 \times 0.95 \\
= 6{,}650
\end{gathered}
\]
where:
\[
\begin{gathered}
k_{capacity} \\
= \frac{N_{fundable,ref}}{Slots_{curr}} \\
= \frac{23.4M}{1.9M} \\
= 12.3
\end{gathered}
\]
where:
\[
\begin{gathered}
N_{fundable,ref} \\
= \frac{Subsidies_{trial,ref}}{Cost_{pragmatic,pt}} \\
= \frac{\$21.8B}{\$929} \\
= 23.4M
\end{gathered}
\]
where:
\[
\begin{gathered}
Subsidies_{trial,ref} \\
= Funding_{trial,ref} - OPEX_{trial} \\
= \$21.8B - \$40M \\
= \$21.8B
\end{gathered}
\]
where:
\[
\begin{gathered}
OPEX_{trial} \\
= Cost_{platform} + Cost_{staff} + Cost_{infra} \\
+ Cost_{regulatory} + Cost_{community} \\
= \$15M + \$10M + \$8M + \$5M + \$2M \\
= \$40M
\end{gathered}
\]
Cost per DALY Derivation
Result: $0.842 (90% CI: $0.264-$1.49)
Step 1: Total cost (NPV of $21.8 billion/year trial funding over the 36 years (90% CI: 8.15 years-106 years) clearance period, discounted at 3%)
The protocol infrastructure itself ($611 million (90% CI: $499 million-$729 million) 10-year NPV) is small next to the trial funding, which is what actually buys the DALYs, so the trial funding is the numerator.
Step 2: DALYs averted
- Total DALYs: 565 billion
Step 3: Calculate cost per DALY
\[
\begin{gathered}
Cost_{direct,DALY} \\
= \frac{NPV_{direct}}{DALYs_{max}} \\
= \frac{\$476B}{565B} \\
= \$0.842
\end{gathered}
\]
where:
\[
\begin{gathered}
NPV_{direct} \\
= \frac{T_{queue,trial}}{Funding_{trial,ref} \times r_{discount}} \\
= \frac{36}{\$21.8B \times 3\%} \\
= \$476B
\end{gathered}
\]
where:
\[
\begin{gathered}
T_{queue,trial} \\
= \frac{T_{queue,SQ}}{k_{capacity}} \\
= \frac{443}{12.3} \\
= 36
\end{gathered}
\]
where:
\[
\begin{gathered}
T_{queue,SQ} \\
= \frac{N_{untreated}}{Treatments_{new,ann}} \\
= \frac{6{,}650}{15} \\
= 443
\end{gathered}
\]
where:
\[
\begin{gathered}
N_{untreated} \\
= N_{rare} \times 0.95 \\
= 7{,}000 \times 0.95 \\
= 6{,}650
\end{gathered}
\]
where:
\[
\begin{gathered}
k_{capacity} \\
= \frac{N_{fundable,ref}}{Slots_{curr}} \\
= \frac{23.4M}{1.9M} \\
= 12.3
\end{gathered}
\]
where:
\[
\begin{gathered}
N_{fundable,ref} \\
= \frac{Subsidies_{trial,ref}}{Cost_{pragmatic,pt}} \\
= \frac{\$21.8B}{\$929} \\
= 23.4M
\end{gathered}
\]
where:
\[
\begin{gathered}
Subsidies_{trial,ref} \\
= Funding_{trial,ref} - OPEX_{trial} \\
= \$21.8B - \$40M \\
= \$21.8B
\end{gathered}
\]
where:
\[
\begin{gathered}
OPEX_{trial} \\
= Cost_{platform} + Cost_{staff} + Cost_{infra} \\
+ Cost_{regulatory} + Cost_{community} \\
= \$15M + \$10M + \$8M + \$5M + \$2M \\
= \$40M
\end{gathered}
\]
where:
\[
\begin{gathered}
DALYs_{max} \\
= DALYs_{global,ann} \times Pct_{avoid,DALY} \times T_{accel,max} \\
= 2.88B \times 92.6\% \times 212 \\
= 565B
\end{gathered}
\]
where:
\[
T_{accel,max} = T_{accel} + T_{lag} = 204 + 8.2 = 212
\]
where:
\[
\begin{gathered}
T_{accel} \\
= T_{first,SQ} \times \left(1 - \frac{1}{k_{capacity}}\right) \\
= 222 \times \left(1 - \frac{1}{12.3}\right) \\
= 204
\end{gathered}
\]
where:
\[
\begin{gathered}
T_{first,SQ} \\
= T_{queue,SQ} \times 0.5 \\
= 443 \times 0.5 \\
= 222
\end{gathered}
\]
Comparison: Malaria bed nets cost $89 (95% CI: $78-$100)/DALY. The protocol operates at vastly greater scale while achieving competitive cost-effectiveness.
ROI Derivation
Result: 439 (90% CI: 321-600):1
Step 1: Calculate benefits
- Annual R&D savings: $40.5 billion (90% CI: $31.4 billion-$51.5 billion)
- 10-year NPV of savings: $269 billion (90% CI: $208 billion-$342 billion)
Step 2: Calculate costs
- 10-year NPV total cost: $611 million (90% CI: $499 million-$729 million)
Step 3: Calculate ROI
\[
\begin{gathered}
ROI_{RD} \\
= \frac{NPV_{RD}}{Cost_{platform,total}} \\
= \frac{\$269B}{\$611M} \\
= 439
\end{gathered}
\]
where:
\[
\begin{gathered}
NPV_{RD} \\
= \sum_{t=1}^{10} \frac{Savings_{RD,ann} \cdot \frac{\min(t,5)}{5}}{(1+r)^t}
\end{gathered}
\]
where:
\[
\begin{gathered}
Savings_{RD,ann} \\
= Benefit_{RD,ann} - OPEX_{trial} \\
= \$40.5B - \$40M \\
= \$40.4B
\end{gathered}
\]
where:
\[
\begin{gathered}
Benefit_{RD,ann} \\
= Spending_{trials} \times Pct_{P2+P3} \times Reduce_{pct} \\
= \$60B \times 69\% \times 97.7\% \\
= \$40.5B
\end{gathered}
\]
where:
\[
\begin{gathered}
Reduce_{pct} \\
= 1 - \frac{Cost_{pragmatic,pt}}{Cost_{P3,pt}} \\
= 1 - \frac{\$929}{\$41K} \\
= 97.7\%
\end{gathered}
\]
where:
\[
\begin{gathered}
OPEX_{trial} \\
= Cost_{platform} + Cost_{staff} + Cost_{infra} \\
+ Cost_{regulatory} + Cost_{community} \\
= \$15M + \$10M + \$8M + \$5M + \$2M \\
= \$40M
\end{gathered}
\]
where:
\[
\begin{gathered}
Cost_{platform,total} \\
= PV_{OPEX} + Cost_{upfront,total} \\
= \$342M + \$270M \\
= \$611M
\end{gathered}
\]
where:
\[
\begin{gathered}
PV_{OPEX} \\
= \frac{T_{horizon}}{OPEX_{total} \times r_{discount}} \\
= \frac{10}{\$40M \times 3\%} \\
= \$342M
\end{gathered}
\]
where:
\[
\begin{gathered}
OPEX_{total} \\
= OPEX_{ann} + OPEX_{DIH,ann} \\
= \$18.9M + \$21.1M \\
= \$40M
\end{gathered}
\]
where:
\[
\begin{gathered}
Cost_{upfront,total} \\
= Cost_{upfront} + Cost_{DIH,init} \\
= \$40M + \$230M \\
= \$270M
\end{gathered}
\]
Verification Summary
| Metric | Value | Primary Inputs | Data Sources |
|---|---|---|---|
| Trial Capacity | Funding, trial costs | ADAPTABLE trial, ClinicalTrials.gov | |
| Timeline Shift | Efficacy lag, backlog model | FDA approval data, disease registry | |
| Lives Saved | Mortality rates, timeline | WHO GBD, mortality statistics | |
| Cost/DALY | Trial funding NPV, DALYs | Funding scenario, WHO GBD | |
| ROI | 439 (90% CI: 321-600):1 | Costs, savings | NPV analysis with 5-year ramp |
All parameters, confidence intervals, and Monte Carlo distributions are documented in Parameters and Calculations.
Key Analytical Assumptions
This analysis rests on several core assumptions that should be made explicit for academic transparency:
Linear Scaling Assumption
Assumption: Each additional dollar of trial funding produces proportional additional discoveries.
Justification: This is actually conservative - network effects in data aggregation and platform economics often produce increasing returns. We assume linear to avoid overstating benefits.
Sensitivity: If returns are sublinear (diminishing), health impact estimates would be reduced. However, as documented in Addressing the Returns Question, diminishing returns are unlikely when <1% of therapeutic space has been explored.
Adoption Rate Assumptions
Assumption: Protocol adoption follows a 5-year ramp (20%, 40%, 60%, 80%, 100%) before reaching full capacity.
Justification: Based on historical technology adoption curves in healthcare (EHR adoption, telemedicine during COVID). The ramp is built into NPV calculations.
Sensitivity: Slower adoption delays benefits but doesn’t change eventual steady-state impact. NPV is reduced with slower adoption due to discounting.
Cost Reduction Assumptions
Assumption: Pragmatic trials cost $929 (95% CI: $97-$3,000)/patient versus $41,000 (95% CI: $20,000-$120,000)/patient for traditional trials.
Justification: Based on ADAPTABLE trial ($929 (95% CI: $929-$1,400)/patient) and systematic review of 64 pragmatic trials (median $97 (95% CI: $19-$478)/patient). RECOVERY achieved $500 (95% CI: $400-$2,500)/patient under exceptional NHS/COVID conditions.
Sensitivity: The tornado diagrams show ROI remains strongly positive even at 30% cost reduction (vs. baseline 97.7% (90% CI: 92%-100%)).
Eventually Avoidable Mortality Assumption
Assumption: 92.6% (95% CI: 50%-98%) of disease deaths are eventually avoidable with sufficient biomedical research.
Justification: Historical trend shows ~70% reduction in age-adjusted mortality since 1900. Most major disease categories have known biological mechanisms amenable to intervention. See Why “Eventually Avoidable” Matters.
Sensitivity: Health impact scales linearly with this assumption. At 50% avoidability (the low end of the confidence interval), health benefits fall by roughly half. R&D savings are unaffected.
Counterfactual Baseline Specification
This cost-effectiveness analysis uses the status quo as the baseline counterfactual: current clinical trial infrastructure continues operating at current efficiency ($41,000 (95% CI: $20,000-$120,000)/patient) and capacity (1.9 million participants/year). Under this baseline, the $21.8 billion/year allocated to pragmatic trials would not exist.
Why status quo is the appropriate baseline:
- No comparable interventions exist at scale: PCORnet and RECOVERY demonstrate the per-patient cost; no competing proposal funds pragmatic trials at this volume
- Historical trend supports it: Trial costs have increased, not decreased, over the past 50 years (105x (90% CI: 72.8x-149x) since 1962)
- Incremental improvements are marginal: Ongoing digitization efforts (DCT platforms, EHR integration) produce 10-20% efficiency gains, not the 97.7% (90% CI: 92%-100%) reduction from pragmatic trial design
Alternative counterfactual scenarios:
Organic efficiency improvement: Clinical trial costs decrease 2-3% annually through technology adoption. Under this scenario, the marginal impact of the protocol is reduced by the amount of improvement that would occur anyway. At 3%/year organic improvement over 10 years, approximately 26% of the cost reduction would occur regardless, reducing the protocol’s attributable benefit to ~74% of projections.
Alternative government priorities: Funds are allocated to other health investments (NIH grants, hospital infrastructure, insurance subsidies). Each alternative use would require separate cost-benefit analysis. However, none of these alternatives address the core trial cost problem; they operate within the existing high-cost system.
Return to taxpayers: Funds are returned via tax cuts, enabling private consumption and investment. Under this scenario, the opportunity cost equals the weighted average return on private capital (approximately 3% annually). The protocol ROI of 439 (90% CI: 321-600):1 substantially exceeds this threshold.
Methodological note: The analysis uses the neutral status quo baseline to avoid biasing results in either direction. Sensitivity analysis (tornado diagrams) demonstrates robustness across baseline assumptions.
Methodology Validation Against Accepted Benchmarks
This analysis uses standard health economics methodology identical to that employed by EPA, DOT, GiveWell, NICE, WHO-CHOICE, and CBO:
| Our Method | Equivalent Standard | Institution Using It |
|---|---|---|
| Value of Statistical Life ($10 million (95% CI: $5 million-$15 million)) | VSL for regulatory impact | EPA, DOT, FDA |
| Cost per DALY ($0.842 (90% CI: $0.264-$1.49)/DALY) | ICER thresholds | GiveWell, NICE, WHO-CHOICE |
| Monte Carlo uncertainty propagation | Probabilistic sensitivity analysis | ICER, Cochrane, HTA agencies |
| NPV with discount rate | Standard cost-benefit analysis | CBO, OMB Circular A-94 |
| Long-horizon cumulative impact | Social cost of carbon | EPA, IPCC, Stern Review |
Our 90% confidence intervals on the headline figures span a factor of three or more.
Appendix Calculation Frameworks and Detailed Analysis
Calculation Framework - NPV Methodology
Uses 10-year NPV horizon (standard business practice). See Verification: Complete Derivation Chains for full methodology.
Health Impact Uncertainty Analysis
These Monte Carlo distributions show the range of health impact estimates across 10,000 simulations, accounting for uncertainty in timeline shift, mortality rates, and avoidable percentages:
Lives Saved Distribution:
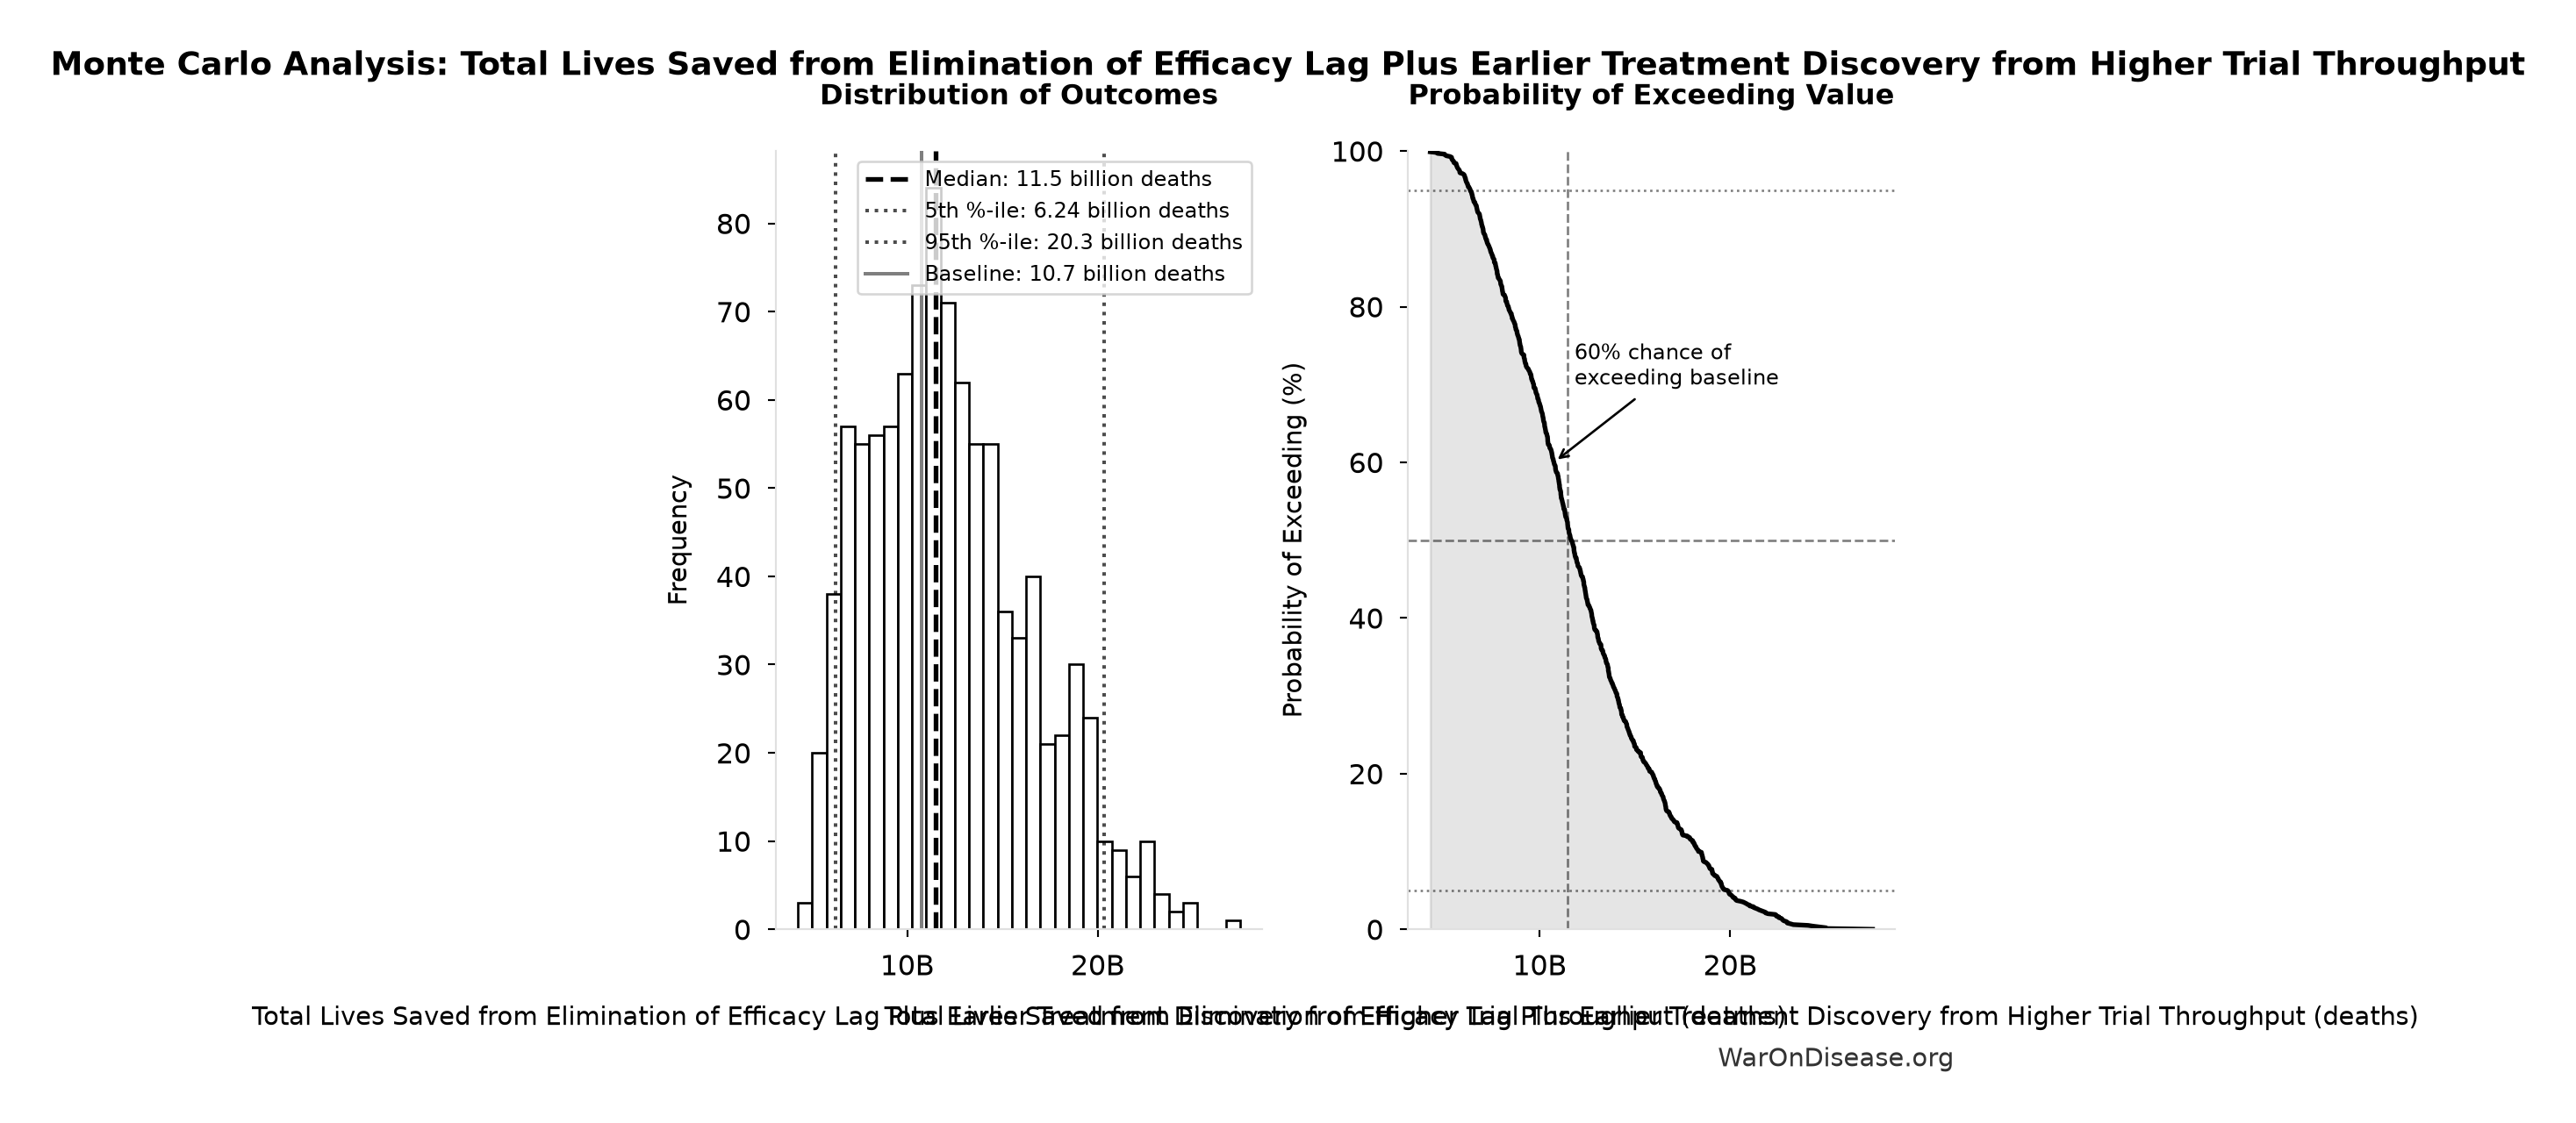
Simulation Results Summary: Total Lives Saved from Elimination of Efficacy Lag Plus Earlier Treatment Discovery from Higher Trial Throughput
| Statistic | Value |
|---|---|
| Baseline (deterministic) | 10.7 billion |
| Mean (expected value) | 12.1 billion |
| Median (50th percentile) | 11.5 billion |
| Standard Deviation | 4.28 billion |
| 90% Range (5th-95th percentile) | [6.24 billion, 20.3 billion] |
The histogram shows 1,000 of the 10,000 Monte Carlo draws for Total Lives Saved from Elimination of Efficacy Lag Plus Earlier Treatment Discovery from Higher Trial Throughput; the summary statistics use all 10,000. The exceedance curve (right) shows the probability of the outcome exceeding any given value.
Economic Value Distribution:
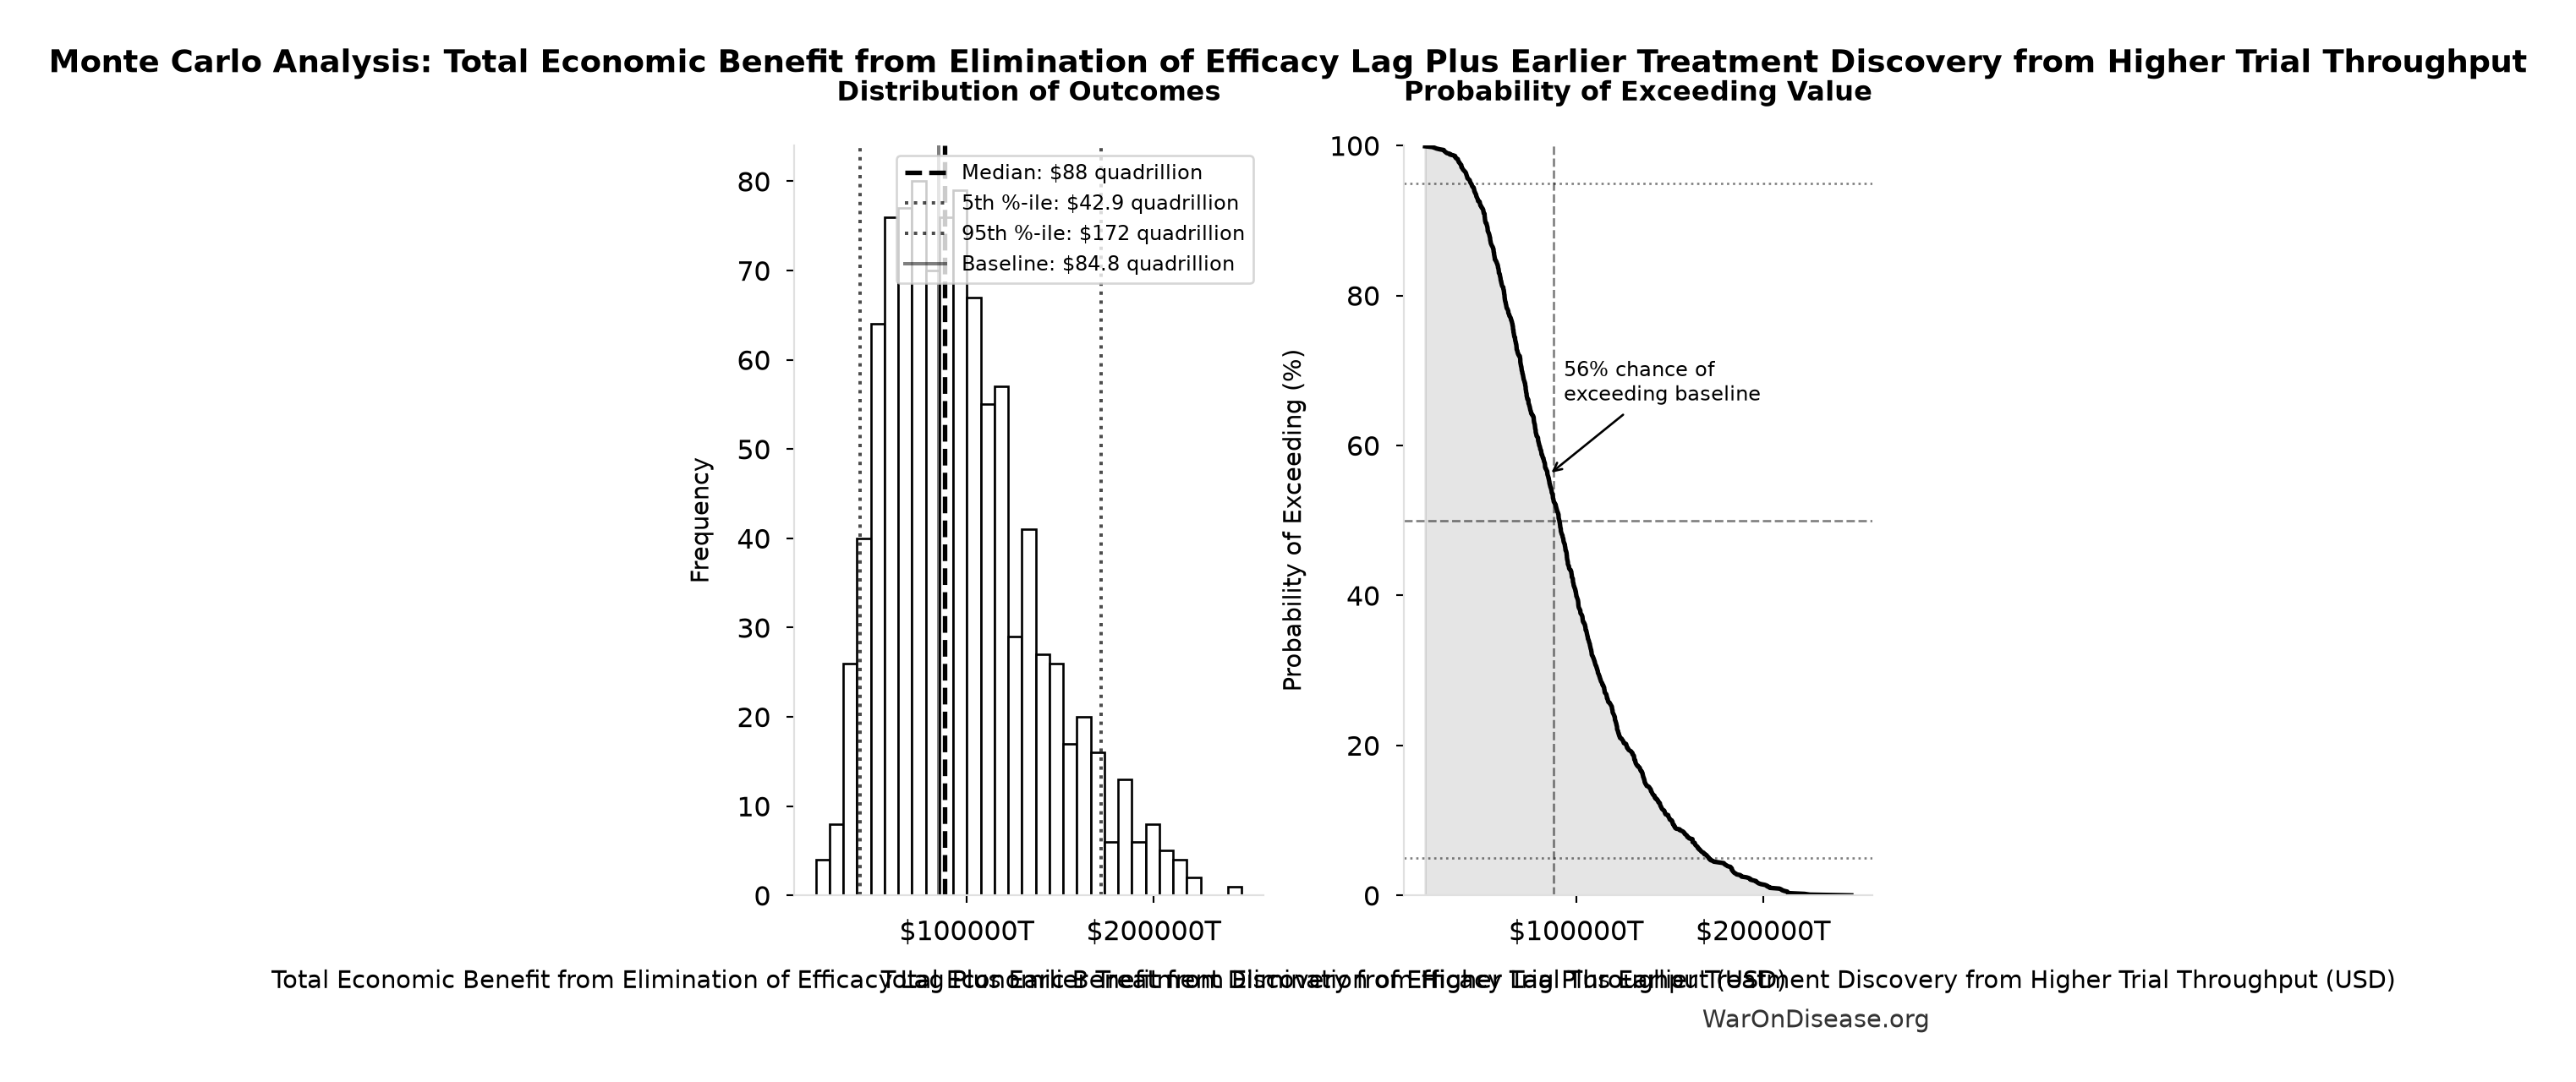
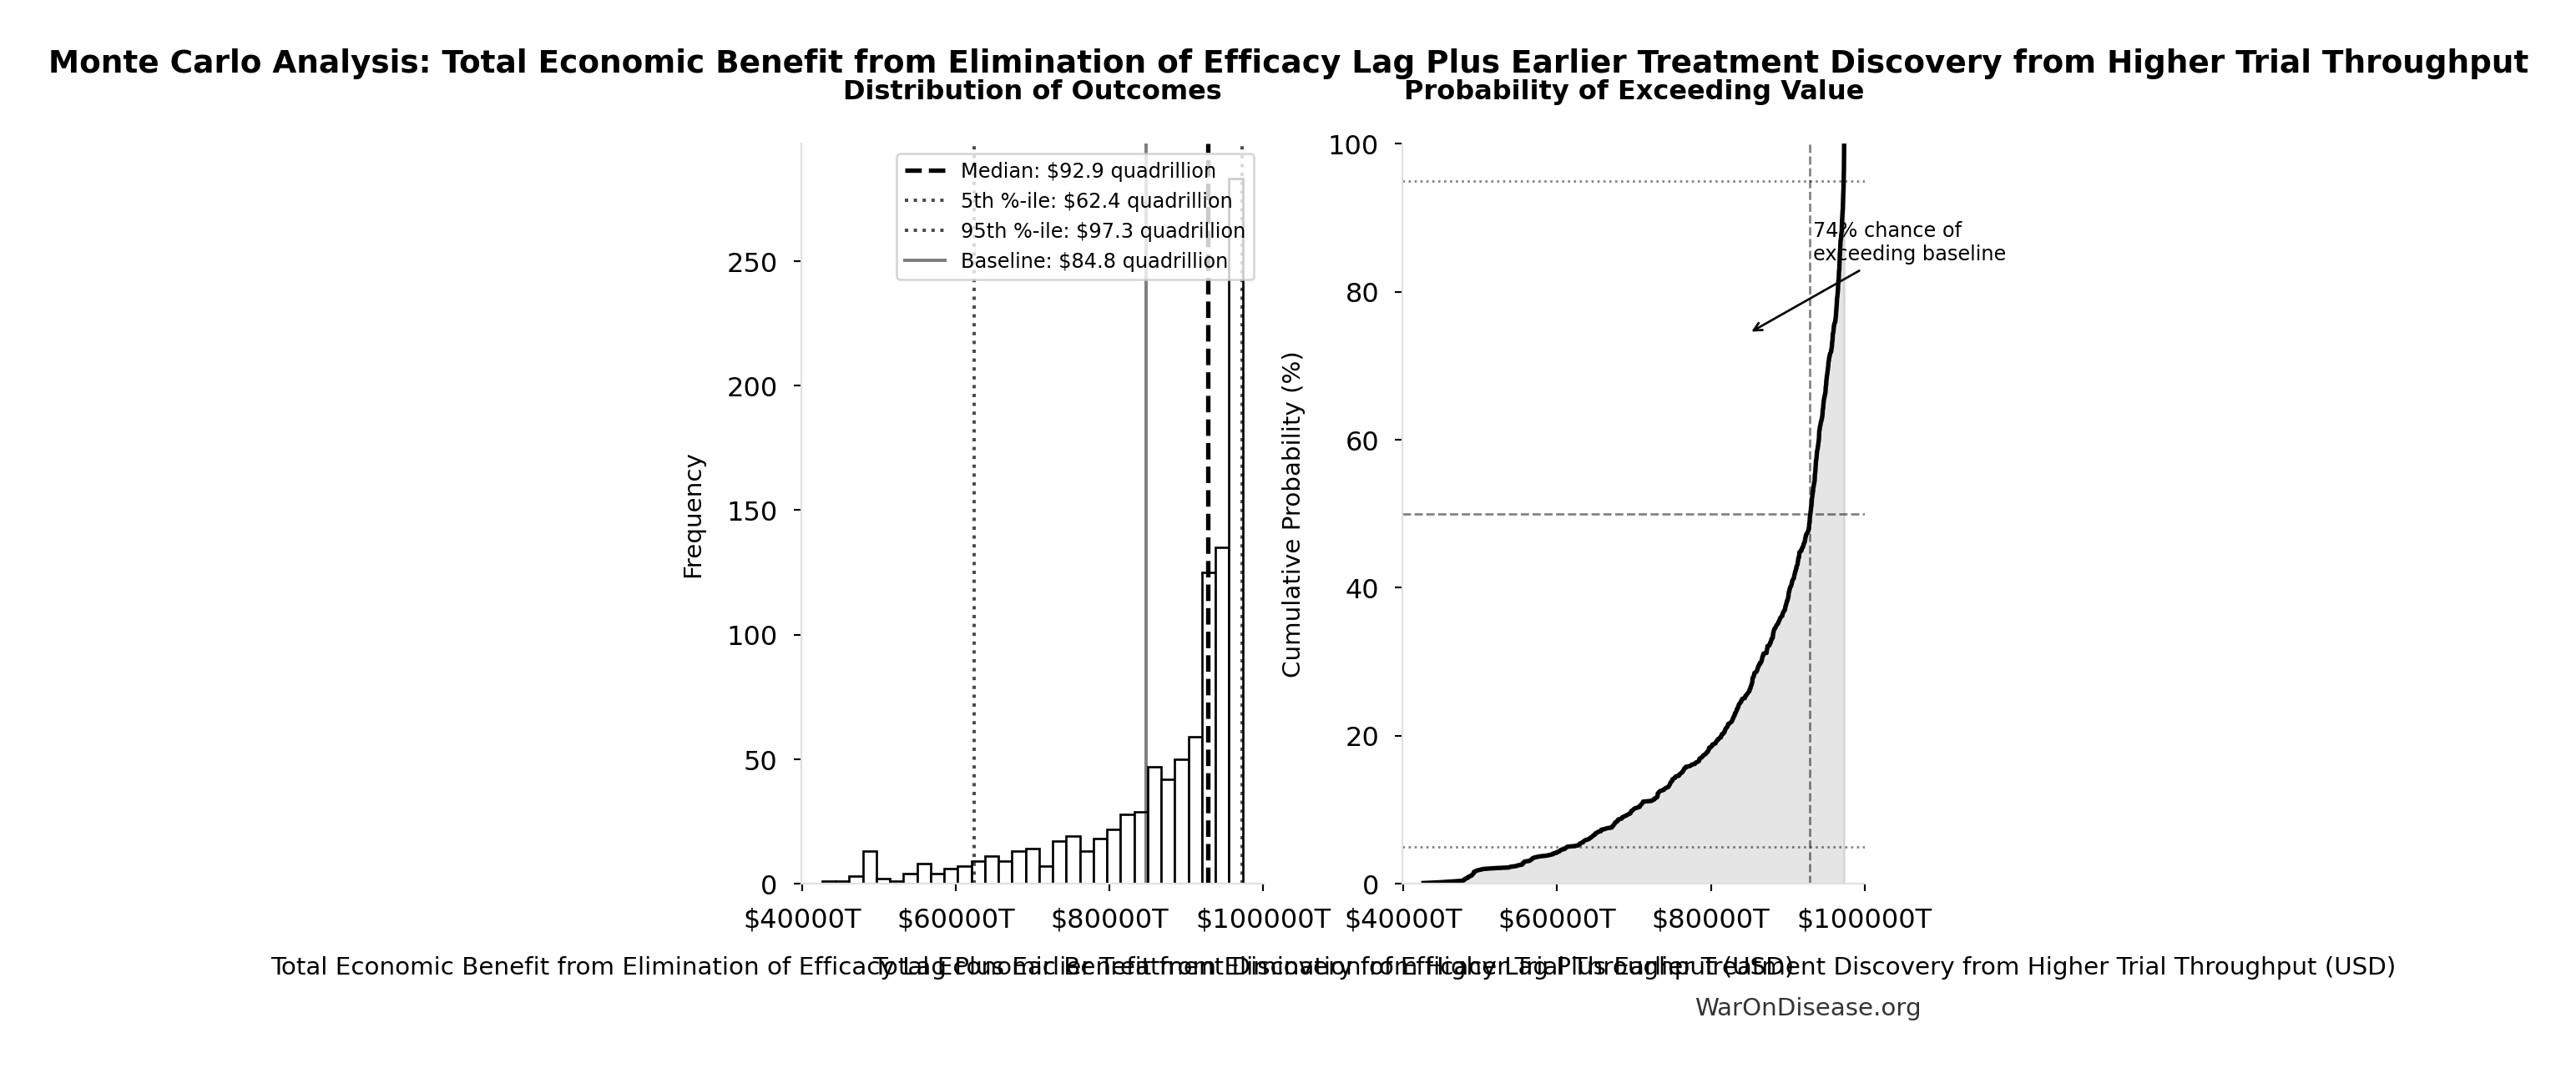
Simulation Results Summary: Total Economic Benefit from Elimination of Efficacy Lag Plus Earlier Treatment Discovery from Higher Trial Throughput
| Statistic | Value |
|---|---|
| Baseline (deterministic) | $84.8 quadrillion |
| Mean (expected value) | $95 quadrillion |
| Median (50th percentile) | $88 quadrillion |
| Standard Deviation | $40.2 quadrillion |
| 90% Range (5th-95th percentile) | [$42.9 quadrillion, $172 quadrillion] |
The histogram shows 1,000 of the 10,000 Monte Carlo draws for Total Economic Benefit from Elimination of Efficacy Lag Plus Earlier Treatment Discovery from Higher Trial Throughput; the summary statistics use all 10,000. The exceedance curve (right) shows the probability of the outcome exceeding any given value.
Cost-Utility Framework
We present a cost-utility analysis using the quality-adjusted life years (QALYs) and disability-adjusted life years (DALYs) metrics. This approach is the US and global standard for evaluating the value of health interventions141.
QALY: One year of life in perfect health. Gains are calculated as:
\[ \text{QALYs Gained} = (Q_1 \times T_1) - (Q_0 \times T_0) \]
Where \(Q_0\)/\(Q_1\) = quality of life (0-1) before/after, \(T_0\)/\(T_1\) = years of life before/after.
Cost-Effectiveness: The protocol achieves cost-effectiveness through dual pathways:
- R&D Savings: $40.5 billion (90% CI: $31.4 billion-$51.5 billion)+ annual savings from 97.7% (90% CI: 92%-100%) trial cost reduction
- Health Gains: 565 billion DALYs (90% CI: 309 billion DALYs-1.08 trillion DALYs) averted from the full timeline shift (~212 years (90% CI: 124 years-398 years) from 12.3x (90% CI: 4.92x-50.8x) trial capacity + efficacy lag elimination)
This combination creates a dominant intervention: simultaneously saves money and improves health outcomes.
US Willingness-to-Pay Threshold: Typically $100,000–$150,000 per QALY for interventions that add costs. Dominant interventions that both save money and improve health are favorable regardless of this threshold.
Sources for Context:
- QALY methodology and standards141: “The quality-adjusted life year (QALY) is the academic standard for measuring how well all different kinds of medical treatments lengthen and/or improve patients’ lives…”
- Health economic evaluation106: Standard health economic analysis considers cost-effectiveness across intervention types.
QALY Benefit Streams Breakdown
Three mechanisms contribute to the 212 years (90% CI: 124 years-398 years) timeline shift behind the 565 billion DALYs (90% CI: 309 billion DALYs-1.08 trillion DALYs) figure, with different evidence strength. The model does not apportion DALYs among them; the derivation above treats them together.
- A. Faster development of pipeline drugs. Higher trial capacity shortens development time for treatments already in the pipeline. Confidence: high; each month of delay in cancer treatment raises mortality risk by roughly 10%142,143.
- B. Better prevention from population-scale outcome data. Comprehensive outcome data identifies at-risk populations and measures real-world effectiveness. Confidence: medium; the value of prevention is established, the gain from more data is not.
- C. Trials for diseases no sponsor will fund. 7,000+ rare diseases, 95% without an approved treatment, become feasible to study at $929 (95% CI: $97-$3,000) per patient instead of $41,000 (95% CI: $20,000-$120,000). Confidence: lower; sound in theory, unproven at scale.
The R&D savings case (439 (90% CI: 321-600):1 ROI) stands on its own if all three health mechanisms are set to zero.
DALY Sensitivity Analysis
The following sensitivity analyses show how cost-effectiveness varies based on uncertainty in input parameters. These use Monte Carlo simulation with uncertainty propagation from parameter distributions.
Key DALY Outcomes:
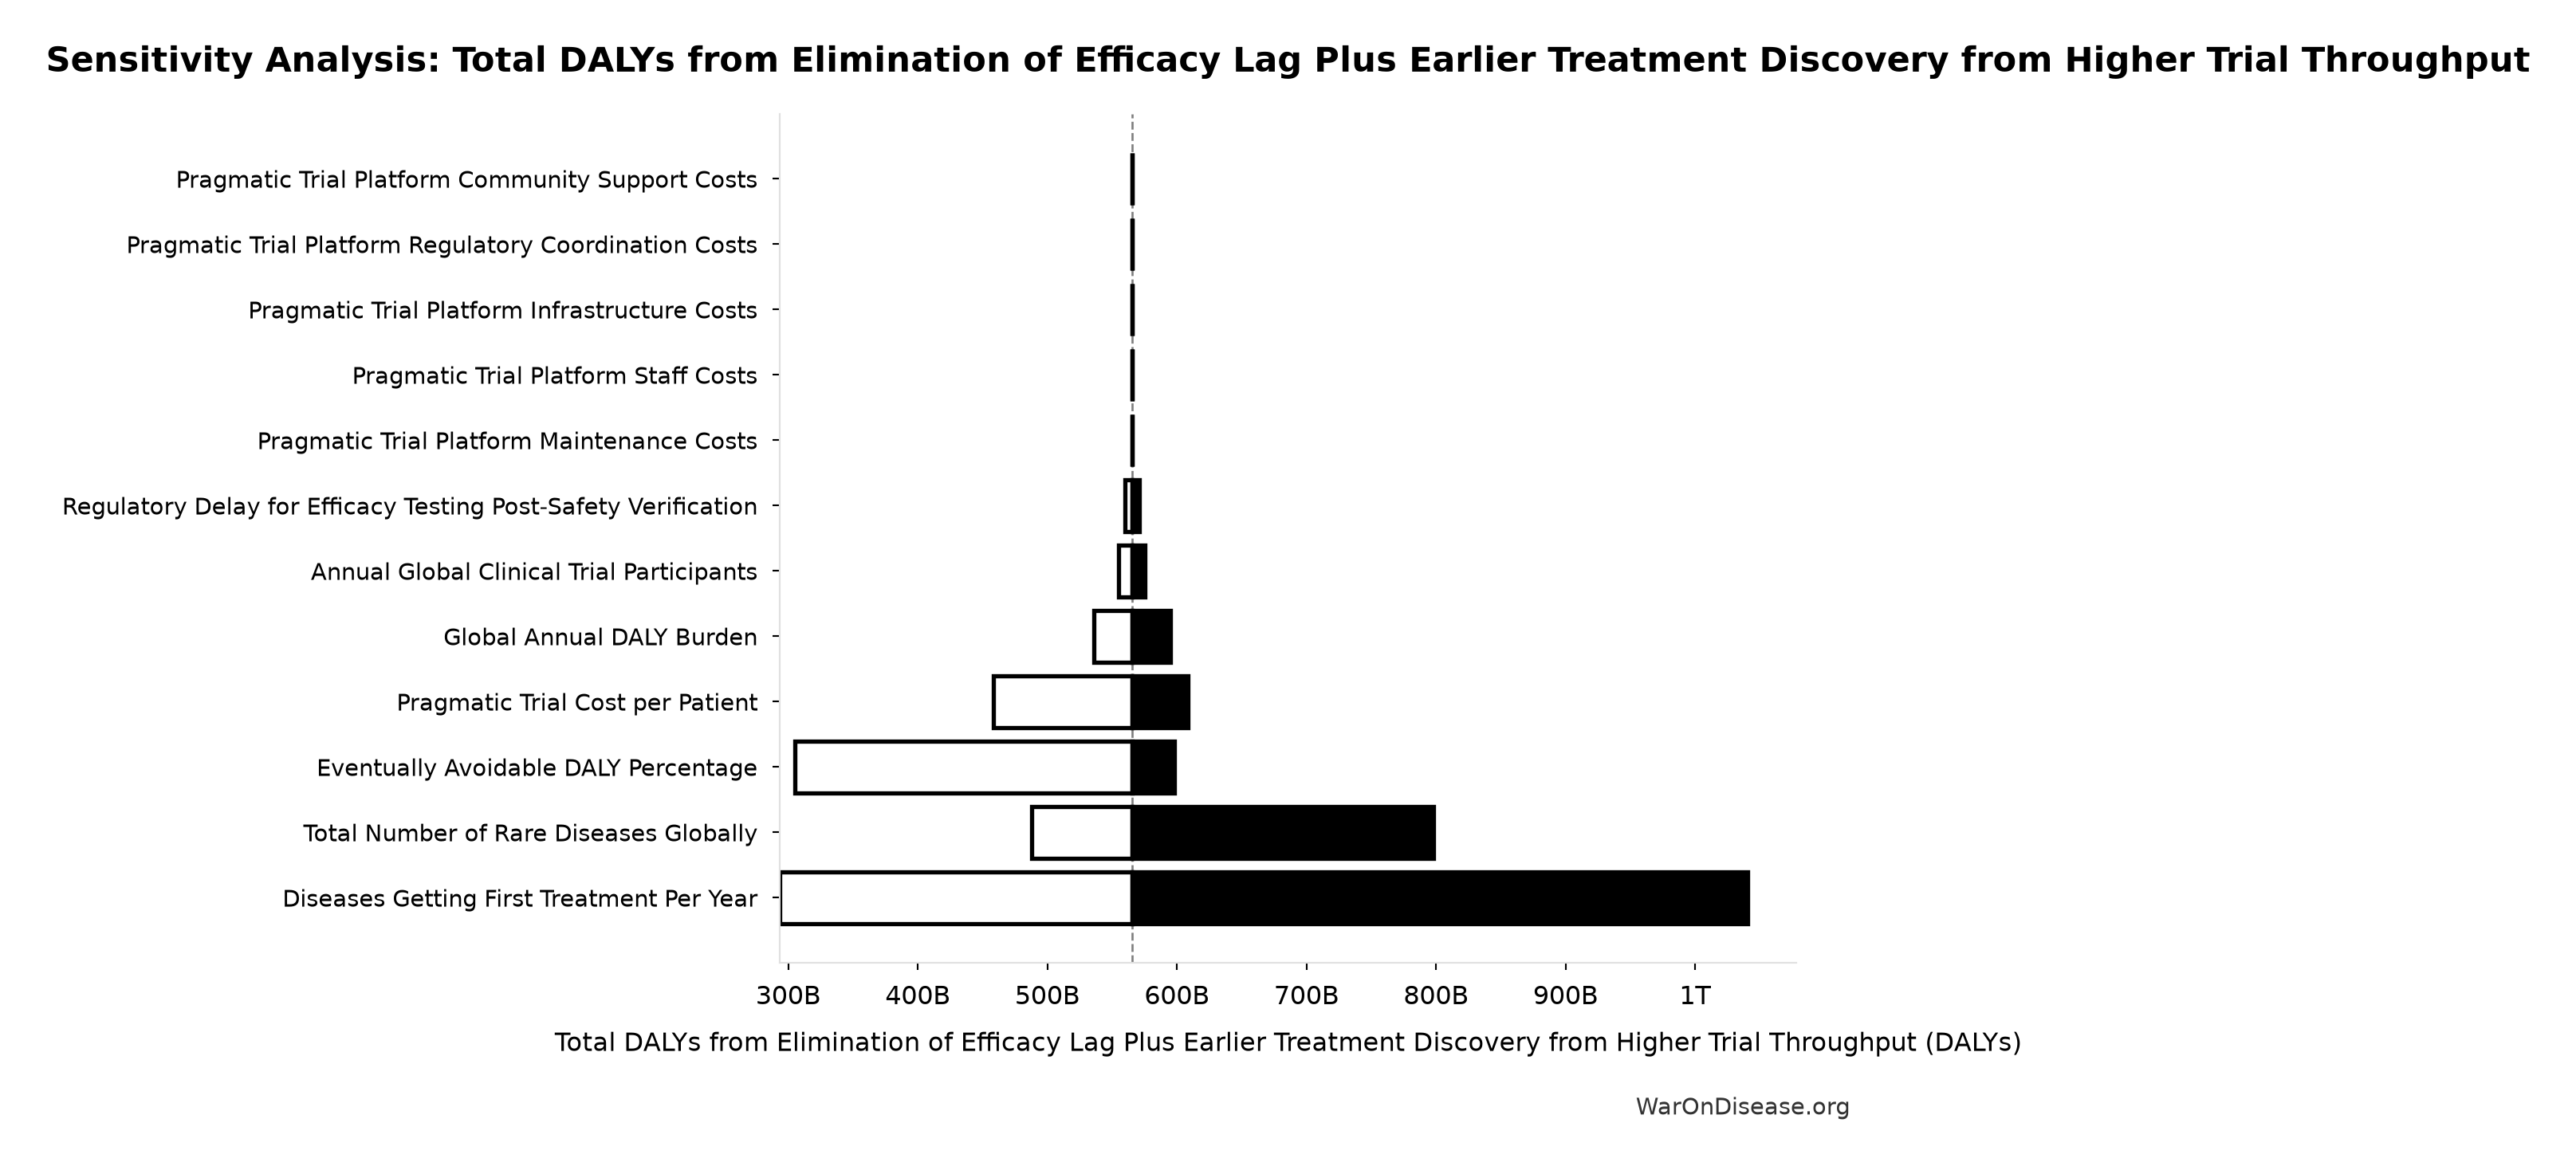
Sensitivity Indices for Total DALYs from Elimination of Efficacy Lag Plus Earlier Treatment Discovery from Higher Trial Throughput
Regression-based sensitivity showing which inputs explain the most variance in the output.
| Input Parameter | Sensitivity Coefficient | Interpretation |
|---|---|---|
| Average Total Treatment Timeline Shift (years) | 0.9320 | Strong driver |
| Eventually Avoidable DALY Percentage (percentage) | 0.3151 | Moderate driver |
| Global Annual DALY Burden (DALYs/year) | 0.1348 | Weak driver |
Interpretation: Standardized coefficients show the change in output (in SD units) per 1 SD change in input. Values near ±1 indicate strong influence; values exceeding ±1 may occur with correlated inputs.
Comparative Cost-Effectiveness vs Other Interventions
For context, the table compares the protocol’s cost-effectiveness against other well-understood public health programs, measured as Quality-Adjusted Life Years (QALYs) Gained per $1 Million of Spending. A higher number signifies greater cost-effectiveness. The comparison is not quite like for like: smallpox eradication and childhood vaccination each targeted one disease, while this funds the discovery process itself, the difference between fixing one pothole and repaving the road.
For standard interventions, this value is calculated as $1,000,000 / ICER, where the ICER (Incremental Cost-Effectiveness Ratio) is the cost to gain one QALY. For dominant interventions that are both more effective and less expensive, the ICER is negative, and this metric isn’t strictly applicable. For these cases, an illustrative range is used to represent their high value.
| Intervention | QALYs Gained per $1M Spending¹ | Typical ICER Range (Cost per QALY Gained) | Classification | Source / Evidence |
|---|---|---|---|---|
| This protocol | Dominant | Cost-Saving + Health Gain | Dominant | This analysis’s Sensitivity Analysis. Based on $18.9 million (95% CI: $11 million-$26.5 million)-$40 million (90% CI: $31.1 million-$49.6 million) annual costs generating 565 billion DALYs (90% CI: 309 billion DALYs-1.08 trillion DALYs) from ~212 years (90% CI: 124 years-398 years) timeline shift. |
| Smallpox Eradication | 100,000+³ | Dominant (Cost-Saving) | Dominant | The $300M program (1967-1980) prevents 5M annual deaths. Benefit-cost ratio exceeds 100:1. Standard ICER calculation is impractical due to its uncommon scale. (WHO, 2010144) |
| Childhood Vaccinations | 22+³ | Often Dominant to ~$100,000 | Dominant / Highly Cost-Effective | CDC estimates routine childhood vaccinations prevent 32M hospitalizations and 1.1M deaths among 1994-2023 US birth cohorts, with $2.9T in societal cost savings. (CDC, 2023145) |
| Clean Water Programs | 100 | ~$1,000 - $10,000 | Highly Cost-Effective | WHO estimates household water treatment costs $100-$500/DALY averted. Community water supply improvements cost $200/DALY. (WHO, 2004146) |
| Hypertension Screening | 30 - 50 | ~$20,000 - $33,000 | Highly Cost-Effective | Recent US studies show pharmacist-led hypertension management has ICERs in the $20,000-$33,000 range per QALY gained, falling within standard willingness-to-pay thresholds. (JAMA Netw Open, 2023147) |
| Generic Drug Substitution | +³ | Dominant (Cost-Saving) | Dominant | By definition cost-saving when therapeutic equivalence is maintained, with typical savings of 30-80% versus brand-name drugs. (WHO, 2015148) |
| Statins / Polypill | 67+³ | Cost-Saving to ~$15,000 | Dominant / Highly Cost-Effective | Cost-saving in high-risk populations. ICERs range from dominant to $15k/QALY in lower-risk groups. (eClinicalMedicine, 2022149) |
| Pragmatic Trials (RECOVERY model) | ~250,000 | $4 (90% CI: $1.91-$9.8)/QALY | Highly Cost-Effective | UK RECOVERY trial: $20 million (95% CI: $15 million-$25 million) spent, saving 1 million lives (95% CI: 500 thousand lives-2 million lives) globally via dexamethasone discovery. 44.1x (90% CI: 12.8x-210x) cheaper per patient than traditional Phase 3 trials. (Note: RECOVERY’s $500 (95% CI: $400-$2,500)/patient benefited from NHS infrastructure; ADAPTABLE achieved $929 (95% CI: $929-$1,400)/patient in US settings.) |
| NIH Standard Research Portfolio | ~20 | $50,000 (95% CI: $20,000-$100,000)/QALY | Inefficient Baseline | Standard NIH-funded research. Represents current status quo efficiency.84 |
Methodology Notes
- For the protocol:
(Annual QALYs Gained) / (Annual Cost in Millions) - Ranges reflect conservative to optimistic scenarios accounting for parameter uncertainties
- For cost-saving (dominant) interventions, standard QALY/$1M calculations are not applicable
- Values shown are illustrative to demonstrate relative cost-effectiveness
- Upper bounds represent the exceptional value of these interventions
Data Limitations
- Historical interventions (e.g., smallpox) use retrospective analyses
- Direct comparisons between interventions should consider contextual differences
- All costs are in 2023 USD, adjusted using appropriate health inflation indices
- QALY calculations use standard health state utility weights where available
Comparison to Other Major Public Investments
To provide context for the estimated costs of a global pragmatic trial system, it is useful to compare them to other significant U.S. government investments in health and technology. The projected ‘Lean Ecosystem’ cost for the protocol of approximately $40 million (90% CI: $31.1 million-$49.6 million) per year (core protocol operations plus the medium-case broader initiative) is modest in comparison to other major federal projects.
| Initiative / Project | Approximate Cost / Budget (Annualized) | Comparison to Protocol’s Annual Cost | Source / Note |
|---|---|---|---|
| This protocol (Lean Ecosystem) | ~$40 million (90% CI: $31.1 million-$49.6 million) / year | 1x (Baseline) | This analysis |
| Cancer Moonshot Initiative | ~$257 Million / year150 ($1.8B over 7 years) | ~6.4x | 21st Century Cures Act151 |
| NIH “All of Us” Research Program | ~$500M / year (FY23 Approx. Budget) | ~12.5x | NIH Budget59 |
| HealthCare.gov (Initial Build) | ~$1.7 - $2.1 Billion152 (Total Upfront Cost) | ~42x - 52x (of one year’s cost) | GAO Reports / Public Reporting152 |
| National Cancer Institute (NCI) | ~$7.2 Billion / year153 (FY25 Budget) | ~180x | NCI Budget Data153 |