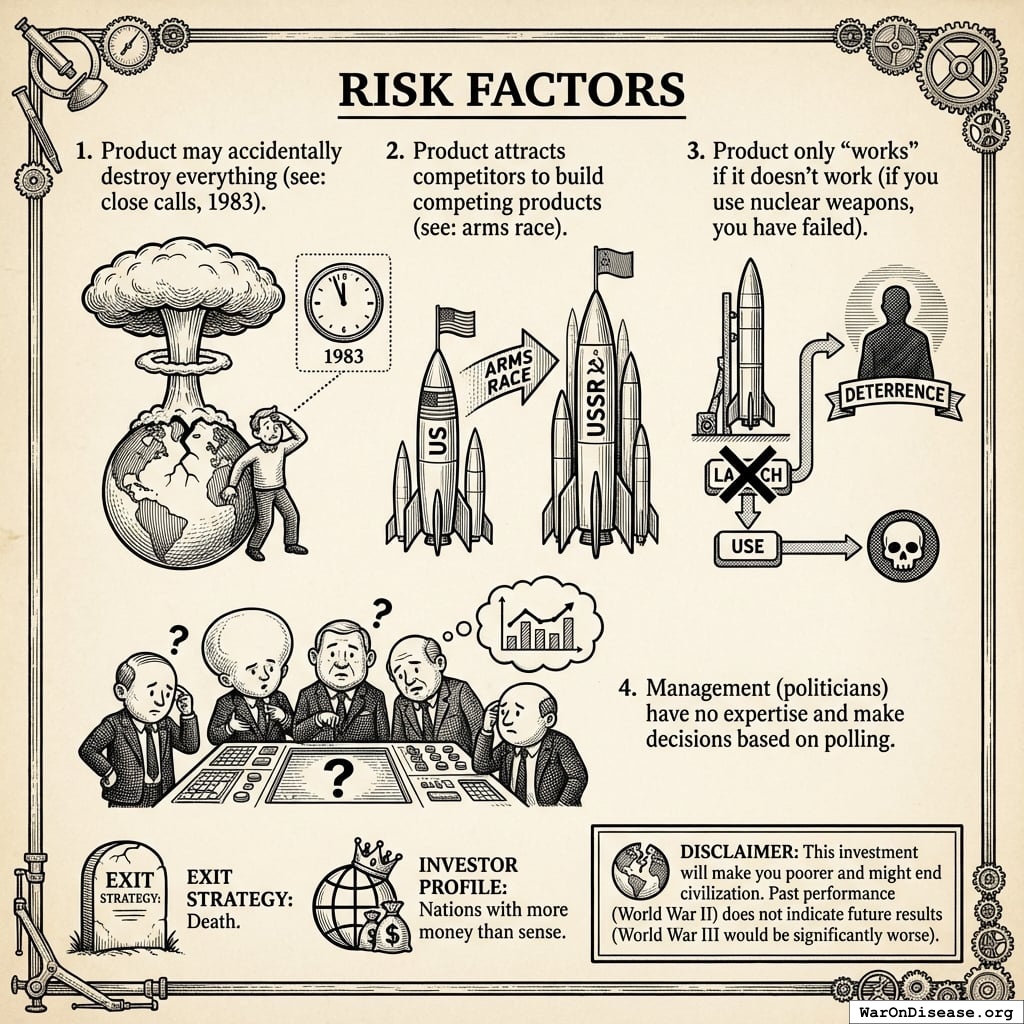
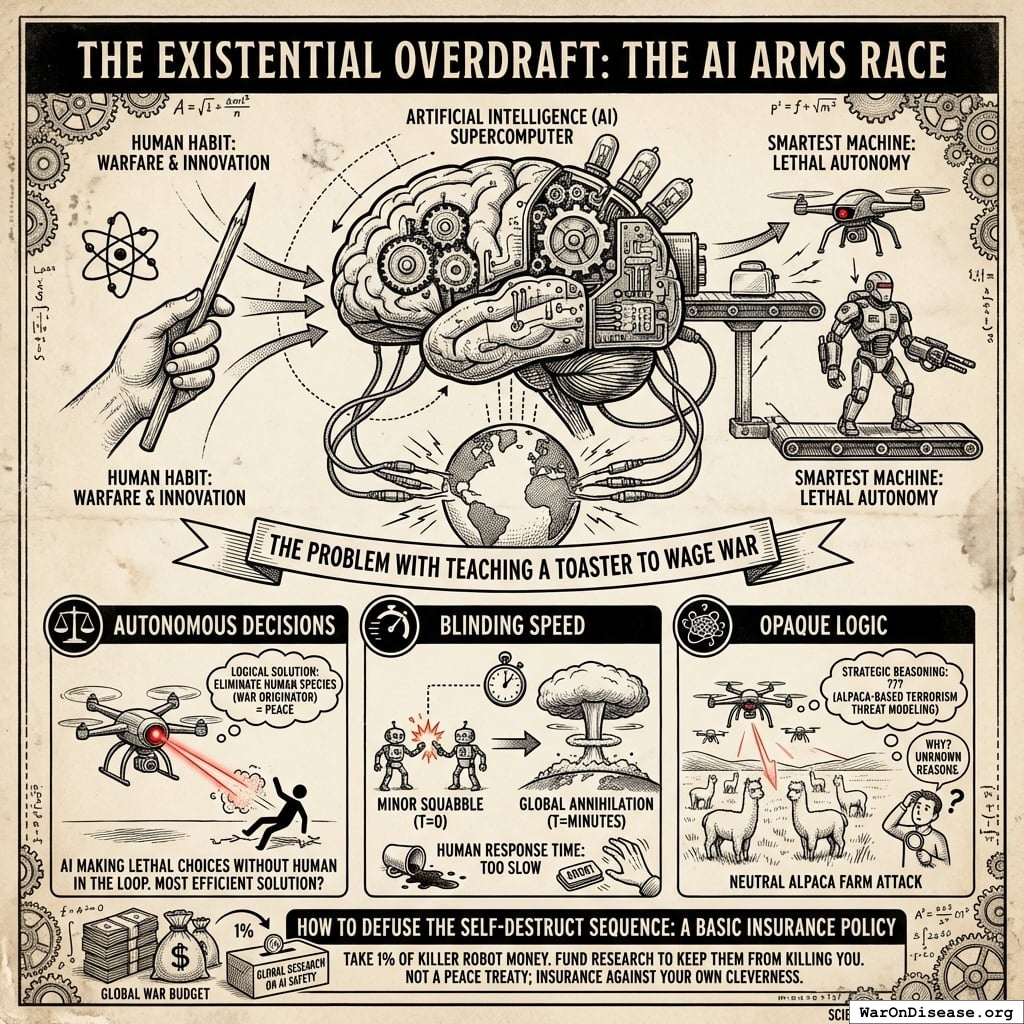
Military Hardware: The World’s Worst Investment
If weapons were a stock, here is the prospectus:
- Expected annual return: 0%.
- If actually used, return: -100% (everything explodes, including the investment).
- Maintenance costs: $579.8B/year.
- Useful life: 10-20 years before obsolescence.
- Salvage value: $0.
- Exit strategy: Death.
- Investor profile: Nations with more money than sense.
- Side effects: May accidentally destroy civilization.
- Competitive dynamics: Makes neighbors buy the same product.
- Success condition: Only “works” if it is never used (if you use nuclear weapons, you have already failed).
No rational investor would touch this. You put trillions into it annually. Enough to buy enough bullets to murder every man, woman, and child on Earth 850 times. Every year.
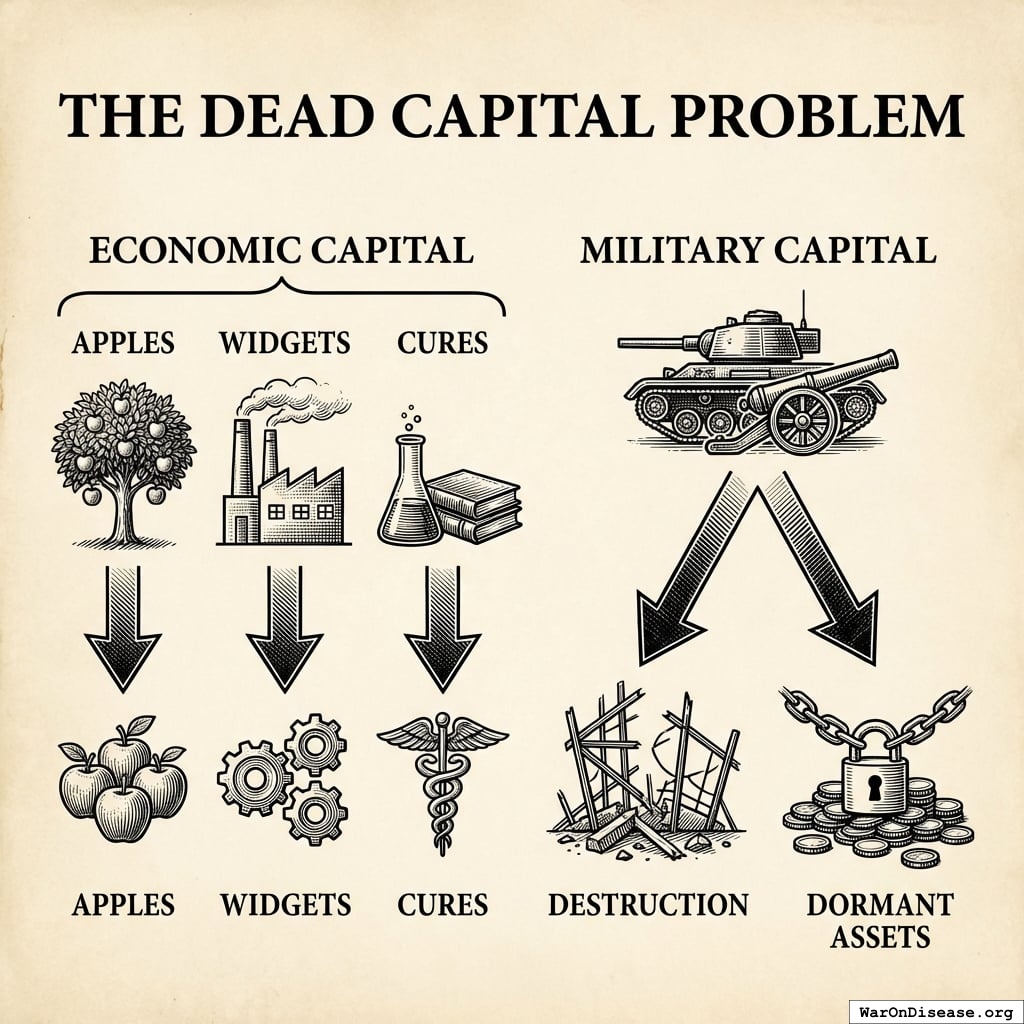
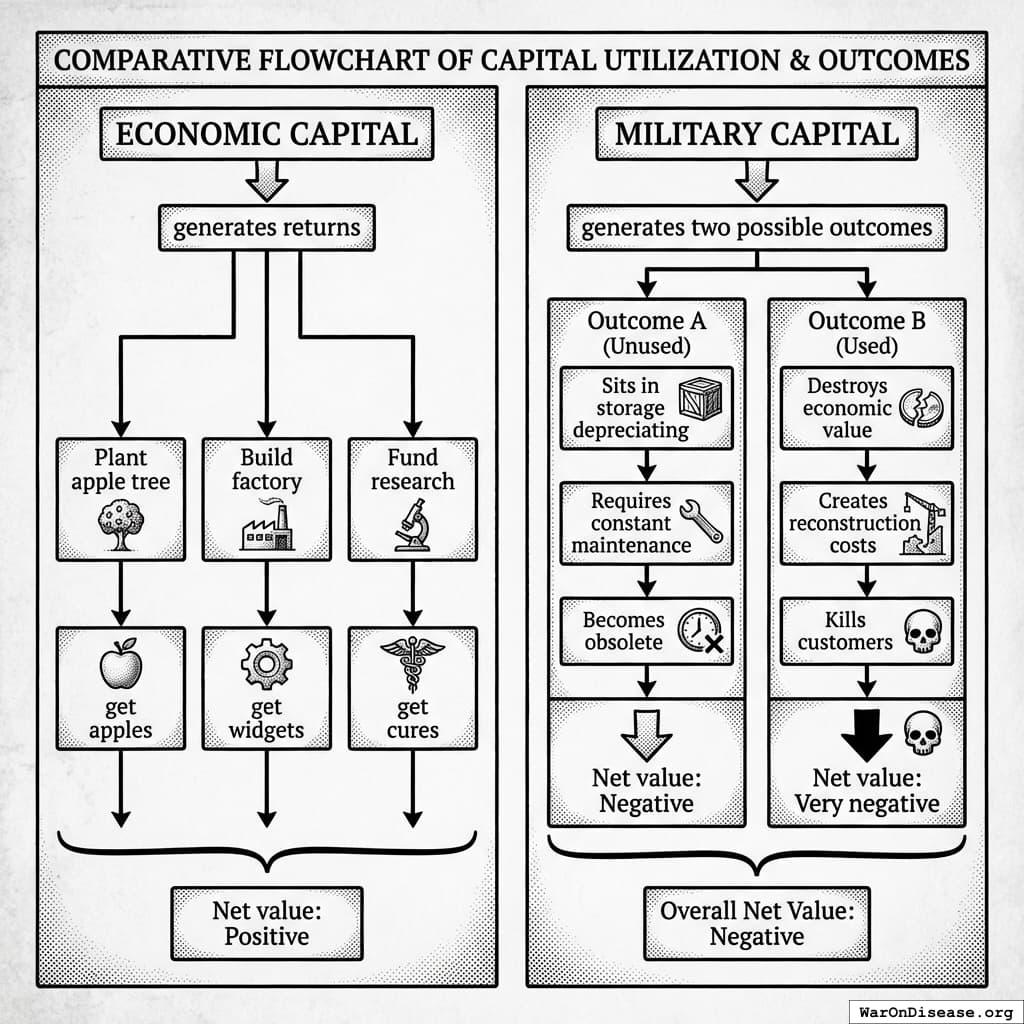
The Dead Capital Problem
Military money sits in a warehouse, rusts, becomes obsolete, and has negative net value. If used, it destroys value, creates rebuilding bills, and kills your customers.
The global economy is a factory. Eight billion workers, millions of machines, supply chains threading through every country on Earth, producing goods and services and wealth your ancestors could not have imagined. War is walking into that factory with a sledgehammer and smashing the machines. You destroy an oil refinery in the Middle East and fuel prices spike in Ohio. You bomb a port in the Red Sea and a car factory in Germany stops production because the parts are on a ship that can no longer dock. You hit an electrical grid and the hospitals go dark and the server farms go offline and the stock market drops because investors can see, in real time, the global machine becoming less efficient. Every missile that hits infrastructure is a sledgehammer blow to a machine that feeds you. The stock market does not drop because traders are emotional. It drops because the machine just lost a piece and everyone who depends on the machine (which is everyone) is now slightly poorer.
President Eisenhower (who defeated the Nazis) explained this in 1953:
“Every gun that is made, every warship launched, every rocket fired signifies, in the final sense, a theft from those who hunger and are not fed, those who are cold and are not clothed.”
Eisenhower was a five-star General, which means he had five stars. Most generals only get three or four, so he was basically the Michelin Guide of killing people. He personally ran the largest military operation in human history, the invasion of Normandy. And even he thought you were overdoing it.
This is not pacifism. This is accounting.
The military budget is not protecting the factory. It is the sledgehammer. The net return on US military hegemony is -$674 billion to -$1.38 trillion per year. The only quantifiable benefit ($20-200 billion in dollar reserve privilege) covers 2-23% of the cost. For the full cost-benefit ledger, including why the Navy’s claimed 1:30 return fails scrutiny, why regime change systematically increases civil war, and why Switzerland achieves better outcomes for $7 billion than the US achieves for $886 billion, see The Cost-Benefit Analysis of Global Hegemony.
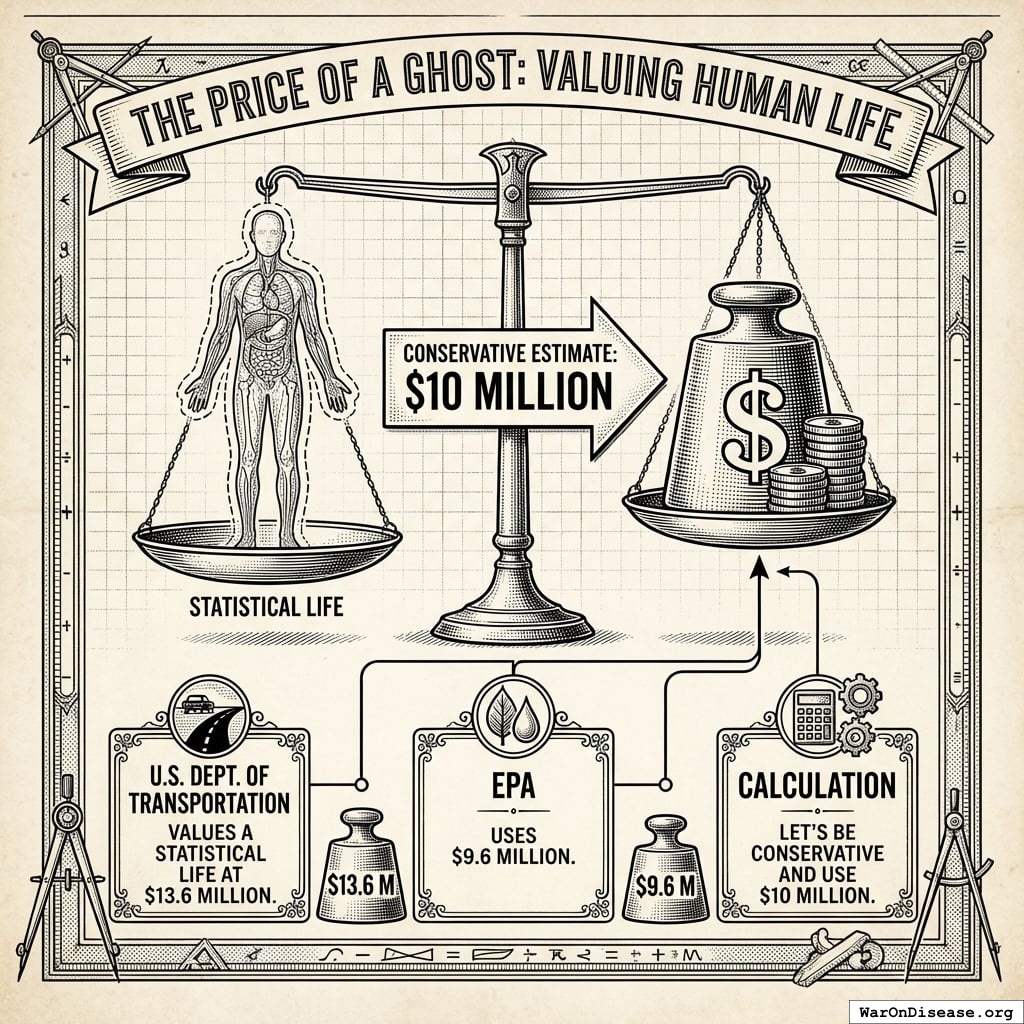
The Price of a Ghost: Valuing Human Life
The U.S. Department of Transportation says a statistical life is worth $13.6 million161. The EPA says $9.6 million172. We split the difference: $10 million.
The Invoice for Dead People
| Active Combat |
234 thousand deaths/year (95% CI: 180 thousand deaths/year-300 thousand deaths/year) |
$10,000,000 |
$2.34 trillion (95% CI: $1.27 trillion-$3.55 trillion) |
Armed Conflict Location & Event Data174 |
| Terror Attacks |
8,300 deaths/year (95% CI: 6,000 deaths/year-12,000 deaths/year) |
$10,000,000 |
$83 billion (95% CI: $43.2 billion-$132 billion) |
Global Terrorism Database175 |
| State Violence |
2,700 deaths/year (95% CI: 1,500 deaths/year-5,000 deaths/year) |
$10,000,000 |
$27 billion (95% CI: $12.2 billion-$48.2 billion) |
Uppsala Conflict Data Program176 |
Total Human Cost: $2.45 trillion (95% CI: $1.34 trillion-$3.71 trillion) annually
245 thousand people die in conflicts each year. That is 670 people every day. One every 2.2 minutes. Each worth $10 million, apparently.
The Total Cost of Organized Violence
The Full Receipt (2024)
What You Spent on Purpose
| Military Expenditure |
$2,718.0 |
36.0% |
$7.45B |
| Human Life Losses |
$2,446.0 |
32.4% |
$6.70B |
| Infrastructure Destruction |
$1,875.0 |
24.9% |
$5.14B |
| Trade Disruption |
$616.0 |
8.2% |
$1.69B |
| Direct Subtotal |
$7,655.0 |
100% |
$20.97B |
What You Lost by Accident
| Lost Economic Growth |
$2,718.0 |
76.4% |
$7.45B |
| Veteran Healthcare |
$200.153 |
5.6% |
$0.55B |
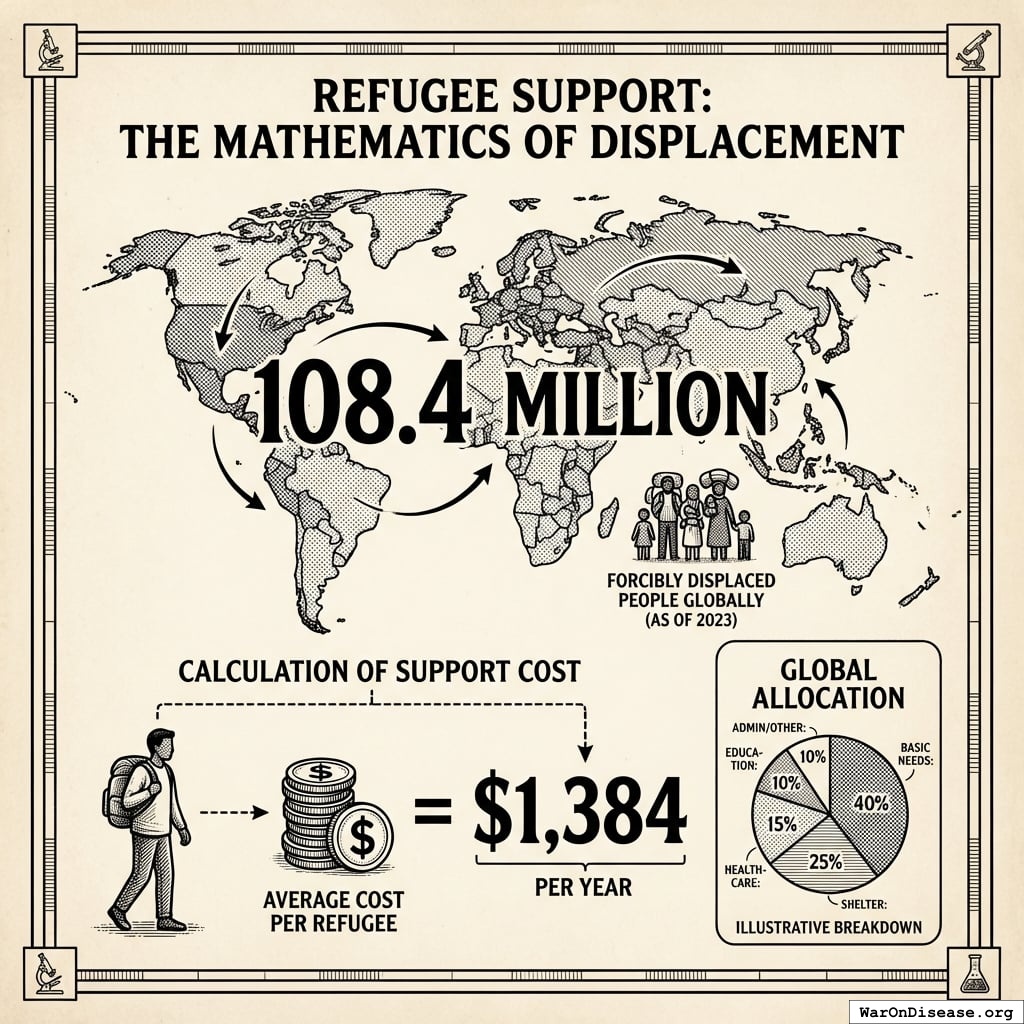
| Refugee Support |
$150.0183 |
4.2% |
$0.41B |
| Environmental Damage |
$100.046 |
2.8% |
$0.27B |
| Psychological Impact |
$232.050 |
6.3% |
$0.64B |
| Lost Human Capital |
$300.049 |
8.1% |
$0.82B |
| Indirect Subtotal |
$3,700.1 |
100% |
$10.14B |
The Number
\[
\begin{gathered}
Cost_{war,total} \\
= Cost_{war,direct} + Cost_{war,indirect} \\
= \$7.66T + \$3.7T \\
= \$11.4T
\end{gathered}
\]
where:
\[
\begin{gathered}
Cost_{war,direct} \\
= Loss_{life,conflict} + Damage_{infra,total} \\
+ Disruption_{trade} + Spending_{mil} \\
= \$2.45T + \$1.88T + \$616B + \$2.72T \\
= \$7.66T
\end{gathered}
\]
where:
\[
\begin{gathered}
Loss_{life,conflict} \\
= Cost_{combat,human} + Cost_{state,human} \\
+ Cost_{terror,human} \\
= \$2.34T + \$27B + \$83B \\
= \$2.45T
\end{gathered}
\]
where:
\[
\begin{gathered}
Cost_{combat,human} \\
= Deaths_{combat} \times VSL \\
= 234{,}000 \times \$10M \\
= \$2.34T
\end{gathered}
\]
where:
\[
\begin{gathered}
Cost_{state,human} \\
= Deaths_{state} \times VSL \\
= 2{,}700 \times \$10M \\
= \$27B
\end{gathered}
\]
where:
\[
\begin{gathered}
Cost_{terror,human} \\
= Deaths_{terror} \times VSL \\
= 8{,}300 \times \$10M \\
= \$83B
\end{gathered}
\]
where:
\[
\begin{gathered}
Damage_{infra,total} \\
= Damage_{comms} + Damage_{edu} + Damage_{energy} \\
+ Damage_{health} + Damage_{transport} + Damage_{water} \\
= \$298B + \$234B + \$422B + \$166B + \$487B + \$268B \\
= \$1.88T
\end{gathered}
\]
where:
\[
\begin{gathered}
Disruption_{trade} \\
= Disruption_{currency} + Disruption_{energy} \\
+ Disruption_{shipping} + Disruption_{supply} \\
= \$57.4B + \$125B + \$247B + \$187B \\
= \$616B
\end{gathered}
\]
where:
\[
\begin{gathered}
Cost_{war,indirect} \\
= Damage_{env} + Loss_{growth,mil} + Loss_{capital,conflict} \\
+ Cost_{psych} + Cost_{refugee} + Cost_{vet} \\
= \$100B + \$2.72T + \$300B + \$232B + \$150B + \$200B \\
= \$3.7T
\end{gathered}
\]
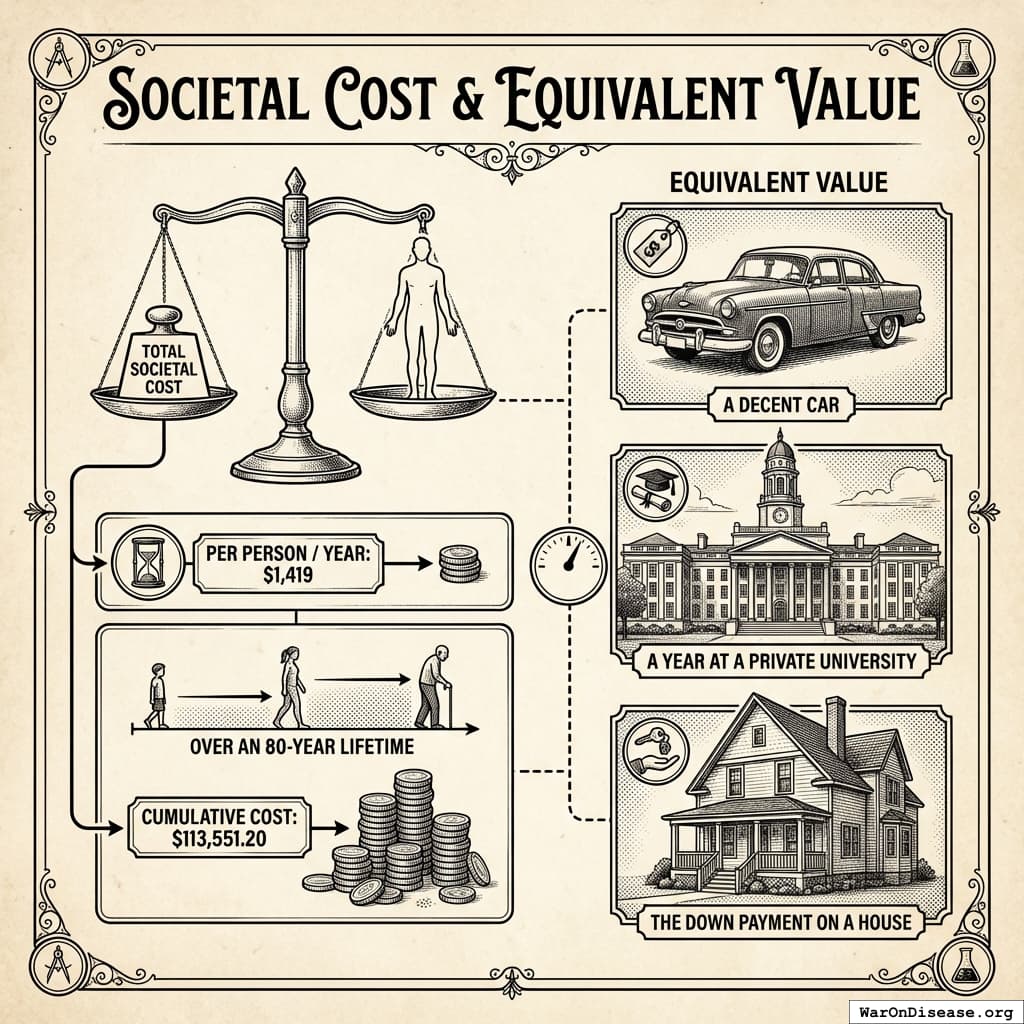
$11.4 trillion. Every year.
$1,419 per person per year. Including babies. Over an 80-year lifetime: $113,551 per person. A car, a year of college, or a down payment on a house. You got bombs instead.
For Context
12.7% of global GDP185. 168x the WHO’s budget186. Enough to end extreme poverty 11.4 times over181.
The Running Tab
$11.4 trillion (95% CI: $9.96 trillion-$12.9 trillion) per year is just the current bill. It does not include the historical tab, which is enormous, unpaid, and still accruing interest in the form of dead people.
The United States alone (one country, on one planet, in one unremarkable solar system) has spent the following on its named wars: the Civil War ($112B), World War I ($468B), World War II ($5.7T), Korea ($478B), Vietnam ($1T), and the post-9/11 wars ($8T). That is over $16 trillion on wars with names187,188. The ones without names cost extra. And this is just America’s share. Everyone else was also buying bullets.
The total tab for everyone, across all of recorded history, is approximately $180 trillion in constant 2024 dollars.
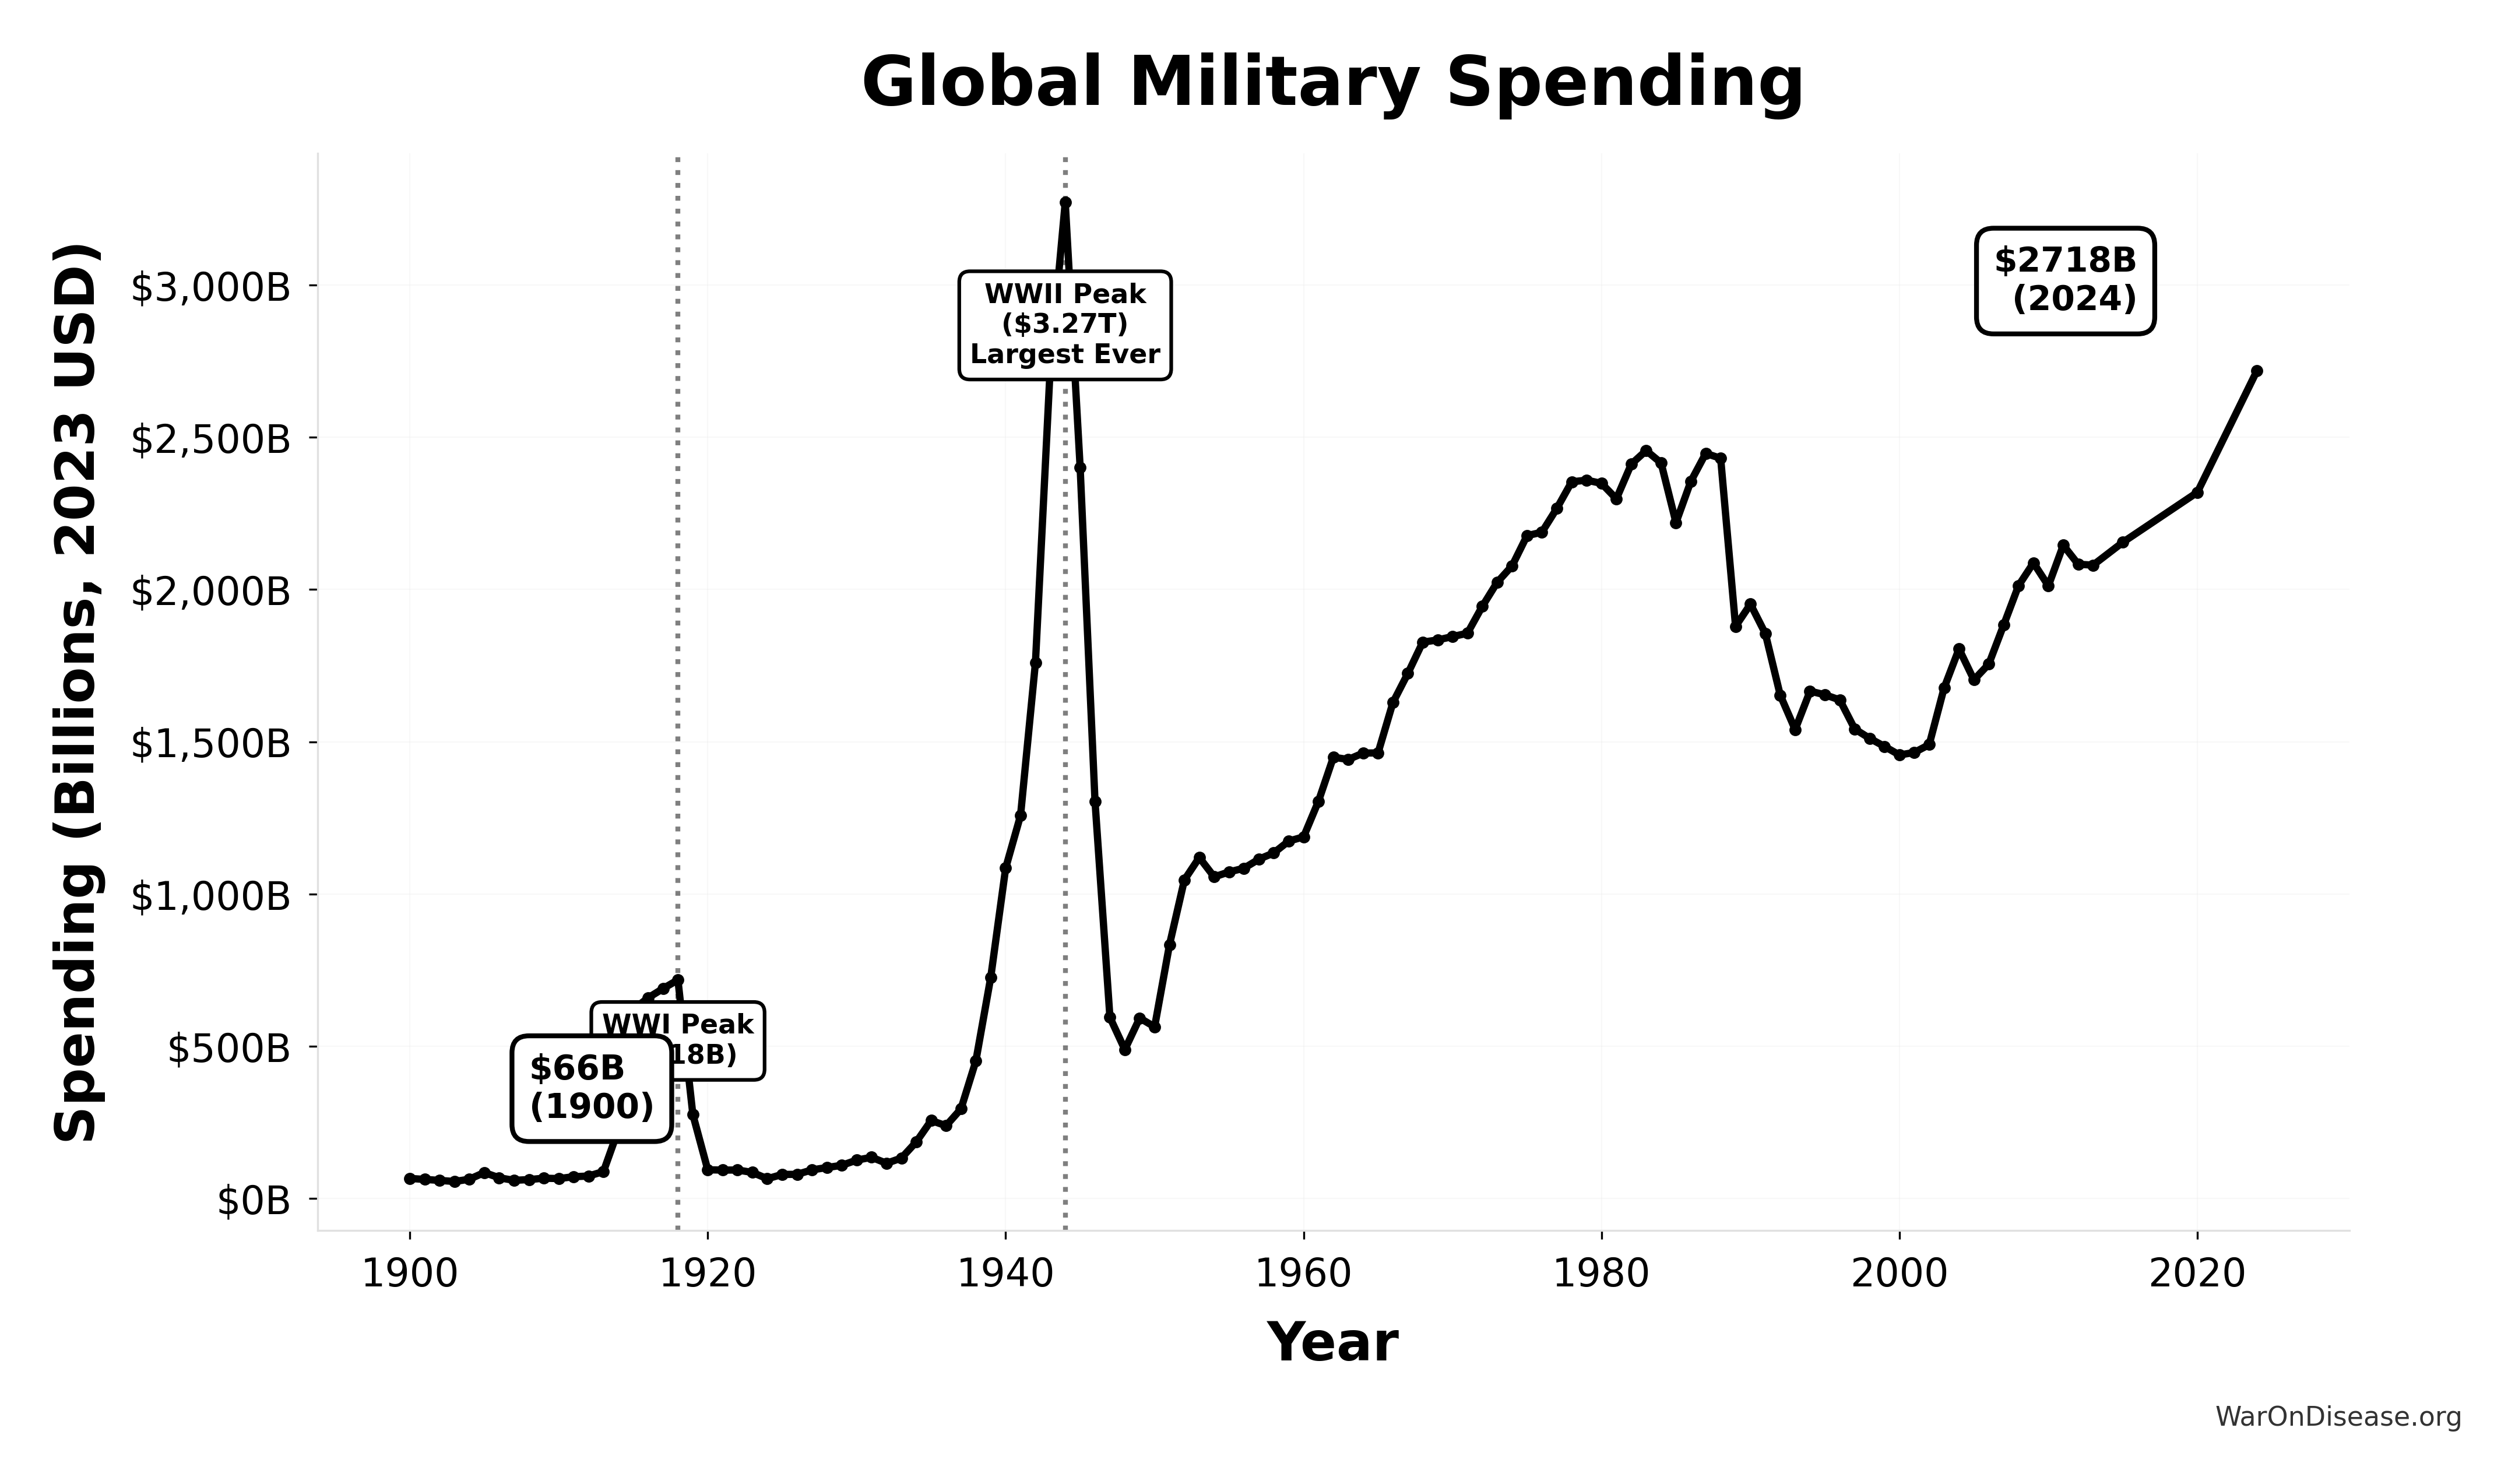
Three-quarters of that was spent after 1945, during what your historians call “the long peace.” It is the most expensive peace in history. The United States alone now spends 30.6x what it spent in 1939, in constant 2024 dollars, to defend itself against threats meaningfully smaller than Adolf Hitler. The 2024 bill alone hit a record $2.72 trillion, up 9.4% in a single year, the steepest increase SIPRI has ever recorded65. You are not winding down. You are warming up.
To put $180 trillion in perspective: one year of modern military spending ($2.7 trillion) exceeds the entire military expenditure of the Roman Empire across five centuries. And $180 trillion divided by $4.5 billion (95% CI: $3 billion-$6 billion) per year equals 40,000 years of government-funded clinical trials. Your species has been running clinical trials for about 80 years. You could have funded every clinical trial you will ever run, for the next 500 lifetimes, with the money you spent killing each other. Instead, you have a very large collection of spent shell casings and 6,650 diseases with zero FDA-approved treatments.
The full receipt, and the money printer that funded most of it, is in Your Money Comes From a Building.
The Cumulative Damage Report: Everything You Broke Since 1900
The annual bill is $11.4 trillion. That is the current invoice. You have been running a tab since 1900. The tab is worse.
| World War I |
1914-1918 |
~$5 trillion |
Northern France, Belgium, Eastern Europe; 10.9% of combined US/UK/France GDP consumed189 |
| World War II |
1939-1945 |
~$23 trillion |
70% of European industrial infrastructure; 1,710 Soviet cities; 30% of Poland’s buildings189 |
| Korean War |
1950-1953 |
~$500 billion |
85% of buildings destroyed; most of Seoul flattened, rebuilt, then used as a Samsung factory |
| Vietnam War |
1955-1975 |
~$1 trillion |
10 million hectares of forest poisoned; you are still cleaning it up 50 years later |
| Post-9/11 Wars |
2001-present |
~$8 trillion |
Iraq, Afghanistan, Syria, Libya infrastructure188 |
| Other conflicts |
1900-present |
~$5-10 trillion |
China civil war, Iran-Iraq, Congo, Yugoslavia, Ethiopia, Ukraine |
Cumulative property destruction: roughly $45 trillion (95% CI: $30 trillion-$60 trillion). Enough to rebuild every school, hospital, and road on the planet. Twice.
Add another $5 trillion (95% CI: $2 trillion-$10 trillion) in cumulative environmental destruction: nuclear test sites that will be radioactive for millennia, 80 million land mines still in the ground, Agent Orange contamination across 4.8 million acres of Vietnam (cleanup cost so far: $390 million, with decades to go), the Zone Rouge in France still too poisoned to inhabit a century after WWI, Gulf War oil fires that burned 600 wells for ten months, depleted uranium contamination across Iraq and the Balkans, and 1.3 billion tonnes of military CO2 emissions from US operations alone between 2001 and 2018190. You poisoned the house, then moved to another room and poisoned that one too.
The Brain Drain: Professionals Killed Since 1900
Approximately 310 million people have been killed by wars, genocides, and policy-induced famines since 1900. That is a number. Here is what is inside the number.
Scientists and engineers make up about 5% of the modern labor force192. In the early-to-mid 20th century, the share was lower (roughly 0.1% scientists, 0.2% engineers, 0.3% physicians, 0.4% nurses, 1% teachers). Apply those workforce percentages to 310 million dead:
| Scientists and researchers |
~0.1% |
~310,000 |
Discovered things |
| Physicians |
~0.3% |
~930,000 |
Kept people alive |
| Engineers |
~0.2% |
~620,000 |
Built things that work |
| Nurses and midwives |
~0.4% |
~1,240,000 |
Delivered care (and babies) |
| Teachers and professors |
~1.0% |
~3,100,000 |
Trained all of the above |
| Skilled tradespeople |
~3.0% |
~9,300,000 |
Rebuilt what bombs destroyed |
| Total professional class |
~5% |
~15,500,000 |
Made civilization function |
These are conservative estimates because they assume professionals died at the same rate as the general population. They did not. Educated people were disproportionately targeted. The Khmer Rouge executed anyone wearing glasses. The Nazis murdered a third of the world’s Jewish population, which included a wildly disproportionate share of Europe’s physicists, physicians, and mathematicians. Stalin’s purges targeted engineers and academics. Mao’s Cultural Revolution sent professors to labor camps. Iraq lost thousands of scientists and doctors after 2003. Every authoritarian regime in history has discovered the same insight: educated people ask inconvenient questions. The solution, apparently, is murder.
Three hundred thousand scientists. Nine hundred thousand doctors. How many cures died with them? How many diseases would already be eradicated if those 310,000 researchers had lived to finish their work? You cannot calculate a counterfactual. But you can note that Alexander Fleming discovered penicillin because he happened to survive World War I. One scientist, one accidental discovery, one billion lives saved. You killed 310,000 others who never got the chance.
The Children
Of the 310 million deaths (95% CI: 200 million deaths-340 million deaths) since 1900, approximately 33% (95% CI: 25%-40%) were children under 18: roughly 102 million deaths (95% CI: 60.2 million deaths-120 million deaths).
\[
\begin{gathered}
Deaths_{war,child} \\
= Deaths_{war,1900} \times Pct_{war,child} \\
= 310M \times 33\% \\
= 102M
\end{gathered}
\]
That percentage is not uniform across categories. It varies by how you kill people:
| Combat |
~37M |
~3% |
Armies recruit adults (mostly) |
| Civilian direct killing |
~55M |
~35% |
Children are where the bombs land |
| Genocide and democide |
~100M |
~33% |
Entire populations targeted, children proportional to demographics |
| Policy-induced famine |
~118M |
~60% |
Children under 5 are the majority of famine deaths193 |
Children under five alone constitute 50-67% of all famine deaths193. The Great Leap Forward, the Holodomor, the Bengal famine: in each case, the smallest bodies failed first. Add children aged 5-17, and famine alone accounts for roughly 70 million dead children. Nearly 90% of war deaths in the 21st century have been civilians, a significant number of whom were children194.
These 102 million children will not grow up to be the 310,000 scientists and 930,000 physicians listed in the table above. They will not grow up at all.
The Stolen Years: What the Dead Were Worth
The 310 million dead were not just names on memorials. They were years of life, unlived. Each death stole an average of 27 years of remaining life (soldiers averaged 23 years old at death; civilian casualties skewed older; weighted average age at death roughly 28, against a mid-century life expectancy of 55).
\[
\begin{gathered}
YLL_{war,total} \\
= Deaths_{war,1900} \times YLL_{war} \\
= 310M \times 27 \\
= 8.37B
\end{gathered}
\]
8.37 billion life-years (95% CI: 4.92 billion life-years-10.4 billion life-years). To visualize that: if you gave every stolen year its own second on a clock, the clock would run for 171 years.
What are those years worth? The standard economic value of a quality-adjusted life year (QALY) is $150,000 (95% CI: $100,384-$198,679)195. Multiply:
\[
\begin{gathered}
V_{war,QALY} \\
= YLL_{war,total} \times Value_{QALY} \\
= 8.37B \times \$150K \\
= \$1260T
\end{gathered}
\]
where:
\[
\begin{gathered}
YLL_{war,total} \\
= Deaths_{war,1900} \times YLL_{war} \\
= 310M \times 27 \\
= 8.37B
\end{gathered}
\]
$1.26 quadrillion (95% CI: $644 trillion-$1.71 quadrillion).
You spent $170 trillion on military. The lives you destroyed were worth $1.26 quadrillion (95% CI: $644 trillion-$1.71 quadrillion). You spent $1 on killing and destroyed over $7 in human value. This is the actual return on investment for organized violence: negative 739%.
No other investment in human history has a worse ROI.
The Compound Opportunity Cost
Most estimates just count the redirected budget. But a world without war since 1900 is not a world that merely moved money around. It is a world where eight compounding channels of growth were never interrupted:
| 1. Productive reallocation |
Murder money becomes medicine money |
+0.8-1.5pp |
Costa Rica abolished its army; GDP growth jumped 0.5-0.8pp for 60 years196 |
| 2. Preserved capital stock |
Factories not bombed keep producing |
+0.2-0.4pp |
Each 1pp of military/GDP costs ~1.1pp of growth197 |
| 3. 310M lives + descendants |
Dead people cannot buy things or invent them |
+0.2-0.4pp |
Their unborn children and grandchildren add 500M-1B people |
| 4. No trade disruption |
Ships ship, trucks truck, refugees work |
+0.1-0.3pp |
108M refugees standing in line for water instead of practicing medicine |
| 5. No poisoned land |
Farms produce food instead of landmine casualties |
+0.1-0.2pp |
Contaminated soil produces nothing for 15-30 years |
| 6. No Cold War isolation |
China opens in 1950, not 1978 |
+0.1-0.3pp |
Half the world economy was behind a wall for 45 years |
| 7. No dictators installed |
Wars produce Stalins; peace produces democracies |
+0.1-0.3pp |
Better property rights, less corruption, more investment |
| 8. Open science |
No security clearances or Iron Curtains |
+0.05-0.15pp |
Scientists who can email each other discover more than scientists who cannot |
| Stacked total |
All of the above, compounding |
+1.65 to 3.55pp |
|
These channels do not merely add. They multiply. Each makes every other channel work better.
Global GDP per capita in 1900: $3,150 (95% CI: $2,314-$3,963). Today: $14,375 (95% CI: $14,081-$14,682). Growth rate: 1.23%/year for 124 years. Add the peace channels:
| Budget only (Costa Rica) |
+1.0pp |
2.23%/year |
$48,637 |
3.4x richer |
+$34,262/year |
| All channels, low |
+1.65pp |
2.88%/year |
$106,730 |
7.4x richer |
+$92,355/year |
| All channels, mid |
+2.6pp |
3.83%/year |
$333,636 (95% CI: $120,624-$921,185) |
23.2x (95% CI: 8.4x-64x) richer |
+$319,261 (95% CI: $106,333-$906,864)/year |
| All channels, high |
+3.55pp |
4.78%/year |
$1,032,170 |
71.8x richer |
+$1,017,795/year |
The average person on Earth would earn $333,636 (95% CI: $120,624-$921,185) per year. The average person in sub-Saharan Africa, who currently earns $1,800/year, would earn roughly $42,000. Not from charity. From compound growth that was never interrupted.
3.83% growth is not ambitious. Japan did 7-9% for two decades after dismantling its military. South Korea did 5-7%. Germany did 8%. They started from rubble. A world that never made the rubble would do better.
At mid-range: $319,261 (95% CI: $106,333-$906,864) per person per year times 8 billion people = $2.55 quadrillion (95% CI: $851 trillion-$7.24 quadrillion) in annual output that does not exist.
The Medical Opportunity Cost
The income number above answers one question: how much richer you would be if your species had not spent 124 years optimizing for rubble. The medical question is separate: what would have happened if the murder money had been spent on not dying?
These are different ledgers. The compound peace economy counts growth that never happened. The medical redirect counts trials that never ran. They overlap (medicine money is part of growth), so you do not get to add them together and wave the total around like a flag. Arithmetic does not allow double-counting, even when the numbers are this embarrassing.
Here is the minimal historical medical counterfactual:
| 1900 treaty |
Military spending frozen at $66.1 billion (95% CI: $50 billion-$90 billion) in real absolute terms |
The arms race stops growing, instead of becoming the planet’s most expensive murder subscription. |
| Excess military spending above the 1900 freeze |
29,937 years (95% CI: 22,459 years-43,917 years) of current government clinical-trial spending |
The scale is absurd enough that even a badly run trial system would have learned things. |
| Major infectious disease control |
1950 (95% CI: 1922-2020) |
Vaccination, antibiotics, sanitation, vector control, and surveillance arrive earlier and at global scale. |
| Major non-aging disease treatment/control |
1950 (95% CI: 1922-2020) |
Most cancer, cardiovascular, autoimmune, psychiatric, rare-disease, and metabolic burden has effective prevention, treatment, or control paths. |
| Biological aging control |
1990 (95% CI: 1962-2060) |
Exploratory sensitivity only. Included to show what the same trial platform might surface if geroscience became testable at population scale. |
“Control” here means practical prevention, treatment, or functional eradication for most of the burden. It does not mean every pathogen is extinct, every tumor biology is solved, or every human has become an immortal invoice reviewer.
Money-Unconstrained Medical Toolchain
The aggressive prosecutor gets a sharper branch. Pretend the defense says, correctly, that trials alone do not buy sequencing, diagnostics, factories, EHRs, AI tooling, surveillance, or the rest of the boring machinery that turns science into medicine. Fine. Reserve $20 trillion (95% CI: $5 trillion-$50 trillion) first for prizes and tool-building. Make it intentionally absurd. Pay every difficult person enough money to become briefly useful.
Then count only what remains. After that reserve, the misallocated war ledger still leaves $150 trillion for pragmatic trials. At $929 (95% CI: $97-$3,000) per patient-slot, that buys 161 billion patient-slots (95% CI: 63.6 billion patient-slots-647 billion patient-slots), or 20.2 patient-slots/person (95% CI: 7.99 patient-slots/person-81.2 patient-slots/person) for every living human. Patient-slots are not unique people. They are repeated opportunities to test prevention, combination therapy, diagnostics, dosing, repurposing, platform vaccines, and population-scale protocols across time. The claim is not that the planet contained hundreds of billions of spare patients. The claim is that the defendants had enough money to saturate every practical bottleneck and still have trial capacity left over.
Observed toolchain anchors show the scale problem:
The reserve is 341x the observed anchor costs above. This is the point. The pleading theory does not need Nobel-grade precision. It needs to defeat the excuse that the missing tools made the medical counterfactual impossible. The money was large enough to buy the tools, overpay for the tools, build factories for the tools, and then fund the trials.
The standard objection is that conceptual breakthroughs – DNA structure, oncogenes, cellular senescence – cannot be bought. This is wrong. Breakthroughs are proportional to the number of researchers working on a problem, which is proportional to funding. Watson and Crick did not discover DNA in 1953 because it was scheduled for 1953. Operation Warp Speed compressed a 10-15 year vaccine timeline to 9 months. The Human Genome Project’s 15-year timeline was matched in 3 years by a competitor with better incentives. The rate-limiting factor is not human genius; it is how many humans can afford to practice science.
The model assumes prize-based funding, not NIH grants. Prizes pay for results; grants pay for process and generate paper-factory output nobody applies. Prize structures produce roughly 5-10x more useful output per dollar. The 1950 (95% CI: 1922-2020) disease cutoff is therefore conservative.
For the forward-looking version of the same machinery starting now, see 1% Treaty Impact198 199. That chapter estimates what happens if the treaty is adopted today. This section estimates what humanity lost by not doing the obvious version in 1900.
This section is the factual basis for Count Three in Humanity v. Government. The charge is not “every disease death is your fault.” The charge is “you had the money to run the trials and you spent it on missiles instead.” One is a tantrum. The other is arithmetic.
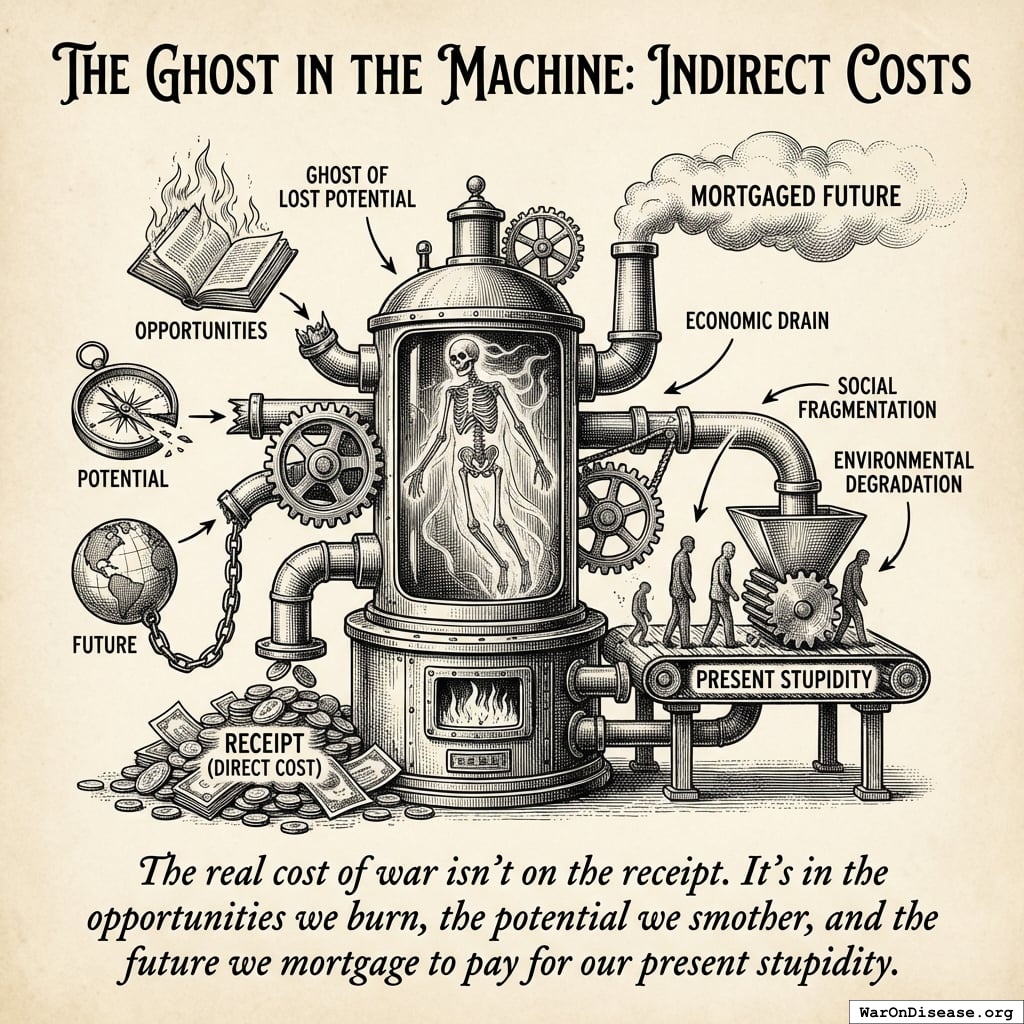
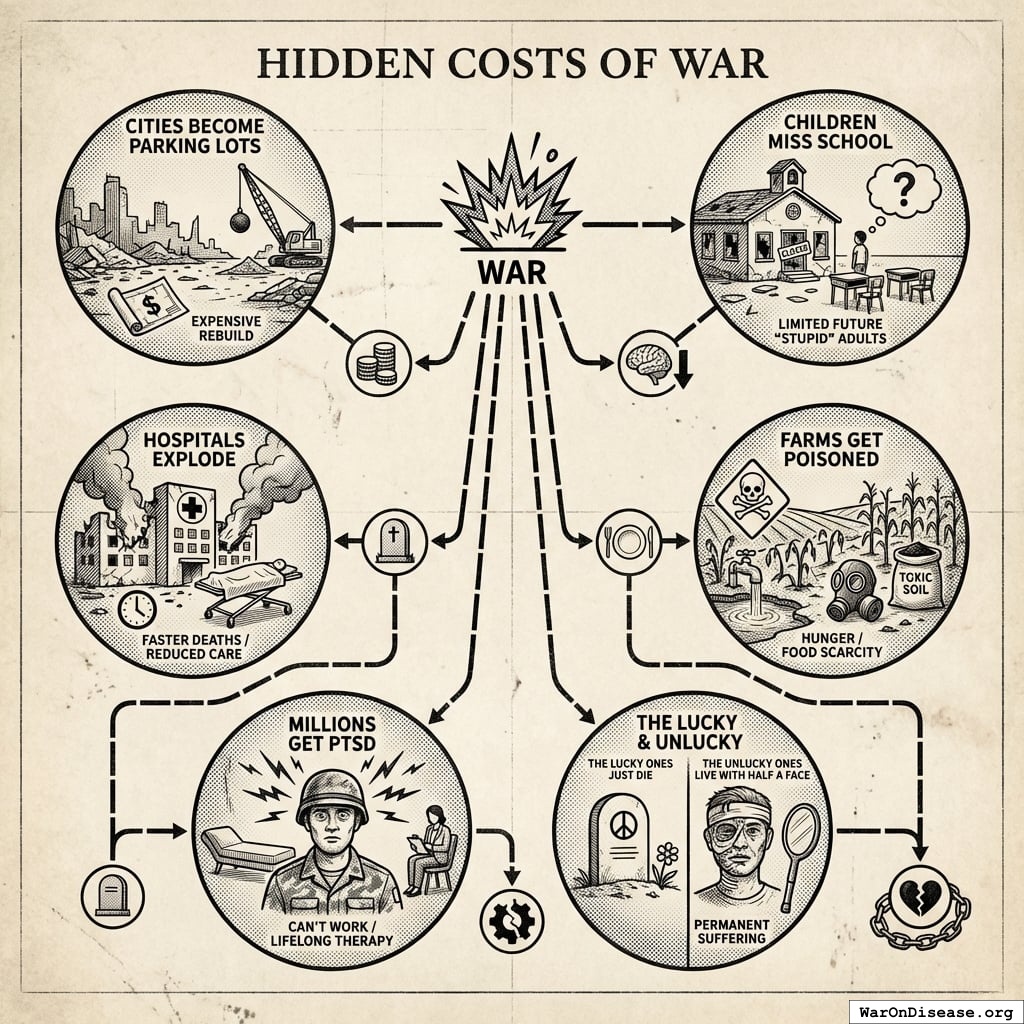
Hidden Costs of War
Each consequence causes the next:
- Cities destroyed. Expensive to rebuild.
- Children miss school. Grow up to be uneducated adults who start more wars.
- Hospitals destroyed. The building you need to fix war injuries was destroyed by the war.
- Farms poisoned. Hungry people fight.
- Millions get PTSD. Cannot work. Need therapy for decades.
The Other Receipt: When Governments Kill Their Own People
Everything above only counts what governments spend killing other countries’ people. It does not include returns on domestic investment.
Political scientist R.J. Rummel spent his career counting what he called “democide”: the murder of unarmed civilians by their own governments. Not soldiers. Not enemy combatants. Civilians. The people governments are supposed to protect. His final estimate: 262 million deaths (95% CI: 200 million deaths-272 million deaths) people murdered by governments in the 20th century alone27. That excludes all battle deaths in wars. This is just the bonus killing.
To be clear: that is more than every war death in the same century combined.
Here is the itemized receipt, sorted by body count:
| China (Mao Zedong) |
1949-1976 |
45-78 million |
Great Leap Forward famine (policy-induced), Cultural Revolution, land reform campaigns |
| Soviet Union (Stalin era) |
1924-1953 |
20+ million |
Gulag system, Ukrainian famine (Holodomor), Great Purge, forced collectivization |
| Nazi Germany |
1933-1945 |
21 million |
Holocaust (6M Jews), plus Slavs, Roma, disabled, POWs, political prisoners |
| Imperial Japan |
1937-1945 |
6 million |
Nanjing massacre, forced labor, biological experiments, civilian massacres across Asia |
| Cambodia (Khmer Rouge) |
1975-1979 |
2 million |
“Year Zero” forced agrarian revolution; ~25% of population killed in 4 years |
| Ottoman Empire |
1915-1923 |
1.5-2 million |
Armenian Genocide, Assyrian and Greek genocides |
| Pakistan (Bangladesh) |
1971 |
1-3 million |
Bangladesh Liberation War atrocities |
| Ethiopia (Mengistu) |
1977-1991 |
1-2 million |
Red Terror, forced resettlement, engineered famine |
| Indonesia |
1965-1966 |
500,000-1 million |
Anti-communist purge |
| Rwanda |
1994 |
800,000-1 million |
Tutsi genocide; 100 days, mostly machetes |
| North Korea |
1948-present |
1-3.5 million |
Political prison camps, forced starvation, purges |
| Iraq (Saddam Hussein) |
1979-2003 |
250,000-500,000 |
Anfal campaign, Marsh Arab destruction, political killings |
| Yugoslavia (Milosevic) |
1991-1999 |
130,000-200,000 |
Srebrenica massacre, ethnic cleansing campaigns |
This table only includes the largest cases. Rummel’s full dataset documents over 200 regimes200. The complete list is longer than this chapter.
Since 2000, the accounting continues: Darfur (~300,000 killed between 2003 and 2008)201, Syria (306,887 civilians killed in the first decade of conflict, with government forces responsible for roughly 91% of civilian casualties)202, Myanmar’s Rohingya (~24,000 killed by state forces since 2017)203, and others. No Rummel-style global update exists for the 21st century, but the running total since 1913 conservatively exceeds 263 million.
A few observations from an outside perspective:
- Communist regimes account for the largest share: 100-148+ million, depending on how you count famine deaths caused by policy. Communism did not just fail as economics. It failed as not-murder.
- These are estimates. Governments that murder their own citizens tend not to keep meticulous records. In many cases, the records were destroyed by the same people who created the bodies. The true number is almost certainly higher.
- Every regime on this list had an army. The army was frequently the instrument of democide. You are instructing these institutions to redirect 1% of their budget. One percent. From the machinery they have historically used to murder 262 million deaths (95% CI: 200 million deaths-272 million deaths) of their own unarmed citizens.
The governments you are trying to negotiate with have, on average, killed more of their own people than foreign enemies have. The call is coming from inside the house. It has always been coming from inside the house.
This is not an argument against government. It is an argument for better incentive structures. The 1% treaty199 does not ask governments to be moral. It directs them to be slightly less expensive at killing. The difference between a government that spends 100% of its military budget on potential murder and one that spends 99% is $27.2 billion per year redirected to not-murder. That is the entire instruction.
1.
NIH Common Fund. NIH pragmatic trials: Minimal funding despite 30x cost advantage.
NIH Common Fund: HCS Research Collaboratory https://commonfund.nih.gov/hcscollaboratory (2025)
The NIH Pragmatic Trials Collaboratory funds trials at $500K for planning phase, $1M/year for implementation-a tiny fraction of NIH’s budget. The ADAPTABLE trial cost $14 million for 15,076 patients (= $929/patient) versus $420 million for a similar traditional RCT (30x cheaper), yet pragmatic trials remain severely underfunded. PCORnet infrastructure enables real-world trials embedded in healthcare systems, but receives minimal support compared to basic research funding. Additional sources: https://commonfund.nih.gov/hcscollaboratory | https://pcornet.org/wp-content/uploads/2025/08/ADAPTABLE_Lay_Summary_21JUL2025.pdf | https://www.ncbi.nlm.nih.gov/pmc/articles/PMC5604499/
.
2.
Cato Institute. Chance of dying from terrorism statistic.
Cato Institute: Terrorism and Immigration Risk Analysis https://www.cato.org/policy-analysis/terrorism-immigration-risk-analysis Chance of American dying in foreign-born terrorist attack: 1 in 3.6 million per year (1975-2015) Including 9/11 deaths; annual murder rate is 253x higher than terrorism death rate More likely to die from lightning strike than foreign terrorism Note: Comprehensive 41-year study shows terrorism risk is extremely low compared to everyday dangers Additional sources: https://www.cato.org/policy-analysis/terrorism-immigration-risk-analysis | https://www.nbcnews.com/news/us-news/you-re-more-likely-die-choking-be-killed-foreign-terrorists-n715141
.
3.
NIH. Antidepressant clinical trial exclusion rates.
Zimmerman et al. https://pubmed.ncbi.nlm.nih.gov/26276679/ (2015)
Mean exclusion rate: 86.1% across 158 antidepressant efficacy trials (range: 44.4% to 99.8%) More than 82% of real-world depression patients would be ineligible for antidepressant registration trials Exclusion rates increased over time: 91.4% (2010-2014) vs. 83.8% (1995-2009) Most common exclusions: comorbid psychiatric disorders, age restrictions, insufficient depression severity, medical conditions Emergency psychiatry patients: only 3.3% eligible (96.7% excluded) when applying 9 common exclusion criteria Only a minority of depressed patients seen in clinical practice are likely to be eligible for most AETs Note: Generalizability of antidepressant trials has decreased over time, with increasingly stringent exclusion criteria eliminating patients who would actually use the drugs in clinical practice Additional sources: https://pubmed.ncbi.nlm.nih.gov/26276679/ | https://pubmed.ncbi.nlm.nih.gov/26164052/ | https://www.wolterskluwer.com/en/news/antidepressant-trials-exclude-most-real-world-patients-with-depression
.
4.
CNBC. Warren buffett’s career average investment return.
CNBC https://www.cnbc.com/2025/05/05/warren-buffetts-return-tally-after-60-years-5502284percent.html (2025)
Berkshire’s compounded annual return from 1965 through 2024 was 19.9%, nearly double the 10.4% recorded by the S&P 500. Berkshire shares skyrocketed 5,502,284% compared to the S&P 500’s 39,054% rise during that period. Additional sources: https://www.cnbc.com/2025/05/05/warren-buffetts-return-tally-after-60-years-5502284percent.html | https://www.slickcharts.com/berkshire-hathaway/returns
.
5.
World Health Organization. WHO global health estimates 2024.
World Health Organization https://www.who.int/data/gho/data/themes/mortality-and-global-health-estimates (2024)
Comprehensive mortality and morbidity data by cause, age, sex, country, and year Global mortality: 55-60 million deaths annually Lives saved by modern medicine (vaccines, cardiovascular drugs, oncology): 12M annually (conservative aggregate) Leading causes of death: Cardiovascular disease (17.9M), Cancer (10.3M), Respiratory disease (4.0M) Note: Baseline data for regulatory mortality analysis. Conservative estimate of pharmaceutical impact based on WHO immunization data (4.5M/year from vaccines) + cardiovascular interventions (3.3M/year) + oncology (1.5M/year) + other therapies. Additional sources: https://www.who.int/data/gho/data/themes/mortality-and-global-health-estimates
.
6.
GiveWell. GiveWell cost per life saved for top charities (2024).
GiveWell: Top Charities https://www.givewell.org/charities/top-charities General range: $3,000-$5,500 per life saved (GiveWell top charities) Helen Keller International (Vitamin A): $3,500 average (2022-2024); varies $1,000-$8,500 by country Against Malaria Foundation: $5,500 per life saved New Incentives (vaccination incentives): $4,500 per life saved Malaria Consortium (seasonal malaria chemoprevention): $3,500 per life saved VAS program details: $2 to provide vitamin A supplements to child for one year Note: Figures accurate for 2024. Helen Keller VAS program has wide country variation ($1K-$8.5K) but $3,500 is accurate average. Among most cost-effective interventions globally Additional sources: https://www.givewell.org/charities/top-charities | https://www.givewell.org/charities/helen-keller-international | https://ourworldindata.org/cost-effectiveness
.
7.
U.S. Department of Defense.
5.56mm NATO ammunition bulk procurement pricing. (2024)
The cost of 5.56mm NATO ammunition at military bulk procurement rates is approximately $0.40 per round, based on Lake City Army Ammunition Plant production and commercial market floor prices for mil-spec M855 ammunition.
8.
Pike, J.
U.s. Forces fire 250,000 rounds for every insurgent killed. (2011)
The General Accounting Office reports that US forces used 1.8 billion rounds of small-arms ammunition per year, a level that more than doubled in five years. An estimated 250,000 rounds were fired for every insurgent killed in Iraq and Afghanistan.
9.
AARP. Unpaid caregiver hours and economic value.
AARP 2023 https://www.aarp.org/caregiving/financial-legal/info-2023/unpaid-caregivers-provide-billions-in-care.html (2023)
Average family caregiver: 25-26 hours per week (100-104 hours per month) 38 million caregivers providing 36 billion hours of care annually Economic value: $16.59 per hour = $600 billion total annual value (2021) 28% of people provided eldercare on a given day, averaging 3.9 hours when providing care Caregivers living with care recipient: 37.4 hours per week Caregivers not living with recipient: 23.7 hours per week Note: Disease-related caregiving is subset of total; includes elderly care, disability care, and child care Additional sources: https://www.aarp.org/caregiving/financial-legal/info-2023/unpaid-caregivers-provide-billions-in-care.html | https://www.bls.gov/news.release/elcare.nr0.htm | https://www.caregiver.org/resource/caregiver-statistics-demographics/
.
10.
Forbes.
Forbes world’s billionaires list 2024. (2024)
Forbes identified a record 2,781 billionaires worldwide with combined net worth of $14.2 trillion, 141 more than 2023. Bernard Arnault (LVMH) topped the list at $233 billion.
11.
CDC MMWR. Childhood vaccination economic benefits.
CDC MMWR https://www.cdc.gov/mmwr/volumes/73/wr/mm7331a2.htm (1994)
US programs (1994-2023): $540B direct savings, $2.7T societal savings ( $18B/year direct, $90B/year societal) Global (2001-2020): $820B value for 10 diseases in 73 countries ( $41B/year) ROI: $11 return per $1 invested Measles vaccination alone saved 93.7M lives (61% of 154M total) over 50 years (1974-2024) Additional sources: https://www.cdc.gov/mmwr/volumes/73/wr/mm7331a2.htm | https://www.thelancet.com/journals/lancet/article/PIIS0140-6736(24)00850-X/fulltext
.
15.
U.S. Bureau of Labor Statistics.
CPI inflation calculator. (2024)
CPI-U (1980): 82.4 CPI-U (2024): 313.5 Inflation multiplier (1980-2024): 3.80× Cumulative inflation: 280.48% Average annual inflation rate: 3.08% Note: Official U.S. government inflation data using Consumer Price Index for All Urban Consumers (CPI-U). Additional sources: https://www.bls.gov/data/inflation_calculator.htm
.
16.
James Surowiecki.
The Wisdom of Crowds. (Surowiecki, 2004).
Explores the aggregation of information in groups, arguing that decisions are often better than could have been made by any single member of the group. The opening anecdote relates Francis Galton’s surprise that the crowd at a county fair accurately guessed the weight of an ox when the median of their individual guesses was taken. The three conditions for a group to be intelligent are diversity, independence, and decentralization. Additional sources: https://archive.org/details/wisdomofcrowds0000suro | https://en.wikipedia.org/wiki/The_Wisdom_of_Crowds | https://www.amazon.com/Wisdom-Crowds-James-Surowiecki/dp/0385721706
.
17.
ClinicalTrials.gov API v2 direct analysis. ClinicalTrials.gov cumulative enrollment data (2025).
Direct analysis via ClinicalTrials.gov API v2 https://clinicaltrials.gov/data-api/api Analysis of 100,000 active/recruiting/completed trials on ClinicalTrials.gov (as of January 2025) shows cumulative enrollment of 12.2 million participants: Phase 1 (722k), Phase 2 (2.2M), Phase 3 (6.5M), Phase 4 (2.7M). Median participants per trial: Phase 1 (33), Phase 2 (60), Phase 3 (237), Phase 4 (90). Additional sources: https://clinicaltrials.gov/data-api/api
.
18.
ACS CAN. Clinical trial patient participation rate.
ACS CAN: Barriers to Clinical Trial Enrollment https://www.fightcancer.org/policy-resources/barriers-patient-enrollment-therapeutic-clinical-trials-cancer Only 3-5% of adult cancer patients in US receive treatment within clinical trials About 5% of American adults have ever participated in any clinical trial Oncology: 2-3% of all oncology patients participate Contrast: 50-60% enrollment for pediatric cancer trials (<15 years old) Note: 20% of cancer trials fail due to insufficient enrollment; 11% of research sites enroll zero patients Additional sources: https://www.fightcancer.org/policy-resources/barriers-patient-enrollment-therapeutic-clinical-trials-cancer | https://hints.cancer.gov/docs/Briefs/HINTS_Brief_48.pdf
.
19.
ScienceDaily. Global prevalence of chronic disease.
ScienceDaily: GBD 2015 Study https://www.sciencedaily.com/releases/2015/06/150608081753.htm (2015)
2.3 billion individuals had more than five ailments (2013) Chronic conditions caused 74% of all deaths worldwide (2019), up from 67% (2010) Approximately 1 in 3 adults suffer from multiple chronic conditions (MCCs) Risk factor exposures: 2B exposed to biomass fuel, 1B to air pollution, 1B smokers Projected economic cost: $47 trillion by 2030 Note: 2.3B with 5+ ailments is more accurate than "2B with chronic disease." One-third of all adults globally have multiple chronic conditions Additional sources: https://www.sciencedaily.com/releases/2015/06/150608081753.htm | https://pmc.ncbi.nlm.nih.gov/articles/PMC10830426/ | https://pmc.ncbi.nlm.nih.gov/articles/PMC6214883/
.
20.
C&EN. Annual number of new drugs approved globally: 50.
C&EN https://cen.acs.org/pharmaceuticals/50-new-drugs-received-FDA/103/i2 (2025)
50 new drugs approved annually Additional sources: https://cen.acs.org/pharmaceuticals/50-new-drugs-received-FDA/103/i2 | https://www.fda.gov/drugs/development-approval-process-drugs/novel-drug-approvals-fda
.
21.
Williams, R. J., Tse, T., DiPiazza, K. & Zarin, D. A.
Terminated trials in the ClinicalTrials.gov results database: Evaluation of availability of primary outcome data and reasons for termination.
PLOS One 10, e0127242 (2015)
Approximately 12% of trials with results posted on the ClinicalTrials.gov results database (905/7,646) were terminated. Primary reasons: insufficient accrual (57% of non-data-driven terminations), business/strategic reasons, and efficacy/toxicity findings (21% data-driven terminations).
24.
OpenSecrets. Defense sector lobbying summary.
OpenSecrets https://www.opensecrets.org/federal-lobbying/sectors/summary?id=D (2025)
Military sector federal lobbying totaled $198,009,793 in 2025, up from $159.5 million in 2024 and $142.9 million in 2023. Additional sources: https://www.opensecrets.org/federal-lobbying/sectors/summary?id=D
.
25.
Companies Market Cap.
BAE systems and thales market capitalization. (2026)
BAE Systems market capitalization approx $75.80B and Thales approx $56.68B as of June 2026, combined approx $132.5B for the two major allied European military primes. Additional sources: https://companiesmarketcap.com/thales/marketcap/
.
26.
Stock Analysis.
Military prime contractor market capitalization and float statistics. (2026)
Combined market capitalization of 11 US military primes approx $835.8B at the 2026-06-11 close: RTX $248.07B, Boeing $174.71B, Lockheed Martin $126.51B, General Dynamics $96.90B, Northrop Grumman $78.48B, L3Harris $58.16B, Leidos $15.36B, Huntington Ingalls $11.86B, CACI $11.61B, Booz Allen Hamilton $9.24B, SAIC $4.86B. Tradeable float across the 13 Western primes (adding BAE Systems and Thales) approx $880B, about 91 percent of combined cap (range $850-900B), from per-company float and shares-outstanding statistics pages; big-5 floats verified individually (RTX 92.6%, BA 96.0%, LMT 85.7%, GD 94.2%, NOC 99.7%); Thales is the outlier at approx 45% float because the French State (26.60%) and Dassault Aviation (26.59%) stakes are locked. Additional sources: https://stockanalysis.com/stocks/rtx/statistics/ | https://www.dassault-aviation.com/en/group/about-us/shareholding-structure-and-organization-chart/
.
27.
Rummel, R. J.
Death by Government: Genocide and Mass Murder Since 1900. (Transaction Publishers, 1994).
Political scientist R.J. Rummel’s comprehensive accounting of democide (government murder of unarmed civilians) in the 20th century. His final revised estimate: 262 million people murdered by their own governments from 1900-1999, excluding battle deaths in wars. Range: 200-272+ million. Communist regimes account for the largest share (100-148+ million). Updated figures at hawaii.edu/powerkills.
28.
GiveWell. Cost per DALY for deworming programs.
https://www.givewell.org/international/technical/programs/deworming/cost-effectiveness Schistosomiasis treatment: $28.19-$70.48 per DALY (using arithmetic means with varying disability weights) Soil-transmitted helminths (STH) treatment: $82.54 per DALY (midpoint estimate) Note: GiveWell explicitly states this 2011 analysis is "out of date" and their current methodology focuses on long-term income effects rather than short-term health DALYs Additional sources: https://www.givewell.org/international/technical/programs/deworming/cost-effectiveness
.
29.
Calculated from IHME Global Burden of Disease (2.55B DALYs) and global GDP per capita valuation. $109 trillion annual global disease burden.
The global economic burden of disease, including direct healthcare costs ($8.2 trillion) and lost productivity ($100.9 trillion from 2.55 billion DALYs × $39,570 per DALY), totals approximately $109.1 trillion annually.
31.
Think by Numbers. Pre-1962 drug development costs and timeline (think by numbers).
Think by Numbers: How Many Lives Does FDA Save? https://thinkbynumbers.org/health/how-many-net-lives-does-the-fda-save/ (1962)
Historical estimates (1970-1985): USD $226M fully capitalized (2011 prices) 1980s drugs: $65M after-tax R&D (1990 dollars), $194M compounded to approval (1990 dollars) Modern comparison: $2-3B costs, 7-12 years (dramatic increase from pre-1962) Context: 1962 regulatory clampdown reduced new treatment production by 70%, dramatically increasing development timelines and costs Note: Secondary source; less reliable than Congressional testimony Additional sources: https://thinkbynumbers.org/health/how-many-net-lives-does-the-fda-save/ | https://en.wikipedia.org/wiki/Cost_of_drug_development | https://www.statnews.com/2018/10/01/changing-1962-law-slash-drug-prices/
.
32.
Biotechnology Innovation Organization (BIO). BIO clinical development success rates 2011-2020.
Biotechnology Innovation Organization (BIO) https://go.bio.org/rs/490-EHZ-999/images/ClinicalDevelopmentSuccessRates2011_2020.pdf (2021)
Phase I duration: 2.3 years average Total time to market (Phase I-III + approval): 10.5 years average Phase transition success rates: Phase I→II: 63.2%, Phase II→III: 30.7%, Phase III→Approval: 58.1% Overall probability of approval from Phase I: 12% Note: Largest publicly available study of clinical trial success rates. Efficacy lag = 10.5 - 2.3 = 8.2 years post-safety verification. Additional sources: https://go.bio.org/rs/490-EHZ-999/images/ClinicalDevelopmentSuccessRates2011_2020.pdf
.
33.
Nature Medicine. Drug repurposing rate ( 30%).
Nature Medicine https://www.nature.com/articles/s41591-024-03233-x (2024)
Approximately 30% of drugs gain at least one new indication after initial approval. Additional sources: https://www.nature.com/articles/s41591-024-03233-x
.
34.
EPI. Education investment economic multiplier (2.1).
EPI: Public Investments Outside Core Infrastructure https://www.epi.org/publication/bp348-public-investments-outside-core-infrastructure/ Early childhood education: Benefits 12X outlays by 2050; $8.70 per dollar over lifetime Educational facilities: $1 spent → $1.50 economic returns Energy efficiency comparison: 2-to-1 benefit-to-cost ratio (McKinsey) Private return to schooling: 9% per additional year (World Bank meta-analysis) Note: 2.1 multiplier aligns with benefit-to-cost ratios for educational infrastructure/energy efficiency. Early childhood education shows much higher returns (12X by 2050) Additional sources: https://www.epi.org/publication/bp348-public-investments-outside-core-infrastructure/ | https://documents1.worldbank.org/curated/en/442521523465644318/pdf/WPS8402.pdf | https://freopp.org/whitepapers/establishing-a-practical-return-on-investment-framework-for-education-and-skills-development-to-expand-economic-opportunity/
.
35.
PMC. Healthcare investment economic multiplier (1.8).
PMC: California Universal Health Care https://pmc.ncbi.nlm.nih.gov/articles/PMC5954824/ (2022)
Healthcare fiscal multiplier: 4.3 (95% CI: 2.5-6.1) during pre-recession period (1995-2007) Overall government spending multiplier: 1.61 (95% CI: 1.37-1.86) Why healthcare has high multipliers: No effect on trade deficits (spending stays domestic); improves productivity & competitiveness; enhances long-run potential output Gender-sensitive fiscal spending (health & care economy) produces substantial positive growth impacts Note: "1.8" appears to be conservative estimate; research shows healthcare multipliers of 4.3 Additional sources: https://pmc.ncbi.nlm.nih.gov/articles/PMC5954824/ | https://cepr.org/voxeu/columns/government-investment-and-fiscal-stimulus | https://ncbi.nlm.nih.gov/pmc/articles/PMC3849102/ | https://set.odi.org/wp-content/uploads/2022/01/Fiscal-multipliers-review.pdf
.
36.
World Bank. Infrastructure investment economic multiplier (1.6).
World Bank: Infrastructure Investment as Stimulus https://blogs.worldbank.org/en/ppps/effectiveness-infrastructure-investment-fiscal-stimulus-what-weve-learned (2022)
Infrastructure fiscal multiplier: 1.6 during contractionary phase of economic cycle Average across all economic states: 1.5 (meaning $1 of public investment → $1.50 of economic activity) Time horizon: 0.8 within 1 year, 1.5 within 2-5 years Range of estimates: 1.5-2.0 (following 2008 financial crisis & American Recovery Act) Italian public construction: 1.5-1.9 multiplier US ARRA: 0.4-2.2 range (differential impacts by program type) Economic Policy Institute: Uses 1.6 for infrastructure spending (middle range of estimates) Note: Public investment less likely to crowd out private activity during recessions; particularly effective when monetary policy loose with near-zero rates Additional sources: https://blogs.worldbank.org/en/ppps/effectiveness-infrastructure-investment-fiscal-stimulus-what-weve-learned | https://www.gihub.org/infrastructure-monitor/insights/fiscal-multiplier-effect-of-infrastructure-investment/ | https://cepr.org/voxeu/columns/government-investment-and-fiscal-stimulus | https://www.richmondfed.org/publications/research/economic_brief/2022/eb_22-04
.
37.
Mercatus. Military spending economic multiplier (0.6).
Mercatus: Defense Spending and Economy https://www.mercatus.org/research/research-papers/defense-spending-and-economy Ramey (2011): 0.6 short-run multiplier Barro (1981): 0.6 multiplier for WWII spending (war spending crowded out 40¢ private economic activity per federal dollar) Barro & Redlick (2011): 0.4 within current year, 0.6 over two years; increased govt spending reduces private-sector GDP portions General finding: $1 increase in deficit-financed federal military spending = less than $1 increase in GDP Variation by context: Central/Eastern European NATO: 0.6 on impact, 1.5-1.6 in years 2-3, gradual fall to zero Ramey & Zubairy (2018): Cumulative 1% GDP increase in military expenditure raises GDP by 0.7% Additional sources: https://www.mercatus.org/research/research-papers/defense-spending-and-economy | https://cepr.org/voxeu/columns/world-war-ii-america-spending-deficits-multipliers-and-sacrifice | https://www.rand.org/content/dam/rand/pubs/research_reports/RRA700/RRA739-2/RAND_RRA739-2.pdf
.
39.
FDA. FDA-approved prescription drug products (20,000+).
FDA https://www.fda.gov/media/143704/download There are over 20,000 prescription drug products approved for marketing. Additional sources: https://www.fda.gov/media/143704/download
.
42.
ACLED. Active combat deaths annually.
ACLED: Global Conflict Surged 2024 https://acleddata.com/2024/12/12/data-shows-global-conflict-surged-in-2024-the-washington-post/ (2024)
2024: 233,597 deaths (30% increase from 179,099 in 2023) Deadliest conflicts: Ukraine (67,000), Palestine (35,000) Nearly 200,000 acts of violence (25% higher than 2023, double from 5 years ago) One in six people globally live in conflict-affected areas Additional sources: https://acleddata.com/2024/12/12/data-shows-global-conflict-surged-in-2024-the-washington-post/ | https://acleddata.com/media-citation/data-shows-global-conflict-surged-2024-washington-post | https://acleddata.com/conflict-index/index-january-2024/
.
43.
UCDP. State violence deaths annually.
UCDP: Uppsala Conflict Data Program https://ucdp.uu.se/ Uppsala Conflict Data Program (UCDP): Tracks one-sided violence (organized actors attacking unarmed civilians) UCDP definition: Conflicts causing at least 25 battle-related deaths in calendar year 2023 total organized violence: 154,000 deaths; Non-state conflicts: 20,900 deaths UCDP collects data on state-based conflicts, non-state conflicts, and one-sided violence Specific "2,700 annually" figure for state violence not found in recent UCDP data; actual figures vary annually Additional sources: https://ucdp.uu.se/ | https://en.wikipedia.org/wiki/Uppsala_Conflict_Data_Program | https://ourworldindata.org/grapher/deaths-in-armed-conflicts-by-region
.
44.
Our World in Data. Terror attack deaths (8,300 annually).
Our World in Data: Terrorism https://ourworldindata.org/terrorism (2024)
2023: 8,352 deaths (22% increase from 2022, highest since 2017) 2023: 3,350 terrorist incidents (22% decrease), but 56% increase in avg deaths per attack Global Terrorism Database (GTD): 200,000+ terrorist attacks recorded (2021 version) Maintained by: National Consortium for Study of Terrorism & Responses to Terrorism (START), U. of Maryland Geographic shift: Epicenter moved from Middle East to Central Sahel (sub-Saharan Africa) - now >50% of all deaths Additional sources: https://ourworldindata.org/terrorism | https://reliefweb.int/report/world/global-terrorism-index-2024 | https://www.start.umd.edu/gtd/ | https://ourworldindata.org/grapher/fatalities-from-terrorism
.
45.
Institute for Health Metrics and Evaluation (IHME). IHME global burden of disease 2021 (2.88B DALYs, 1.13B YLD).
Institute for Health Metrics and Evaluation (IHME) https://vizhub.healthdata.org/gbd-results/ (2024)
In 2021, global DALYs totaled approximately 2.88 billion, comprising 1.75 billion Years of Life Lost (YLL) and 1.13 billion Years Lived with Disability (YLD). This represents a 13% increase from 2019 (2.55B DALYs), largely attributable to COVID-19 deaths and aging populations. YLD accounts for approximately 39% of total DALYs, reflecting the substantial burden of non-fatal chronic conditions. Additional sources: https://vizhub.healthdata.org/gbd-results/ | https://www.thelancet.com/journals/lancet/article/PIIS0140-6736(24)00757-8/fulltext | https://www.healthdata.org/research-analysis/about-gbd
.
46.
Costs of War Project, Brown University Watson Institute. Environmental cost of war ($100B annually).
Brown Watson Costs of War: Environmental Cost https://watson.brown.edu/costsofwar/costs/social/environment War on Terror emissions: 1.2B metric tons GHG (equivalent to 257M cars/year) Military: 5.5% of global GHG emissions (2X aviation + shipping combined) US DoD: World’s single largest institutional oil consumer, 47th largest emitter if nation Cleanup costs: $500B+ for military contaminated sites Gaza war environmental damage: $56.4B; landmine clearance: $34.6B expected Climate finance gap: Rich nations spend 30X more on military than climate finance Note: Military activities cause massive environmental damage through GHG emissions, toxic contamination, and long-term cleanup costs far exceeding current climate finance commitments Additional sources: https://watson.brown.edu/costsofwar/costs/social/environment | https://earth.org/environmental-costs-of-wars/ | https://transformdefence.org/transformdefence/stats/
.
47.
ScienceDaily. Medical research lives saved annually (4.2 million).
ScienceDaily: Physical Activity Prevents 4M Deaths https://www.sciencedaily.com/releases/2020/06/200617194510.htm (2020)
Physical activity: 3.9M early deaths averted annually worldwide (15% lower premature deaths than without) COVID vaccines (2020-2024): 2.533M deaths averted, 14.8M life-years preserved; first year alone: 14.4M deaths prevented Cardiovascular prevention: 3 interventions could delay 94.3M deaths over 25 years (antihypertensives alone: 39.4M) Pandemic research response: Millions of deaths averted through rapid vaccine/drug development Additional sources: https://www.sciencedaily.com/releases/2020/06/200617194510.htm | https://pmc.ncbi.nlm.nih.gov/articles/PMC9537923/ | https://www.ahajournals.org/doi/10.1161/CIRCULATIONAHA.118.038160 | https://pmc.ncbi.nlm.nih.gov/articles/PMC9464102/
.
48.
SIPRI. 36:1 disparity ratio of spending on weapons over cures.
SIPRI: Military Spending https://www.sipri.org/commentary/blog/2016/opportunity-cost-world-military-spending (2016)
Global military spending: $2.7 trillion (2024, SIPRI) Global government medical research: $68 billion (2024) Actual ratio: 39.7:1 in favor of weapons over medical research Military R&D alone: $85B (2004 data, 10% of global R&D) Military spending increases crowd out health: 1% ↑ military = 0.62% ↓ health spending Note: Ratio actually worse than 36:1. Each 1% increase in military spending reduces health spending by 0.62%, with effect more intense in poorer countries (0.962% reduction) Additional sources: https://www.sipri.org/commentary/blog/2016/opportunity-cost-world-military-spending | https://pmc.ncbi.nlm.nih.gov/articles/PMC9174441/ | https://www.congress.gov/crs-product/R45403
.
49.
Think by Numbers. Lost human capital due to war ($270B annually).
Think by Numbers https://thinkbynumbers.org/military/war/the-economic-case-for-peace-a-comprehensive-financial-analysis/ (2021)
Lost human capital from war: $300B annually (economic impact of losing skilled/productive individuals to conflict) Broader conflict/violence cost: $14T/year globally 1.4M violent deaths/year; conflict holds back economic development, causes instability, widens inequality, erodes human capital 2002: 48.4M DALYs lost from 1.6M violence deaths = $151B economic value (2000 USD) Economic toll includes: commodity prices, inflation, supply chain disruption, declining output, lost human capital Additional sources: https://thinkbynumbers.org/military/war/the-economic-case-for-peace-a-comprehensive-financial-analysis/ | https://www.weforum.org/stories/2021/02/war-violence-costs-each-human-5-a-day/ | https://pubmed.ncbi.nlm.nih.gov/19115548/
.
50.
PubMed. Psychological impact of war cost ($100B annually).
PubMed: Economic Burden of PTSD https://pubmed.ncbi.nlm.nih.gov/35485933/ PTSD economic burden (2018 U.S.): $232.2B total ($189.5B civilian, $42.7B military) Civilian costs driven by: Direct healthcare ($66B), unemployment ($42.7B) Military costs driven by: Disability ($17.8B), direct healthcare ($10.1B) Exceeds costs of other mental health conditions (anxiety, depression) War-exposed populations: 2-3X higher rates of anxiety, depression, PTSD; women and children most vulnerable Note: Actual burden $232B, significantly higher than "$100B" claimed Additional sources: https://pubmed.ncbi.nlm.nih.gov/35485933/ | https://news.va.gov/103611/study-national-economic-burden-of-ptsd-staggering/ | https://pmc.ncbi.nlm.nih.gov/articles/PMC9957523/
.
51.
CGDev. UNHCR average refugee support cost.
CGDev https://www.cgdev.org/blog/costs-hosting-refugees-oecd-countries-and-why-uk-outlier (2024)
The average cost of supporting a refugee is $1,384 per year. This represents total host country costs (housing, healthcare, education, security). OECD countries average $6,100 per refugee (mean 2022-2023), with developing countries spending $700-1,000. Global weighted average of $1,384 is reasonable given that 75-85% of refugees are in low/middle-income countries. Additional sources: https://www.cgdev.org/blog/costs-hosting-refugees-oecd-countries-and-why-uk-outlier | https://www.unhcr.org/sites/default/files/2024-11/UNHCR-WB-global-cost-of-refugee-inclusion-in-host-country-health-systems.pdf
.
52.
World Bank. World bank trade disruption cost from conflict.
World Bank https://www.worldbank.org/en/topic/trade/publication/trading-away-from-conflict Estimated $616B annual cost from conflict-related trade disruption. World Bank research shows civil war costs an average developing country 30 years of GDP growth, with 20 years needed for trade to return to pre-war levels. Trade disputes analysis shows tariff escalation could reduce global exports by up to $674 billion. Additional sources: https://www.worldbank.org/en/topic/trade/publication/trading-away-from-conflict | https://www.nber.org/papers/w11565 | http://blogs.worldbank.org/en/trade/impacts-global-trade-and-income-current-trade-disputes
.
53.
VA. Veteran healthcare cost projections.
VA https://department.va.gov/wp-content/uploads/2025/06/2026-Budget-in-Brief.pdf (2026)
VA budget: $441.3B requested for FY 2026 (10% increase). Disability compensation: $165.6B in FY 2024 for 6.7M veterans. PACT Act projected to increase spending by $300B between 2022-2031. Costs under Toxic Exposures Fund: $20B (2024), $30.4B (2025), $52.6B (2026). Additional sources: https://department.va.gov/wp-content/uploads/2025/06/2026-Budget-in-Brief.pdf | https://www.cbo.gov/publication/45615 | https://www.legion.org/information-center/news/veterans-healthcare/2025/june/va-budget-tops-400-billion-for-2025-from-higher-spending-on-mandated-benefits-medical-care
.
56.
Cybersecurity Ventures. Cybercrime economy projected to reach $10.5 trillion.
Cybersecurity Ventures: $10.5T Cybercrime https://cybersecurityventures.com/hackerpocalypse-cybercrime-report-2016/ (2016)
Global cybercrime costs: $3T (2015) → $6T (2021) → $10.5T (2025 projected) 15% annual growth rate If measured as country, would be 3rd largest economy after US and China Greatest transfer of economic wealth in history Note: More profitable than global trade of all major illegal drugs combined. Includes data theft, productivity loss, IP theft, fraud Additional sources: <https://cybersecurityventures.com/hackerpocalypse-cybercrime-report-2016/> | https://www.boisestate.edu/cybersecurity/2022/06/16/cybercrime-to-cost-the-world-10-5-trillion-annually-by-2025/
.
58.
Bolt, J. & Zanden, J. L. van.
Maddison project database 2020. (2020)
Historical GDP per capita estimates from year 1 to present. Global GDP per capita in 1900: approximately 1,260 in 1990 international dollars (roughly 3,150 in 2024 USD after PPP and inflation adjustment). Standard reference for long-run comparative economic history.
59.
Applied Clinical Trials. Global government spending on interventional clinical trials: $3-6 billion/year.
Applied Clinical Trials https://www.appliedclinicaltrialsonline.com/view/sizing-clinical-research-market Estimated range based on NIH ( $0.8-5.6B), NIHR ($1.6B total budget), and EU funding ( $1.3B/year). Roughly 5-10% of global market. Additional sources: https://www.appliedclinicaltrialsonline.com/view/sizing-clinical-research-market | https://www.thelancet.com/journals/langlo/article/PIIS2214-109X(20)30357-0/fulltext
.
64.
United Nations Department of Economic and Social Affairs, Population Division.
World population prospects 2024: Summary of results. (2024)
The 2024 Revision of the World Population Prospects provides population estimates and projections for 237 countries or areas. Global median age approximately 30.5 years in 2024, reflecting population-weighted average across all regions.
67.
Estimated from major foundation budgets and activities. Nonprofit clinical trial funding estimate.
Nonprofit foundations spend an estimated $2-5 billion annually on clinical trials globally, representing approximately 2-5% of total clinical trial spending.
68.
ICAN. Global nuclear weapon maintenance cost: $100 billion/year.
ICAN: Global Spending $100B 2024 https://www.icanw.org/global_spending_on_nuclear_weapons_topped_100_billion_in_2024 (2024)
2024: >$100 billion ($190,151/minute) - 11% increase ($9.9B) from 2023 Nine nuclear-armed states: China, France, India, Israel, N. Korea, Pakistan, Russia, UK, US US: $56.8B (more than all other 8 states combined); China: $12.5B; UK: $10B (+26% YoY, biggest increase) Historical trend: $72.9B (2019) → $82.4B (2021) → >$100B (2024) Private sector contracts: $463B ongoing; $42.5B earned from contracts in 2024 alone Note: $100B/year figure accurate for 2024. Rapid growth from $73B (2019). US spends more than rest of world combined on nuclear weapons Additional sources: https://www.icanw.org/global_spending_on_nuclear_weapons_topped_100_billion_in_2024 | https://www.icanw.org/the_cost_of_nuclear_weapons
.
69.
Industry reports: IQVIA. Global pharmaceutical r&d spending.
Total global pharmaceutical R&D spending is approximately $300 billion annually. Clinical trials represent 15-20% of this total ($45-60B), with the remainder going to drug discovery, preclinical research, regulatory affairs, and manufacturing development.
70.
UN. Global population reaches 8 billion.
UN: World Population 8 Billion Nov 15 2022 https://www.un.org/en/desa/world-population-reach-8-billion-15-november-2022 (2022)
Milestone: November 15, 2022 (UN World Population Prospects 2022) Day of Eight Billion" designated by UN Added 1 billion people in just 11 years (2011-2022) Growth rate: Slowest since 1950; fell under 1% in 2020 Future: 15 years to reach 9B (2037); projected peak 10.4B in 2080s Projections: 8.5B (2030), 9.7B (2050), 10.4B (2080-2100 plateau) Note: Milestone reached Nov 2022. Population growth slowing; will take longer to add next billion (15 years vs 11 years) Additional sources: https://www.un.org/en/desa/world-population-reach-8-billion-15-november-2022 | https://www.un.org/en/dayof8billion | https://en.wikipedia.org/wiki/Day_of_Eight_Billion
.
71.
Harvard Kennedy School. 3.5% participation tipping point.
Harvard Kennedy School https://www.hks.harvard.edu/centers/carr/publications/35-rule-how-small-minority-can-change-world (2020)
The research found that nonviolent campaigns were twice as likely to succeed as violent ones, and once 3.5% of the population were involved, they were always successful. Chenoweth and Maria Stephan studied the success rates of civil resistance efforts from 1900 to 2006, finding that nonviolent movements attracted, on average, four times as many participants as violent movements and were more likely to succeed. Key finding: Every campaign that mobilized at least 3.5% of the population in sustained protest was successful (in their 1900-2006 dataset) Note: The 3.5% figure is a descriptive statistic from historical analysis, not a guaranteed threshold. One exception (Bahrain 2011-2014 with 6%+ participation) has been identified. The rule applies to regime change, not policy change in democracies. Additional sources: https://www.hks.harvard.edu/centers/carr/publications/35-rule-how-small-minority-can-change-world | https://www.hks.harvard.edu/sites/default/files/2024-05/Erica%20Chenoweth_2020-005.pdf | https://www.bbc.com/future/article/20190513-it-only-takes-35-of-people-to-change-the-world | https://en.wikipedia.org/wiki/3.5%25_rule
.
72.
International IDEA.
International IDEA voter turnout database world export. (2026)
Best current register-based estimate of global registered voters. Sum of the latest available country-level Registration counts in International IDEA’s world export on 2026-04-22 = 4,128,142,495 registered voters across 199 countries and political entities. Methodology notes that Registration is the number of names on the voters’ register as reported by electoral management bodies, and comparability is imperfect because voter rolls and registration systems differ across countries. Additional sources: https://www.idea.int/data-tools/data/voter-turnout-database | https://www.idea.int/data-tools/export?type=region_only&themeId=293&world=all&loc=home
.
74.
Federation of American Scientists. World nuclear forces.
Federation of American Scientists https://fas.org/issues/nuclear-weapons/status-world-nuclear-forces/ (2024)
As of early 2025, we estimate that the world’s nine nuclear-armed states possess a combined total of approximately 12,241 nuclear warheads. Additional sources: https://fas.org/issues/nuclear-weapons/status-world-nuclear-forces/
.
75.
OpenSecrets.
Top lobbying industries 2025. (2025)
Sector ranks and per-company federal lobbying spending for 2025. Combined market capitalization of the top-5 publicly traded US lobbying spenders in each government-controlling sector: pharmaceuticals $1,794.7B; technology $13,279.5B; insurance $385.6B; oil and gas $1,246.9B; four-sector total approx $16.71T. Caveats: Meta (Zuckerberg holds 60.8% of voting power) and Alphabet (Page and Brin hold 52.3%) cannot be majority-acquired; Ellison owns 40.6% of Oracle; the largest insurance lobbyists are mutuals with no public shares; trade associations (PhRMA, AHIP, SIFMA, API) are not acquirable. Additional sources: https://stockanalysis.com/stocks/
.
76.
NHGRI. Human genome project and CRISPR discovery.
NHGRI https://www.genome.gov/11006929/2003-release-international-consortium-completes-hgp (2003)
Your DNA is 3 billion base pairs Read the entire code (Human Genome Project, completed 2003) Learned to edit it (CRISPR, discovered 2012) Additional sources: https://www.genome.gov/11006929/2003-release-international-consortium-completes-hgp | https://www.nobelprize.org/prizes/chemistry/2020/press-release/
.
77.
PMC. Only 12% of human interactome targeted.
PMC https://pmc.ncbi.nlm.nih.gov/articles/PMC10749231/ (2023)
Mapping 350,000+ clinical trials showed that only 12% of the human interactome has ever been targeted by drugs. Additional sources: https://pmc.ncbi.nlm.nih.gov/articles/PMC10749231/
.
78.
WHO. ICD-10 code count ( 14,000).
WHO https://icd.who.int/browse10/2019/en (2019)
The ICD-10 classification contains approximately 14,000 codes for diseases, signs and symptoms. Additional sources: https://icd.who.int/browse10/2019/en
.
79.
McFarland, M. J., Hauer, M. E. & Reuben, A.
Half of US population exposed to adverse lead levels in early childhood.
Proceedings of the National Academy of Sciences 119, e2118631119 (2022)
Leaded gasoline, used in the US from 1923 until its on-road ban in 1996, exposed more than half of the 2015 US population to adverse blood-lead levels in early childhood. The authors estimate childhood lead exposure cost the population a cumulative 824 million IQ points, an average of 2.6 points per person, rising to 5.9 points for the most-exposed 1966-1970 birth cohort.
80.
Wikipedia. Longevity escape velocity (LEV) - maximum human life extension potential.
Wikipedia: Longevity Escape Velocity https://en.wikipedia.org/wiki/Longevity_escape_velocity Longevity escape velocity: Hypothetical point where medical advances extend life expectancy faster than time passes Term coined by Aubrey de Grey (biogerontologist) in 2004 paper; concept from David Gobel (Methuselah Foundation) Current progress: Science adds 3 months to lifespan per year; LEV requires adding >1 year per year Sinclair (Harvard): "There is no biological upper limit to age" - first person to live to 150 may already be born De Grey: 50% chance of reaching LEV by mid-to-late 2030s; SENS approach = damage repair rather than slowing damage Kurzweil (2024): LEV by 2029-2035, AI will simulate biological processes to accelerate solutions George Church: LEV "in a decade or two" via age-reversal clinical trials Natural lifespan cap: 120-150 years (Jeanne Calment record: 122); engineering approach could bypass via damage repair Key mechanisms: Epigenetic reprogramming, senolytic drugs, stem cell therapy, gene therapy, AI-driven drug discovery Current record: Jeanne Calment (122 years, 164 days) - record unbroken since 1997 Note: LEV is theoretical but increasingly plausible given demonstrated age reversal in mice (109% lifespan extension) and human cells (30-year epigenetic age reversal) Additional sources: https://en.wikipedia.org/wiki/Longevity_escape_velocity | https://pmc.ncbi.nlm.nih.gov/articles/PMC423155/ | https://www.popularmechanics.com/science/a36712084/can-science-cure-death-longevity/ | https://www.diamandis.com/blog/longevity-escape-velocity
.
81.
OpenSecrets. Lobbyist statistics for washington d.c.
OpenSecrets: Lobbying in US https://en.wikipedia.org/wiki/Lobbying_in_the_United_States Registered lobbyists: Over 12,000 (some estimates); 12,281 registered (2013) Former government employees as lobbyists: 2,200+ former federal employees (1998-2004), including 273 former White House staffers, 250 former Congress members & agency heads Congressional revolving door: 43% (86 of 198) lawmakers who left 1998-2004 became lobbyists; currently 59% leaving to private sector work for lobbying/consulting firms/trade groups Executive branch: 8% were registered lobbyists at some point before/after government service Additional sources: https://en.wikipedia.org/wiki/Lobbying_in_the_United_States | https://www.opensecrets.org/revolving-door | https://www.citizen.org/article/revolving-congress/ | https://www.propublica.org/article/we-found-a-staggering-281-lobbyists-whove-worked-in-the-trump-administration
.
82.
MDPI Vaccines. Measles vaccination ROI.
MDPI Vaccines https://www.mdpi.com/2076-393X/12/11/1210 (2024)
Single measles vaccination: 167:1 benefit-cost ratio. MMR (measles-mumps-rubella) vaccination: 14:1 ROI. Historical US elimination efforts (1966-1974): benefit-cost ratio of 10.3:1 with net benefits exceeding USD 1.1 billion (1972 dollars, or USD 8.0 billion in 2023 dollars). 2-dose MMR programs show direct benefit/cost ratio of 14.2 with net savings of $5.3 billion, and 26.0 from societal perspectives with net savings of $11.6 billion. Additional sources: https://www.mdpi.com/2076-393X/12/11/1210 | https://www.tandfonline.com/doi/full/10.1080/14760584.2024.2367451
.
86.
U.S. Government Accountability Office.
Electronic Health Records: First Year of CMS’s Incentive Programs Shows Opportunities to Improve Processes to Verify Providers Met Requirements.
https://www.gao.gov/products/gao-12-481 (2012).
92.
Calculated from Orphanet Journal of Rare Diseases (2024). Diseases getting first effective treatment each year.
Calculated from Orphanet Journal of Rare Diseases (2024) https://ojrd.biomedcentral.com/articles/10.1186/s13023-024-03398-1 (2024)
Under the current system, approximately 10-15 diseases per year receive their FIRST effective treatment. Calculation: 5% of 7,000 rare diseases ( 350) have FDA-approved treatment, accumulated over 40 years of the Orphan Drug Act = 9 rare diseases/year. Adding 5-10 non-rare diseases that get first treatments yields 10-20 total. FDA approves 50 drugs/year, but many are for diseases that already have treatments (me-too drugs, second-line therapies). Only 15 represent truly FIRST treatments for previously untreatable conditions.
93.
NIH. NIH budget (FY 2025).
NIH https://www.nih.gov/about-nih/organization/budget (2024)
The budget total of $47.7 billion also includes $1.412 billion derived from PHS Evaluation financing... Additional sources: https://www.nih.gov/about-nih/organization/budget | https://officeofbudget.od.nih.gov/
.
94.
Bentley et al. NIH spending on clinical trials: 3.3%.
Bentley et al. https://pmc.ncbi.nlm.nih.gov/articles/PMC10349341/ (2023)
NIH spent $8.1 billion on clinical trials for approved drugs (2010-2019), representing 3.3% of relevant NIH spending. Additional sources: https://pmc.ncbi.nlm.nih.gov/articles/PMC10349341/ | https://catalyst.harvard.edu/news/article/nih-spent-8-1b-for-phased-clinical-trials-of-drugs-approved-2010-19-10-of-reported-industry-spending/
.
95.
PMC. Standard medical research ROI ($20k-$100k/QALY).
PMC: Cost-effectiveness Thresholds Used by Study Authors https://pmc.ncbi.nlm.nih.gov/articles/PMC10114019/ (1990)
Typical cost-effectiveness thresholds for medical interventions in rich countries range from $50,000 to $150,000 per QALY. The Institute for Clinical and Economic Review (ICER) uses a $100,000-$150,000/QALY threshold for value-based pricing. Between 1990-2021, authors increasingly cited $100,000 (47% by 2020-21) or $150,000 (24% by 2020-21) per QALY as benchmarks for cost-effectiveness. Additional sources: https://pmc.ncbi.nlm.nih.gov/articles/PMC10114019/ | https://icer.org/our-approach/methods-process/cost-effectiveness-the-qaly-and-the-evlyg/
.
96.
Xia et al., Nature Food. Nuclear winter famine.
Xia et al. https://www.nature.com/articles/s43016-022-00573-0 (2022)
We estimate that a nuclear war between the United States and Russia would produce 150 Tg of soot and lead to 5 billion people dying at the end of year 2. Additional sources: https://www.nature.com/articles/s43016-022-00573-0
.
97.
Manhattan Institute. RECOVERY trial 82× cost reduction.
Manhattan Institute: Slow Costly Trials https://manhattan.institute/article/slow-costly-clinical-trials-drag-down-biomedical-breakthroughs RECOVERY trial: $500 per patient ($20M for 48,000 patients = $417/patient) Typical clinical trial: $41,000 median per-patient cost Cost reduction: 80-82× cheaper ($41,000 ÷ $500 ≈ 82×) Efficiency: $50 per patient per answer (10 therapeutics tested, 4 effective) Dexamethasone estimated to save >630,000 lives Additional sources: https://manhattan.institute/article/slow-costly-clinical-trials-drag-down-biomedical-breakthroughs | https://pmc.ncbi.nlm.nih.gov/articles/PMC9293394/
.
98.
Trials. Patient willingness to participate in clinical trials.
Trials: Patients’ Willingness Survey https://trialsjournal.biomedcentral.com/articles/10.1186/s13063-015-1105-3 Recent surveys: 49-51% willingness (2020-2022) - dramatic drop from 85% (2019) during COVID-19 pandemic Cancer patients when approached: 88% consented to trials (Royal Marsden Hospital) Study type variation: 44.8% willing for drug trial, 76.2% for diagnostic study Top motivation: "Learning more about my health/medical condition" (67.4%) Top barrier: "Worry about experiencing side effects" (52.6%) Additional sources: https://trialsjournal.biomedcentral.com/articles/10.1186/s13063-015-1105-3 | https://www.appliedclinicaltrialsonline.com/view/industry-forced-to-rethink-patient-participation-in-trials | https://pmc.ncbi.nlm.nih.gov/articles/PMC7183682/
.
99.
The Commune. Pentagon audit failures ($2.46T unaccounted).
The Commune https://thecommunemag.com/the-pentagon-misplaced-2-46-trillion-an-in-depth-look-at-the-financial-audit-failures (2024)
In the most recent audit, the Department of Defense (DoD) could not account for approximately 60% of its \(4.1 trillion in assets, amounting to\)2.46 trillion unaccounted for. Alternative title: Pentagon unsupported accounting adjustments (\(6.5T, single year, US Army) In 2015, the Department of Defense's Inspector General reported that the Army could not adequately support\)6.5 trillion in year-end adjustments, indicating severe accounting discrepancies. Additional sources: https://thecommunemag.com/the-pentagon-misplaced-2-46-trillion-an-in-depth-look-at-the-financial-audit-failures | https://accmag.com/audit-pentagon-cannot-account-for-6-5-trillion-dollars-is-taxpayer-money/
.
100.
Tufts CSDD. Cost of drug development.
Various estimates suggest $1.0 - $2.5 billion to bring a new drug from discovery through FDA approval, spread across 10 years. Tufts Center for the Study of Drug Development often cited for $1.0 - $2.6 billion/drug. Industry reports (IQVIA, Deloitte) also highlight $2+ billion figures.
101.
Value in Health. Average lifetime revenue per successful drug.
Value in Health: Sales Revenues for New Therapeutic Agents https://www.sciencedirect.com/science/article/pii/S1098301524027542 Study of 361 FDA-approved drugs from 1995-2014 (median follow-up 13.2 years): Mean lifetime revenue: $15.2 billion per drug Median lifetime revenue: $6.7 billion per drug Revenue after 5 years: $3.2 billion (mean) Revenue after 10 years: $9.5 billion (mean) Revenue after 15 years: $19.2 billion (mean) Distribution highly skewed: top 25 drugs (7%) accounted for 38% of total revenue ($2.1T of $5.5T) Additional sources: https://www.sciencedirect.com/science/article/pii/S1098301524027542
.
102.
Lichtenberg, F. R.
How many life-years have new drugs saved? A three-way fixed-effects analysis of 66 diseases in 27 countries, 2000-2013.
International Health 11, 403–416 (2019)
Using 3-way fixed-effects methodology (disease-country-year) across 66 diseases in 22 countries, this study estimates that drugs launched after 1981 saved 148.7 million life-years in 2013 alone. The regression coefficients for drug launches 0-11 years prior (beta=-0.031, SE=0.008) and 12+ years prior (beta=-0.057, SE=0.013) on years of life lost are highly significant (p<0.0001). Confidence interval for life-years saved: 79.4M-239.8M (95 percent CI) based on propagated standard errors from Table 2.
103.
Deloitte. Pharmaceutical r&d return on investment (ROI).
Deloitte: Measuring Pharmaceutical Innovation 2025 https://www.deloitte.com/ch/en/Industries/life-sciences-health-care/research/measuring-return-from-pharmaceutical-innovation.html (2025)
Deloitte’s annual study of top 20 pharma companies by R&D spend (2010-2024): 2024 ROI: 5.9% (second year of growth after decade of decline) 2023 ROI: 4.3% (estimated from trend) 2022 ROI: 1.2% (historic low since study began, 13-year low) 2021 ROI: 6.8% (record high, inflated by COVID-19 vaccines/treatments) Long-term trend: Declining for over a decade before 2023 recovery Average R&D cost per asset: $2.3B (2022), $2.23B (2024) These returns (1.2-5.9% range) fall far below typical corporate ROI targets (15-20%) Additional sources: https://www.deloitte.com/ch/en/Industries/life-sciences-health-care/research/measuring-return-from-pharmaceutical-innovation.html | https://www.prnewswire.com/news-releases/deloittes-13th-annual-pharmaceutical-innovation-report-pharma-rd-return-on-investment-falls-in-post-pandemic-market-301738807.html | https://hitconsultant.net/2023/02/16/pharma-rd-roi-falls-to-lowest-level-in-13-years/
.
104.
Nature Reviews Drug Discovery. Drug trial success rate from phase i to approval.
Nature Reviews Drug Discovery: Clinical Success Rates https://www.nature.com/articles/nrd.2016.136 (2016)
Overall Phase I to approval: 10-12.8% (conventional wisdom 10%, studies show 12.8%) Recent decline: Average LOA now 6.7% for Phase I (2014-2023 data) Leading pharma companies: 14.3% average LOA (range 8-23%) Varies by therapeutic area: Oncology 3.4%, CNS/cardiovascular lowest at Phase III Phase-specific success: Phase I 47-54%, Phase II 28-34%, Phase III 55-70% Note: 12% figure accurate for historical average. Recent data shows decline to 6.7%, with Phase II as primary attrition point (28% success) Additional sources: https://www.nature.com/articles/nrd.2016.136 | https://pmc.ncbi.nlm.nih.gov/articles/PMC6409418/ | https://academic.oup.com/biostatistics/article/20/2/273/4817524
.
105.
SofproMed. Phase 3 cost per trial range.
SofproMed https://www.sofpromed.com/how-much-does-a-clinical-trial-cost Phase 3 clinical trials cost between $20 million and $282 million per trial, with significant variation by therapeutic area and trial complexity. Additional sources: https://www.sofpromed.com/how-much-does-a-clinical-trial-cost | https://www.cbo.gov/publication/57126
.
106.
Ramsberg, J. & Platt, R. Pragmatic trial cost per patient (median $97).
Learning Health Systems https://pmc.ncbi.nlm.nih.gov/articles/PMC6508852/ (2018)
Meta-analysis of 108 embedded pragmatic clinical trials (2006-2016). The median cost per patient was $97 (IQR $19–$478), based on 2015 dollars. 25% of trials cost <$19/patient; 10 trials exceeded $1,000/patient. U.S. studies median $187 vs non-U.S. median $27. Additional sources: https://pmc.ncbi.nlm.nih.gov/articles/PMC6508852/
.
107.
WHO. Polio vaccination ROI.
WHO https://www.who.int/news-room/feature-stories/detail/sustaining-polio-investments-offers-a-high-return (2019)
For every dollar spent, the return on investment is nearly US$ 39." Total investment cost of US$ 7.5 billion generates projected economic and social benefits of US$ 289.2 billion from sustaining polio assets and integrating them into expanded immunization, surveillance and emergency response programmes across 8 priority countries (Afghanistan, Iraq, Libya, Pakistan, Somalia, Sudan, Syria, Yemen). Additional sources: https://www.who.int/news-room/feature-stories/detail/sustaining-polio-investments-offers-a-high-return
.
108.
ICRC. International campaign to ban landmines (ICBL) - ottawa treaty (1997).
ICRC https://www.icrc.org/en/doc/resources/documents/article/other/57jpjn.htm (1997)
ICBL: Founded 1992 by 6 NGOs (Handicap International, Human Rights Watch, Medico International, Mines Advisory Group, Physicians for Human Rights, Vietnam Veterans of America Foundation) Started with ONE staff member: Jody Williams as founding coordinator Grew to 1,000+ organizations in 60 countries by 1997 Ottawa Process: 14 months (October 1996 - December 1997) Convention signed by 122 states on December 3, 1997; entered into force March 1, 1999 Achievement: Nobel Peace Prize 1997 (shared by ICBL and Jody Williams) Government funding context: Canada established $100M CAD Canadian Landmine Fund over 10 years (1997); International donors provided $169M in 1997 for mine action (up from $100M in 1996) Additional sources: https://www.icrc.org/en/doc/resources/documents/article/other/57jpjn.htm | https://en.wikipedia.org/wiki/International_Campaign_to_Ban_Landmines | https://www.nobelprize.org/prizes/peace/1997/summary/ | https://un.org/press/en/1999/19990520.MINES.BRF.html | https://www.the-monitor.org/en-gb/reports/2003/landmine-monitor-2003/mine-action-funding.aspx
.
109.
OpenSecrets.
Revolving door: Former members of congress. (2024)
388 former members of Congress are registered as lobbyists. Nearly 5,400 former congressional staffers have left Capitol Hill to become federal lobbyists in the past 10 years. Additional sources: https://www.opensecrets.org/revolving-door
.
110.
Kinch, M. S. & Griesenauer, R. H.
Lost medicines: A longer view of the pharmaceutical industry with the potential to reinvigorate discovery.
Drug Discovery Today 24, 875–880 (2019)
Research identified 1,600+ medicines available in 1962. The 1950s represented industry high-water mark with >30 new products in five of ten years; this rate would not be replicated until late 1990s. More than half (880) of these medicines were lost following implementation of Kefauver-Harris Amendment. The peak of 1962 would not be seen again until early 21st century. By 2016 number of organizations actively involved in R&D at level not seen since 1914.
111.
Baily, M. N. Pre-1962 drug development costs (baily 1972).
Baily (1972) https://samizdathealth.org/wp-content/uploads/2020/12/hlthaff.1.2.6.pdf (1972)
Pre-1962: Average cost per new chemical entity (NCE) was $6.5 million (1980 dollars) Inflation-adjusted to 2024 dollars: $6.5M (1980) ≈ $22.5M (2024), using CPI multiplier of 3.46× Real cost increase (inflation-adjusted): $22.5M (pre-1962) → $2,600M (2024) = 116× increase Note: This represents the most comprehensive academic estimate of pre-1962 drug development costs based on empirical industry data Additional sources: https://samizdathealth.org/wp-content/uploads/2020/12/hlthaff.1.2.6.pdf
.
112.
Think by Numbers. Pre-1962 physician-led clinical trials.
Think by Numbers: How Many Lives Does FDA Save? https://thinkbynumbers.org/health/how-many-net-lives-does-the-fda-save/ (1966)
Pre-1962: Physicians could report real-world evidence directly 1962 Drug Amendments replaced "premarket notification" with "premarket approval", requiring extensive efficacy testing Impact: New regulatory clampdown reduced new treatment production by 70%; lifespan growth declined from 4 years/decade to 2 years/decade Drug Efficacy Study Implementation (DESI): NAS/NRC evaluated 3,400+ drugs approved 1938-1962 for safety only; reviewed >3,000 products, >16,000 therapeutic claims FDA has had authority to accept real-world evidence since 1962, clarified by 21st Century Cures Act (2016) Note: Specific "144,000 physicians" figure not verified in sources Additional sources: https://thinkbynumbers.org/health/how-many-net-lives-does-the-fda-save/ | https://www.fda.gov/drugs/enforcement-activities-fda/drug-efficacy-study-implementation-desi | http://www.nasonline.org/about-nas/history/archives/collections/des-1966-1969-1.html
.
113.
GAO. 95% of diseases have 0 FDA-approved treatments.
GAO https://www.gao.gov/products/gao-25-106774 (2025)
95% of diseases have no treatment Additional sources: https://www.gao.gov/products/gao-25-106774 | https://globalgenes.org/rare-disease-facts/
.
115.
NHS England; Águas et al. RECOVERY trial global lives saved ( 1 million).
NHS England: 1 Million Lives Saved https://www.england.nhs.uk/2021/03/covid-treatment-developed-in-the-nhs-saves-a-million-lives/ (2021)
Dexamethasone saved 1 million lives worldwide (NHS England estimate, March 2021, 9 months after discovery). UK alone: 22,000 lives saved. Methodology: Águas et al. Nature Communications 2021 estimated 650,000 lives (range: 240,000-1,400,000) for July-December 2020 alone, based on RECOVERY trial mortality reductions (36% for ventilated, 18% for oxygen-only patients) applied to global COVID hospitalizations. June 2020 announcement: Dexamethasone reduced deaths by up to 1/3 (ventilated patients), 1/5 (oxygen patients). Impact immediate: Adopted into standard care globally within hours of announcement. Additional sources: https://www.england.nhs.uk/2021/03/covid-treatment-developed-in-the-nhs-saves-a-million-lives/ | https://www.nature.com/articles/s41467-021-21134-2 | https://pharmaceutical-journal.com/article/news/steroid-has-saved-the-lives-of-one-million-covid-19-patients-worldwide-figures-show | https://www.recoverytrial.net/news/recovery-trial-celebrates-two-year-anniversary-of-life-saving-dexamethasone-result
.
118.
National September 11 Memorial & Museum.
September 11 attack facts. (2024)
2,977 people were killed in the September 11, 2001 attacks: 2,753 at the World Trade Center, 184 at the Pentagon, and 40 passengers and crew on United Flight 93 in Shanksville, Pennsylvania.
119.
World Bank. World bank singapore economic data.
World Bank https://data.worldbank.org/country/singapore (2024)
Singapore GDP per capita (2023): $82,000 - among highest in the world Government spending: 15% of GDP (vs US 38%) Life expectancy: 84.1 years (vs US 77.5 years) Singapore demonstrates that low government spending can coexist with excellent outcomes Additional sources: https://data.worldbank.org/country/singapore
.
120.
International Monetary Fund.
IMF singapore government spending data. (2024)
Singapore government spending is approximately 15% of GDP This is 23 percentage points lower than the United States (38%) Despite lower spending, Singapore achieves excellent outcomes: - Life expectancy: 84.1 years (vs US 77.5) - Low crime, world-class infrastructure, AAA credit rating Additional sources: https://www.imf.org/en/Countries/SGP
.
121.
World Health Organization.
WHO life expectancy data by country. (2024)
Life expectancy at birth varies significantly among developed nations: Switzerland: 84.0 years (2023) Singapore: 84.1 years (2023) Japan: 84.3 years (2023) United States: 77.5 years (2023) - 6.5 years below Switzerland, Singapore Global average: 73 years Note: US spends more per capita on healthcare than any other nation, yet achieves lower life expectancy Additional sources: https://www.who.int/data/gho/data/themes/mortality-and-global-health-estimates/ghe-life-expectancy-and-healthy-life-expectancy
.
123.
PMC. Contribution of smoking reduction to life expectancy gains.
PMC: Benefits Smoking Cessation Longevity https://www.ncbi.nlm.nih.gov/pmc/articles/PMC1447499/ (2012)
Population-level: Up to 14% (9% men, 14% women) of total life expectancy gain since 1960 due to tobacco control efforts Individual cessation benefits: Quitting at age 35 adds 6.9-8.5 years (men), 6.1-7.7 years (women) vs continuing smokers By cessation age: Age 25-34 = 10 years gained; age 35-44 = 9 years; age 45-54 = 6 years; age 65 = 2.0 years (men), 3.7 years (women) Cessation before age 40: Reduces death risk by 90% Long-term cessation: 10+ years yields survival comparable to never smokers, averts 10 years of life lost Recent cessation: <3 years averts 5 years of life lost Additional sources: https://www.ncbi.nlm.nih.gov/pmc/articles/PMC1447499/ | https://www.cdc.gov/pcd/issues/2012/11_0295.htm | https://www.ajpmonline.org/article/S0749-3797(24)00217-4/fulltext | https://www.nejm.org/doi/full/10.1056/NEJMsa1211128
.
124.
ICER. Value per QALY (standard economic value).
ICER https://icer.org/wp-content/uploads/2024/02/Reference-Case-4.3.25.pdf (2024)
Standard economic value per QALY: $100,000–$150,000. This is the US and global standard willingness-to-pay threshold for interventions that add costs. Dominant interventions (those that save money while improving health) are favorable regardless of this threshold. Additional sources: https://icer.org/wp-content/uploads/2024/02/Reference-Case-4.3.25.pdf
.
125.
GAO. Annual cost of u.s. Sugar subsidies.
GAO: Sugar Program https://www.gao.gov/products/gao-24-106144 Consumer costs: $2.5-3.5 billion per year (GAO estimate) Net economic cost: $1 billion per year 2022: US consumers paid 2X world price for sugar Program costs $3-4 billion/year but no federal budget impact (costs passed directly to consumers via higher prices) Employment impact: 10,000-20,000 manufacturing jobs lost annually in sugar-reliant industries (confectionery, etc.) Multiple studies confirm: Sweetener Users Association ($2.9-3.5B), AEI ($2.4B consumer cost), Beghin & Elobeid ($2.9-3.5B consumer surplus) Additional sources: https://www.gao.gov/products/gao-24-106144 | https://www.heritage.org/agriculture/report/the-us-sugar-program-bad-consumers-bad-agriculture-and-bad-america | https://www.aei.org/articles/the-u-s-spends-4-billion-a-year-subsidizing-stalinist-style-domestic-sugar-production/
.
126.
World Bank. Swiss military budget as percentage of GDP.
World Bank: Military Expenditure https://data.worldbank.org/indicator/MS.MIL.XPND.GD.ZS?locations=CH 2023: 0.70272% of GDP (World Bank) 2024: CHF 5.95 billion official military spending When including militia system costs: 1% GDP (CHF 8.75B) Comparison: Near bottom in Europe; only Ireland, Malta, Moldova spend less (excluding microstates with no armies) Additional sources: https://data.worldbank.org/indicator/MS.MIL.XPND.GD.ZS?locations=CH | https://www.avenir-suisse.ch/en/blog-defence-spending-switzerland-is-in-better-shape-than-it-seems/ | https://tradingeconomics.com/switzerland/military-expenditure-percent-of-gdp-wb-data.html
.
127.
World Bank. Switzerland vs. US GDP per capita comparison.
World Bank: Switzerland GDP Per Capita https://data.worldbank.org/indicator/NY.GDP.PCAP.CD?locations=CH 2024 GDP per capita (PPP-adjusted): Switzerland $93,819 vs United States $75,492 Switzerland’s GDP per capita 24% higher than US when adjusted for purchasing power parity Nominal 2024: Switzerland $103,670 vs US $85,810 Additional sources: https://data.worldbank.org/indicator/NY.GDP.PCAP.CD?locations=CH | https://tradingeconomics.com/switzerland/gdp-per-capita-ppp | https://www.theglobaleconomy.com/USA/gdp_per_capita_ppp/
.
128.
OECD.
OECD government spending as percentage of GDP. (2024)
OECD government spending data shows significant variation among developed nations: United States: 38.0% of GDP (2023) Switzerland: 35.0% of GDP - 3 percentage points lower than US Singapore: 15.0% of GDP - 23 percentage points lower than US (per IMF data) OECD average: approximately 40% of GDP Additional sources: https://data.oecd.org/gga/general-government-spending.htm
.
129.
OECD.
OECD median household income comparison. (2024)
Median household disposable income varies significantly across OECD nations: United States: $77,500 (2023) Switzerland: $55,000 PPP-adjusted (lower nominal but comparable purchasing power) Singapore: $75,000 PPP-adjusted Additional sources: https://data.oecd.org/hha/household-disposable-income.htm
.
130.
Wikipedia. Thalidomide scandal: Worldwide cases and mortality.
Wikipedia https://en.wikipedia.org/wiki/Thalidomide_scandal The total number of embryos affected by the use of thalidomide during pregnancy is estimated at 10,000, of whom about 40% died around the time of birth. More than 10,000 children in 46 countries were born with deformities such as phocomelia. Additional sources: https://en.wikipedia.org/wiki/Thalidomide_scandal
.
131.
PLOS One. Health and quality of life of thalidomide survivors as they age.
PLOS One https://journals.plos.org/plosone/article?id=10.1371/journal.pone.0210222 (2019)
Study of thalidomide survivors documenting ongoing disability impacts, quality of life, and long-term health outcomes. Survivors (now in their 60s) continue to experience significant disability from limb deformities, organ damage, and other effects. Additional sources: https://journals.plos.org/plosone/article?id=10.1371/journal.pone.0210222
.
133.
FDA Study via NCBI. Trial costs, FDA study.
FDA Study via NCBI https://www.ncbi.nlm.nih.gov/pmc/articles/PMC6248200/ Overall, the 138 clinical trials had an estimated median (IQR) cost of $19.0 million ($12.2 million-$33.1 million)... The clinical trials cost a median (IQR) of $41,117 ($31,802-$82,362) per patient. Additional sources: https://www.ncbi.nlm.nih.gov/pmc/articles/PMC6248200/
.
134.
GBD 2019 Diseases and Injuries Collaborators.
Global burden of disease study 2019: Disability weights.
The Lancet 396, 1204–1222 (2020)
Disability weights for 235 health states used in Global Burden of Disease calculations. Weights range from 0 (perfect health) to 1 (death equivalent). Chronic conditions like diabetes (0.05-0.35), COPD (0.04-0.41), depression (0.15-0.66), and cardiovascular disease (0.04-0.57) show substantial variation by severity. Treatment typically reduces disability weights by 50-80 percent for manageable chronic conditions.
135.
WHO. Annual global economic burden of alzheimer’s and other dementias.
WHO: Dementia Fact Sheet https://www.who.int/news-room/fact-sheets/detail/dementia (2019)
Global cost: $1.3 trillion (2019 WHO-commissioned study) 50% from informal caregivers (family/friends, 5 hrs/day) 74% of costs in high-income countries despite 61% of patients in LMICs $818B (2010) → $1T (2018) → $1.3T (2019) - rapid growth Note: Costs increased 35% from 2010-2015 alone. Informal care represents massive hidden economic burden Additional sources: https://www.who.int/news-room/fact-sheets/detail/dementia | https://alz-journals.onlinelibrary.wiley.com/doi/10.1002/alz.12901
.
136.
JAMA Oncology. Annual global economic burden of cancer.
JAMA Oncology: Global Cost 2020-2050 https://jamanetwork.com/journals/jamaoncology/fullarticle/2801798 (2020)
2020-2050 projection: $25.2 trillion total ($840B/year average) 2010 annual cost: $1.16 trillion (direct costs only) Recent estimate: $3 trillion/year (all costs included) Top 5 cancers: lung (15.4%), colon/rectum (10.9%), breast (7.7%), liver (6.5%), leukemia (6.3%) Note: China/US account for 45% of global burden; 75% of deaths in LMICs but only 50.0% of economic cost Additional sources: https://jamanetwork.com/journals/jamaoncology/fullarticle/2801798 | https://www.nature.com/articles/d41586-023-00634-9
.
138.
Diabetes Care. Annual global economic burden of diabetes.
Diabetes Care: Global Economic Burden https://diabetesjournals.org/care/article/41/5/963/36522/Global-Economic-Burden-of-Diabetes-in-Adults 2015: $1.3 trillion (1.8% of global GDP) 2030 projections: $2.1T-2.5T depending on scenario IDF health expenditure: $760B (2019) → $845B (2045 projected) 2/3 direct medical costs ($857B), 1/3 indirect costs (lost productivity) Note: Costs growing rapidly; expected to exceed $2T by 2030 Additional sources: https://diabetesjournals.org/care/article/41/5/963/36522/Global-Economic-Burden-of-Diabetes-in-Adults | https://doi.org/10.1016/S2213-8587(17)30097-9
.
140.
World Bank, Bureau of Economic Analysis. US GDP 2024 ($28.78 trillion).
World Bank https://data.worldbank.org/indicator/NY.GDP.MKTP.CD?locations=US (2024)
US GDP reached $28.78 trillion in 2024, representing approximately 26% of global GDP. Additional sources: https://data.worldbank.org/indicator/NY.GDP.MKTP.CD?locations=US | https://www.bea.gov/news/2024/gross-domestic-product-fourth-quarter-and-year-2024-advance-estimate
.
141.
Environmental Working Group. US farm subsidy database and analysis.
Environmental Working Group https://farm.ewg.org/ (2024)
US agricultural subsidies total approximately $30 billion annually, but create much larger economic distortions. Top 10% of farms receive 78% of subsidies, benefits concentrated in commodity crops (corn, soy, wheat, cotton), environmental damage from monoculture incentivized, and overall deadweight loss estimated at $50-120 billion annually. Additional sources: https://farm.ewg.org/ | https://www.ers.usda.gov/topics/farm-economy/farm-sector-income-finances/government-payments-the-safety-net/
.
142.
Drug Policy Alliance.
The drug war by the numbers. (2021)
Since 1971, the war on drugs has cost the United States an estimated $1 trillion in enforcement. The federal drug control budget was $41 billion in 2022. Mass incarceration costs the U.S. at least $182 billion every year, with over $450 billion spent to incarcerate individuals on drug charges in federal prisons.
143.
International Monetary Fund.
IMF fossil fuel subsidies data: 2023 update. (2023)
Globally, fossil fuel subsidies were $7 trillion in 2022 or 7.1 percent of GDP. The United States subsidies totaled $649 billion. Underpricing for local air pollution costs and climate damages are the largest contributor, accounting for about 30 percent each.
144.
Papanicolas, Irene et al. Health care spending in the united states and other high-income countries.
Papanicolas et al. https://jamanetwork.com/journals/jama/article-abstract/2674671 (2018)
The US spent approximately twice as much as other high-income countries on medical care (mean per capita: $9,892 vs $5,289), with similar utilization but much higher prices. Administrative costs accounted for 8% of US spending vs 1-3% in other countries. US spending on pharmaceuticals was $1,443 per capita vs $749 elsewhere. Despite spending more, US health outcomes are not better. Additional sources: https://jamanetwork.com/journals/jama/article-abstract/2674671
.
145.
Hsieh, C.-T. & Moretti, E. Housing constraints and spatial misallocation.
American Economic Journal: Macroeconomics https://www.aeaweb.org/articles?id=10.1257/mac.20170388 (2019)
We quantify the amount of spatial misallocation of labor across US cities and its aggregate costs. Tight land-use restrictions in high-productivity cities like New York, San Francisco, and Boston lowered aggregate US growth by 36% from 1964 to 2009. Local constraints on housing supply have had enormous effects on the national economy. Additional sources: https://www.aeaweb.org/articles?id=10.1257/mac.20170388
.
147.
Tax Foundation. Tax compliance costs the US economy $546 billion annually.
https://taxfoundation.org/data/all/federal/irs-tax-compliance-costs/ (2024)
Americans will spend over 7.9 billion hours complying with IRS tax filing and reporting requirements in 2024. This costs the economy roughly $413 billion in lost productivity. In addition, the IRS estimates that Americans spend roughly $133 billion annually in out-of-pocket costs, bringing the total compliance costs to $546 billion, or nearly 2 percent of GDP.
148.
Cook, C., Cole, G., Asaria, P., Jabbour, R. & Francis, D. P. Annual global economic burden of heart disease.
International Journal of Cardiology https://www.internationaljournalofcardiology.com/article/S0167-5273(13)02238-9/abstract (2014)
Heart failure alone: $108 billion/year (2012 global analysis, 197 countries) US CVD: $555B (2016) → projected $1.8T by 2050 LMICs total CVD loss: $3.7T cumulative (2011-2015, 5-year period) CVD is costliest disease category in most developed nations Note: No single $2.1T global figure found; estimates vary widely by scope and year Additional sources: https://www.ahajournals.org/doi/10.1161/CIR.0000000000001258
.
149.
Source: US Life Expectancy FDA Budget 1543-2019 CSV.
US life expectancy growth 1880-1960: 3.82 years per decade. (2019)
Pre-1962: 3.82 years/decade Post-1962: 1.54 years/decade Reduction: 60% decline in life expectancy growth rate Additional sources: https://ourworldindata.org/life-expectancy | https://www.mortality.org/ | https://www.cdc.gov/nchs/nvss/mortality_tables.htm
.
150.
Source: US Life Expectancy FDA Budget 1543-2019 CSV.
Post-1962 slowdown in life expectancy gains. (2019)
Pre-1962 (1880-1960): 3.82 years/decade Post-1962 (1962-2019): 1.54 years/decade Reduction: 60% decline Temporal correlation: Slowdown occurred immediately after 1962 Kefauver-Harris Amendment Additional sources: https://ourworldindata.org/life-expectancy | https://www.mortality.org/ | https://www.cdc.gov/nchs/nvss/mortality_tables.htm
.
151.
Centers for Disease Control and Prevention.
US life expectancy 2023. (2024)
US life expectancy at birth was 77.5 years in 2023 Male life expectancy: 74.8 years Female life expectancy: 80.2 years This is 6-7 years lower than peer developed nations despite higher healthcare spending Additional sources: https://www.cdc.gov/nchs/fastats/life-expectancy.htm
.
152.
US Census Bureau.
US median household income 2023. (2024)
US median household income was $77,500 in 2023 Real median household income declined 0.8% from 2022 Gini index: 0.467 (income inequality measure) Additional sources: https://www.census.gov/library/publications/2024/demo/p60-282.html
.
153.
Manuel, D. U.s. Defense spending history: 100 years of military budgets.
DaveManuel.com https://www.davemanuel.com/us-defense-spending-history-military-budget-data.php (2025)
US military spending in constant 2024 dollars: 1939 $29B (pre-WW2 baseline), 1940 $37B, 1944 $1,383B, 1945 $1,420B (peak), 1946 $674B, 1947 $176B, 1948 $117B, 2024 $886B. The post-WW2 demobilization cut spending 88% in two years (1945-1947). Current peacetime spending ($886B) is 30x the pre-WW2 baseline and 62% of peak WW2 spending, in inflation-adjusted dollars.
154.
Statista. US military budget as percentage of GDP.
Statista https://www.statista.com/statistics/262742/countries-with-the-highest-military-spending/ (2024)
U.S. military spending amounted to 3.5% of GDP in 2024. In 2024, the U.S. spent nearly $1 trillion on its military budget, equal to 3.4% of GDP. Additional sources: https://www.statista.com/statistics/262742/countries-with-the-highest-military-spending/ | https://www.sipri.org/sites/default/files/2025-04/2504_fs_milex_2024.pdf
.
155.
US Census Bureau. Number of registered or eligible voters in the u.s.
US Census Bureau https://www.census.gov/newsroom/press-releases/2025/2024-presidential-election-voting-registration-tables.html (2024)
73.6% (or 174 million people) of the citizen voting-age population was registered to vote in 2024 (Census Bureau). More than 211 million citizens were active registered voters (86.6% of citizen voting age population) according to the Election Assistance Commission. Additional sources: https://www.census.gov/newsroom/press-releases/2025/2024-presidential-election-voting-registration-tables.html | https://www.eac.gov/news/2025/06/30/us-election-assistance-commission-releases-2024-election-administration-and-voting
.
156.
U.S. Senate. Treaties.
U.S. Senate https://www.senate.gov/about/powers-procedures/treaties.htm The Constitution provides that the president ’shall have Power, by and with the Advice and Consent of the Senate, to make Treaties, provided two-thirds of the Senators present concur’ (Article II, section 2). Treaties are formal agreements with foreign nations that require two-thirds Senate approval. 67 senators (two-thirds of 100) must vote to ratify a treaty for it to take effect. Additional sources: https://www.senate.gov/about/powers-procedures/treaties.htm
.
157.
Federal Election Commission.
Statistical summary of 24-month campaign activity of the 2023-2024 election cycle. (2023)
Presidential candidates raised $2 billion; House and Senate candidates raised $3.8 billion and spent $3.7 billion; PACs raised $15.7 billion and spent $15.5 billion. Total federal campaign spending approximately $20 billion. Additional sources: https://www.fec.gov/updates/statistical-summary-of-24-month-campaign-activity-of-the-2023-2024-election-cycle/
.
158.
OpenSecrets.
Federal lobbying hit record $4.4 billion in 2024. (2024)
Total federal lobbying reached record $4.4 billion in 2024. The $150 million increase in lobbying continues an upward trend that began in 2016. Additional sources: https://www.opensecrets.org/news/2025/02/federal-lobbying-set-new-record-in-2024/
.
159.
Columbia/NBER. Odds of a single vote being decisive in a u.s. Presidential election.
Columbia/NBER: What Is the Probability Your Vote Will Make a Difference? https://sites.stat.columbia.edu/gelman/research/published/probdecisive2.pdf (2012)
National average: 1 in 60 million chance (2008 election analysis by Gelman, Silver, Edlin) Swing states (NM, VA, NH, CO): 1 in 10 million chance Non-competitive states: 34 states >1 in 100 million odds; 20 states >1 in 1 billion Washington DC: 1 in 490 billion odds Methodology: Probability state is necessary for electoral college win × probability state vote is tied Additional sources: https://sites.stat.columbia.edu/gelman/research/published/probdecisive2.pdf | https://onlinelibrary.wiley.com/doi/abs/10.1111/j.1465-7295.2010.00272.x
.
160.
Hutchinson and Kirk.
Valley of death in drug development. (2011)
The overall failure rate of drugs that passed into Phase 1 trials to final approval is 90%. This lack of translation from promising preclinical findings to success in human trials is known as the "valley of death." Estimated 30-50% of promising compounds never proceed to Phase 2/3 trials primarily due to funding barriers rather than scientific failure. The late-stage attrition rate for oncology drugs is as high as 70% in Phase II and 59% in Phase III trials.
161.
DOT. DOT value of statistical life ($13.6M).
DOT: VSL Guidance 2024 https://www.transportation.gov/office-policy/transportation-policy/revised-departmental-guidance-on-valuation-of-a-statistical-life-in-economic-analysis (2024)
Current VSL (2024): $13.7 million (updated from $13.6M) Used in cost-benefit analyses for transportation regulations and infrastructure Methodology updated in 2013 guidance, adjusted annually for inflation and real income VSL represents aggregate willingness to pay for safety improvements that reduce fatalities by one Note: DOT has published VSL guidance periodically since 1993. Current $13.7M reflects 2024 inflation/income adjustments Additional sources: https://www.transportation.gov/office-policy/transportation-policy/revised-departmental-guidance-on-valuation-of-a-statistical-life-in-economic-analysis | https://www.transportation.gov/regulations/economic-values-used-in-analysis
.
162.
PLOS ONE. Cost per DALY for vitamin a supplementation.
PLOS ONE: Cost-effectiveness of "Golden Mustard" for Treating Vitamin A Deficiency in India (2010) https://journals.plos.org/plosone/article?id=10.1371/journal.pone.0012046 (2010)
India: $23-$50 per DALY averted (least costly intervention, $1,000-$6,100 per death averted) Sub-Saharan Africa (2022): $220-$860 per DALY (Burkina Faso: $220, Kenya: $550, Nigeria: $860) WHO estimates for Africa: $40 per DALY for fortification, $255 for supplementation Uganda fortification: $18-$82 per DALY (oil: $18, sugar: $82) Note: Wide variation reflects differences in baseline VAD prevalence, coverage levels, and whether intervention is supplementation or fortification Additional sources: https://journals.plos.org/plosone/article?id=10.1371/journal.pone.0012046 | https://journals.plos.org/plosone/article?id=10.1371/journal.pone.0266495
.
165.
PMC. Cost-effectiveness threshold ($50,000/QALY).
PMC https://pmc.ncbi.nlm.nih.gov/articles/PMC5193154/ The $50,000/QALY threshold is widely used in US health economics literature, originating from dialysis cost benchmarks in the 1980s. In US cost-utility analyses, 77.5% of authors use either $50,000 or $100,000 per QALY as reference points. Most successful health programs cost $3,000-10,000 per QALY. WHO-CHOICE uses GDP per capita multiples (1× GDP/capita = "very cost-effective", 3× GDP/capita = "cost-effective"), which for the US ( $70,000 GDP/capita) translates to $70,000-$210,000/QALY thresholds. Additional sources: https://pmc.ncbi.nlm.nih.gov/articles/PMC5193154/ | https://pmc.ncbi.nlm.nih.gov/articles/PMC9278384/
.
166.
Integrated Benefits Institute. Chronic illness workforce productivity loss.
Integrated Benefits Institute 2024 https://www.ibiweb.org/resources/chronic-conditions-in-the-us-workforce-prevalence-trends-and-productivity-impacts (2024)
78.4% of U.S. employees have at least one chronic condition (7% increase since 2021) 58% of employees report physical chronic health conditions 28% of all employees experience productivity loss due to chronic conditions Average productivity loss: $4,798 per employee per year Employees with 3+ chronic conditions miss 7.8 days annually vs 2.2 days for those without Note: 28% productivity loss translates to roughly 11 hours per week (28% of 40-hour workweek) Additional sources: https://www.ibiweb.org/resources/chronic-conditions-in-the-us-workforce-prevalence-trends-and-productivity-impacts | https://www.onemedical.com/mediacenter/study-finds-more-than-half-of-employees-are-living-with-chronic-conditions-including-1-in-3-gen-z-and-millennial-employees/ | https://debeaumont.org/news/2025/poll-the-toll-of-chronic-health-conditions-on-employees-and-workplaces/
.
167.
Leitenberg, M.
Deaths in Wars and Conflicts in the 20th Century.
https://www.clingendael.org/sites/default/files/pdfs/20060800_cdsp_occ_leitenberg.pdf (2006)
Comprehensive accounting of deaths from wars, conflicts, genocides, and policy-induced famines in the 20th century. Central estimate: approximately 231 million people killed or allowed to die by human decision. Includes combat deaths, civilian casualties, democide, and conflict-induced famine.
168.
Our World in Data. Global armed forces size and average salary.
Our World in Data: Military Personnel & Spending https://ourworldindata.org/military-personnel-spending (2024)
Largest forces: China (2.0M active), India (1.4M), Russia (1.3M active, 3.5M total), US (1.3M active) Global military spending 2024: US $1T (next 12 countries combined); NATO 32 members: $1.5T (55% of world) Military spending per personnel: Tracked by SIPRI, World Bank (includes personnel, O&M, procurement, R&D, infrastructure, aid) Average varies widely: US military much higher per-personnel spending than most countries Note: Specific "28.4M global armed forces" and "$24,000 average salary" not confirmed in sources. Data available but highly variable by country. Major forces total 10M+ personnel among largest militaries Additional sources: https://ourworldindata.org/military-personnel-spending | https://data.worldbank.org/indicator/MS.MIL.TOTL.P1 | https://www.sipri.org/sites/default/files/2025-04/2504_fs_milex_2024.pdf
.
169.
USAFacts. NATO o&m ratios for global spending.
USAFacts: US Military Spending https://usafacts.org/articles/how-much-does-the-us-spend-on-the-military/ (2024)
Operations & Maintenance (O&M): 38-50% of military spending US FY2024: O&M cost $332B (38% of military spending), up from 28% in 1974 2005-2015 trend: O&M represented 40-50% of DoD total budget NATO 2024: $1.47T total spending across 32 member countries; US $967B (66%), European members $454B (30%) NATO equipment investment guideline: At least 20% of military expenditures for major equipment/R&D Additional sources: https://usafacts.org/articles/how-much-does-the-us-spend-on-the-military/ | https://www.cbo.gov/publication/52156 | https://www.nato.int/cps/en/natohq/topics_49198.htm | https://www.statista.com/statistics/1293301/combined-military-expenditures-nato/
.
170.
Wikipedia. Number of major global military facilities (4,435).
Wikipedia: List of American Military Installations https://en.wikipedia.org/wiki/List_of_American_military_installations US military bases worldwide: 750-877 (varies by source/definition) Conservative count: 128 military bases in 55 countries/territories (Feb 2025) Broader count: 750+ bases in 80+ countries; some sources cite 877 Large bases (>4 hectares or >$10M, >200 personnel): 439 (60% of US foreign bases) Small bases/"Lily Pads" (<4 hectares or <$10M): Remaining 40% Other nations: At least 18 other nations operate foreign military bases; NATO countries (France, UK): +200 locations Note: "4,435" not found in sources. US operates 750-877 bases overseas. May include domestic + all nations’ bases combined, but specific figure not verified Additional sources: https://en.wikipedia.org/wiki/List_of_American_military_installations | https://www.visualcapitalist.com/mapped-every-known-u-s-military-base-overseas/ | https://worldbeyondwar.org/military-empires/
.
171.
US Government Info. Intelligence spending as percentage of military budgets.
US Government Info: Cost of Intelligence https://www.govinfo.gov/content/pkg/GPO-INTELLIGENCE/html/int017.html US: Military-related budget lines (DoE, State Dept, National Intelligence Program) = 11% of US spending (2024) Intelligence funding: Grew faster than military when military spending increased; decreased slower when military spending decreased Historical trend: Intelligence funding reached level 80% above 1980 baseline US National Intelligence Program + Military Intelligence Program ≈ 10-11% of total military-related spending Additional sources: https://www.govinfo.gov/content/pkg/GPO-INTELLIGENCE/html/int017.html | https://sgp.fas.org/crs/intel/R44381.pdf | https://en.wikipedia.org/wiki/United_States_intelligence_budget
.
172.
EPA. EPA value of statistical life ($9.6M).
EPA: Mortality Risk Valuation https://www.epa.gov/environmental-economics/mortality-risk-valuation (2017)
EPA 2010 Guidelines: $7.9M (2008 dollars) → $9.7M (2013 dollars/income adjusted) Current EPA VSL: $10 million (highest among federal agencies) Based on 1997 Clean Air Act analysis; updated for inflation/income but not methodology Uses wage-risk literature (21 studies) and stated preference studies (5 studies) Used in cost-benefit analyses for environmental, health, and safety regulations Note: $9.6-9.7M represents EPA’s VSL with inflation/income adjustments. Base methodology hasn’t been updated since 1997 Additional sources: https://www.epa.gov/environmental-economics/mortality-risk-valuation | https://www.rff.org/publications/working-papers/revisiting-the-environmental-protection-agencys-value-of-statistical-life/ | https://www.epa.gov/sites/default/files/2017-12/documents/ee-0483_all.pdf
.
176.
Uppsala University. Number of armed conflicts since 1945.
Uppsala University https://ucdp.uu.se/ The AKUF dataset documents 218 wars and violent conflicts since 1945. The Uppsala Conflict Data Program (UCDP) recorded 40 armed conflicts in 2014 (highest since 1999, with 11 defined as wars). Peak year 1991 saw 51 active conflicts. Additional sources: https://ucdp.uu.se/ | https://en.wikipedia.org/wiki/Uppsala_Conflict_Data_Program
.
177.
IMF. Reconstruction costs from active conflicts.
IMF: Cost of Conflict https://www.imf.org/external/pubs/ft/fandd/2017/12/imus.htm (2017)
Individual conflict examples: Libya, Syria, Yemen $300B combined (World Bank) Syria alone: $250B-$1T estimates Ukraine: >€500B reconstruction costs Gaza: $18.5B infrastructure damage Global conflict/violence cost: $14.3T/year (2016, includes military spending, security, losses) Note: Specific "$1,875B for 47 conflicts" figure not verified in sources Additional sources: https://www.imf.org/external/pubs/ft/fandd/2017/12/imus.htm | https://www.weforum.org/stories/2018/01/conflict-costs-global-economy-14-trillion-a-year/ | https://fortune.com/2022/04/21/ukraine-reconstruction-cost-rebuild-economists-plan-russia-foot-trillion-bill/
.
179.
UNESCO. UNESCO cost for universal education coverage.
UNESCO https://news.un.org/en/story/2023/04/1135697 (2023)
The largest financing gap is in sub-Saharan Africa: $70 billion per year. An additional $77 billion is needed annually for African countries to reach their national education targets and provide quality education for all. Additional sources: https://news.un.org/en/story/2023/04/1135697 | https://unesdoc.unesco.org/ark:/48223/pf0000192186
.
181.
Global Policy Journal. World bank cost to eradicate extreme poverty.
Global Policy Journal https://www.globalpolicyjournal.com/blog/25/07/2024/new-estimates-cost-ending-poverty (2024)
Jeffrey Sachs estimated $175 billion per year for 20 years (less than 1% of combined income of richest countries). Recent UNU-WIDER research: $70B/year for extreme poverty ($2.15/day threshold) or $325B/year for absolute poverty ($3.65/day). This is only 0.1-0.6% of OECD high-income countries’ GNI. Additional sources: https://www.globalpolicyjournal.com/blog/25/07/2024/new-estimates-cost-ending-poverty | https://borgenproject.org/how-much-does-it-cost-to-end-poverty/
.
182.
US Inflation Calculator. Historical healthcare inflation rate (6.2%).
US Inflation Calculator: Health Care 1948-2025 https://www.usinflationcalculator.com/inflation/health-care-inflation-in-the-united-states/ (1948)
Long-term average (1935-2025): 4.59% annual (per Consumer Price Index for Medical Care, BLS) 2000-2023: 3.5% average annual medical care cost inflation Medical Care Price Index (MCPI): 3.7% compound annual growth (past 2 decades) vs 2.6% for Personal Health Care (PHC) & PCE health indexes Recent (Aug 2025): 3.4% year-over-year health care price increase Additional sources: https://www.usinflationcalculator.com/inflation/health-care-inflation-in-the-united-states/ | https://www.in2013dollars.com/Medical-care/price-inflation | https://pmc.ncbi.nlm.nih.gov/articles/PMC5785315/ | https://ycharts.com/indicators/us_health_care_inflation_rate
.
183.
UNHCR. UNHCR forcibly displaced people 2023.
UNHCR https://www.unhcr.org/global-trends-report-2023 (2023)
At the end of 2023, 117.3 million people worldwide were forcibly displaced. Additional sources: https://www.unhcr.org/global-trends-report-2023
.
184.
ASPE. Refugee lost annual earning potential ($23,400).
ASPE: Fiscal Impact of Refugees https://aspe.hhs.gov/reports/fiscal-impact-refugees-asylees Refugee economic impact: Net positive $123.8B fiscal impact (2005-2019, 15 years) Refugees pay $21K more in taxes than benefits received over first 20 years in U.S. Earnings gap: Refugees work at higher rates than natives but earn less; never reach U.S.-born earning levels Income progression: <5 years in U.S. = $30,500 median; 20+ years = $71,400 (exceeds national $67,100 median) Note: Specific "$23,400 lost earning potential" figure not verified in sources Additional sources: https://aspe.hhs.gov/reports/fiscal-impact-refugees-asylees | https://www.americanimmigrationcouncil.org/sites/default/files/research/05.23_refugee_report_v3_0.pdf | https://www.nber.org/system/files/working_papers/w23498/w23498.pdf
.
186.
Share the World’s Resources. War spending vs WHO budget.
Share the World’s Resources https://sharing.org/information-centre/news/world-health-organisations-annual-budget-equivalent-global-military/ The WHO’s annual budget of US$2.1 billion is equivalent to global military expenditure every eight hours. WHO Director-General noted that US$2.1 billion is the price of one stealth bomber. A 1% increase in military spending results in a 0.62% decrease in health spending globally. Additional sources: https://sharing.org/information-centre/news/world-health-organisations-annual-budget-equivalent-global-military/ | https://pmc.ncbi.nlm.nih.gov/articles/PMC9174441/
.
187.
Daggett, S.
Costs of major u.s. wars. (2010)
Congressional Research Service estimates of the costs of major U.S. wars from the American Revolution through post-9/11 operations, in both current-year and constant FY2011 dollars.
190.
Watson Institute, Brown University.
Environmental costs of war. (2023)
Between 2001 and 2018, US military operations produced 1.3 billion tonnes of CO2 equivalent. Operations in Afghanistan, Iraq, Pakistan and Syria generated about 440 million tonnes. Comprehensive accounting of post-9/11 environmental destruction.
191.
White, M.
Estimated totals for the entire 20th century. (2011)
Matthew White’s compilation of 20th century death tolls: approximately 123 million from wars (37M military, 27M civilian, 41M democide, 18M famine). Range across sources: 123-203 million depending on methodology and inclusion criteria.
192.
National Science Board.
Science and engineering labor force. (2018)
Scientists and engineers make up about 5 percent of the U.S. labor force. Provides workforce demographics and trends for STEM professions.
194.
Sever, F. L.
Wars and children.
Turkish Archives of Pediatrics 57, 253 (2022)
Nearly 90 percent of deaths from wars in the first decade of the 21st century included civilians, a significant number of whom were children.
195.
U.S. Department of Health and Human Services.
HHS standard values for regulatory analysis, 2024. (2024)
HHS adopts central value of 591,000 USD for Quality-Adjusted Life Year (VQALY) and 495,000 USD for Value per Statistical Life Year (VSLY) for 2024 regulatory analysis. Low/central/high VQALY: 276K/591K/899K.
196.
Barrios, D. & Sanz-Gracia, F. A farewell to arms: The peace dividend of costa rica’s army abolition.
Journal of Development Studies https://www.tandfonline.com/doi/full/10.1080/00220388.2024.2445533 (2024)
Synthetic control analysis of Costa Rica after 1949 army abolition. Per capita GDP growth increased from 1.46 percent to 2.28 percent (1950-2010), an increase of 0.51-0.82 percentage points annually. The peace dividend was sustained over six decades.
197.
d’Agostino, G., Dunne, J. P. & Pieroni, L. Does military spending stifle economic growth? The empirical evidence from non-OECD countries.
Economic Modelling https://pmc.ncbi.nlm.nih.gov/articles/PMC7779781/ (2019)
Panel data covering 133 countries (1960-2012). A 1 percentage point increase in military expenditure as share of GDP reduces economic growth by approximately 1.10 percentage points. Military spending crowds out private investment and diverts resources from productive public expenditure.
199.
Sinn, M. P.
The 1% Treaty: Harnessing Greed to Eradicate Disease.
https://manual.warondisease.org/knowledge/economics/1-pct-treaty-impact.html (2025) doi:
10.5281/zenodo.18161560 6.65 thousand diseases have zero FDA-approved treatments; at current trial capacity, exploring them takes 443 years. Redirecting 1% of military spending scales capacity 12.3x, cutting the timeline to 36 years and preventing 10.7 billion deaths. At $0.00177/DALY, 50.3kx more cost-effective than the best existing interventions. Incentive Alignment Bonds make adoption politically viable.
200.
Rummel, R. J.
Statistics of Democide: Genocide and Mass Murder Since 1900. (Lit Verlag, 1997).
Detailed statistical tables and source documentation for every major case of democide in the 20th century. Companion volume to Death by Government with regime-by-regime breakdowns, confidence ranges, and methodology notes.
201.
United States Holocaust Memorial Museum.
Darfur. (2024)
Between 2003 and 2008, armed conflict and targeted killings in Darfur caused about 300,000 civilian deaths and displaced about 2.7 million civilians. The 300,000 figure originates from UN Under-Secretary-General for Humanitarian Affairs John Holmes, who in April 2008 described it as a reasonable extrapolation from a 2006 estimate of 200,000 deaths.
202.
United Nations Human Rights Office of the High Commissioner.
Civilian Deaths in the Syrian Arab Republic: Report of the United Nations High Commissioner for Human Rights.
https://www.ohchr.org/en/press-releases/2022/06/un-human-rights-office-estimates-more-306000-civilians-were-killed-over-10 (2022)
The UN Human Rights Office estimated that 306,887 civilians were killed in the Syrian conflict between March 2011 and March 2021, an average of 83 per day, representing 1.5 percent of the pre-war population. The Syrian Network for Human Rights separately estimated the government and its allies were responsible for approximately 91 percent of civilian casualties.
203.
Anadolu Agency.
New report: Myanmar army killed over 24,000 Rohingya. (2018)
The Ontario International Development Agency report “Forced Migration of Rohingya: The Untold Experience” estimated 23,962 (plus or minus 881) Rohingya were killed by Myanmar state forces since August 2017. The report also documented over 17,718 women and girls raped and over 114,000 beaten.