Global Clinical Trial Spending by Phase
Abstract
A Practical Guide: Get 500 Years of Clinical Research in 20, Avoid the Apocalypse, and Make Humanity Filthy Rich by Giving Papers
Keywords
war-on-disease, 1-percent-treaty, medical-research, public-health, peace-dividend, decentralized-trials, dfda, dih, victory-bonds, health-economics, cost-benefit-analysis, clinical-trials, drug-development, regulatory-reform, military-spending, peace-economics, decentralized-governance, wishocracy, blockchain-governance, impact-investing
Here’s where every dollar goes in the global clinical trials industry, broken down by who’s paying and which phase they’re funding.
The Bottom Line: $83 Billion Annually (2024)
The global clinical trials market was valued at approximately $83 billion in 2024, with estimates ranging from $54 billion to $84 billion depending on methodology.
Growth trajectory
- 2024: $83 billion
- 2030: Projected $83-132 billion
- 2034: Projected $95-150 billion
How Many People Participate? The Missing Data
Critical data gap: No global database tracks annual clinical trial participant enrollment.
What we know
- US cumulative enrollment (direct API analysis): 12.2 million participants across 100,000 active/recruiting/completed trials
- Estimated annual US enrollment: 4-5 million participants/year (based on average trial durations)
- Estimated global annual enrollment: 6-10 million participants/year (scaling from US 54% market share)
Regional snapshots
- England: 1.05 million participants in 2023/24
- US active trials (2009): Seeking 2.8 million participants
Median participants per trial (from ClinicalTrials.gov data):
- Phase 1: 33 participants
- Phase 2: 60 participants
- Phase 3: 237 participants
- Phase 4: 90 participants
Cost per participant (if $83B ÷ 5M participants): ~$16,600 annually
The tragedy: Only 0.06% of humanity participates in clinical trials each year while 150,000 die daily from disease.
See The 0.06% Problem for the full analysis.
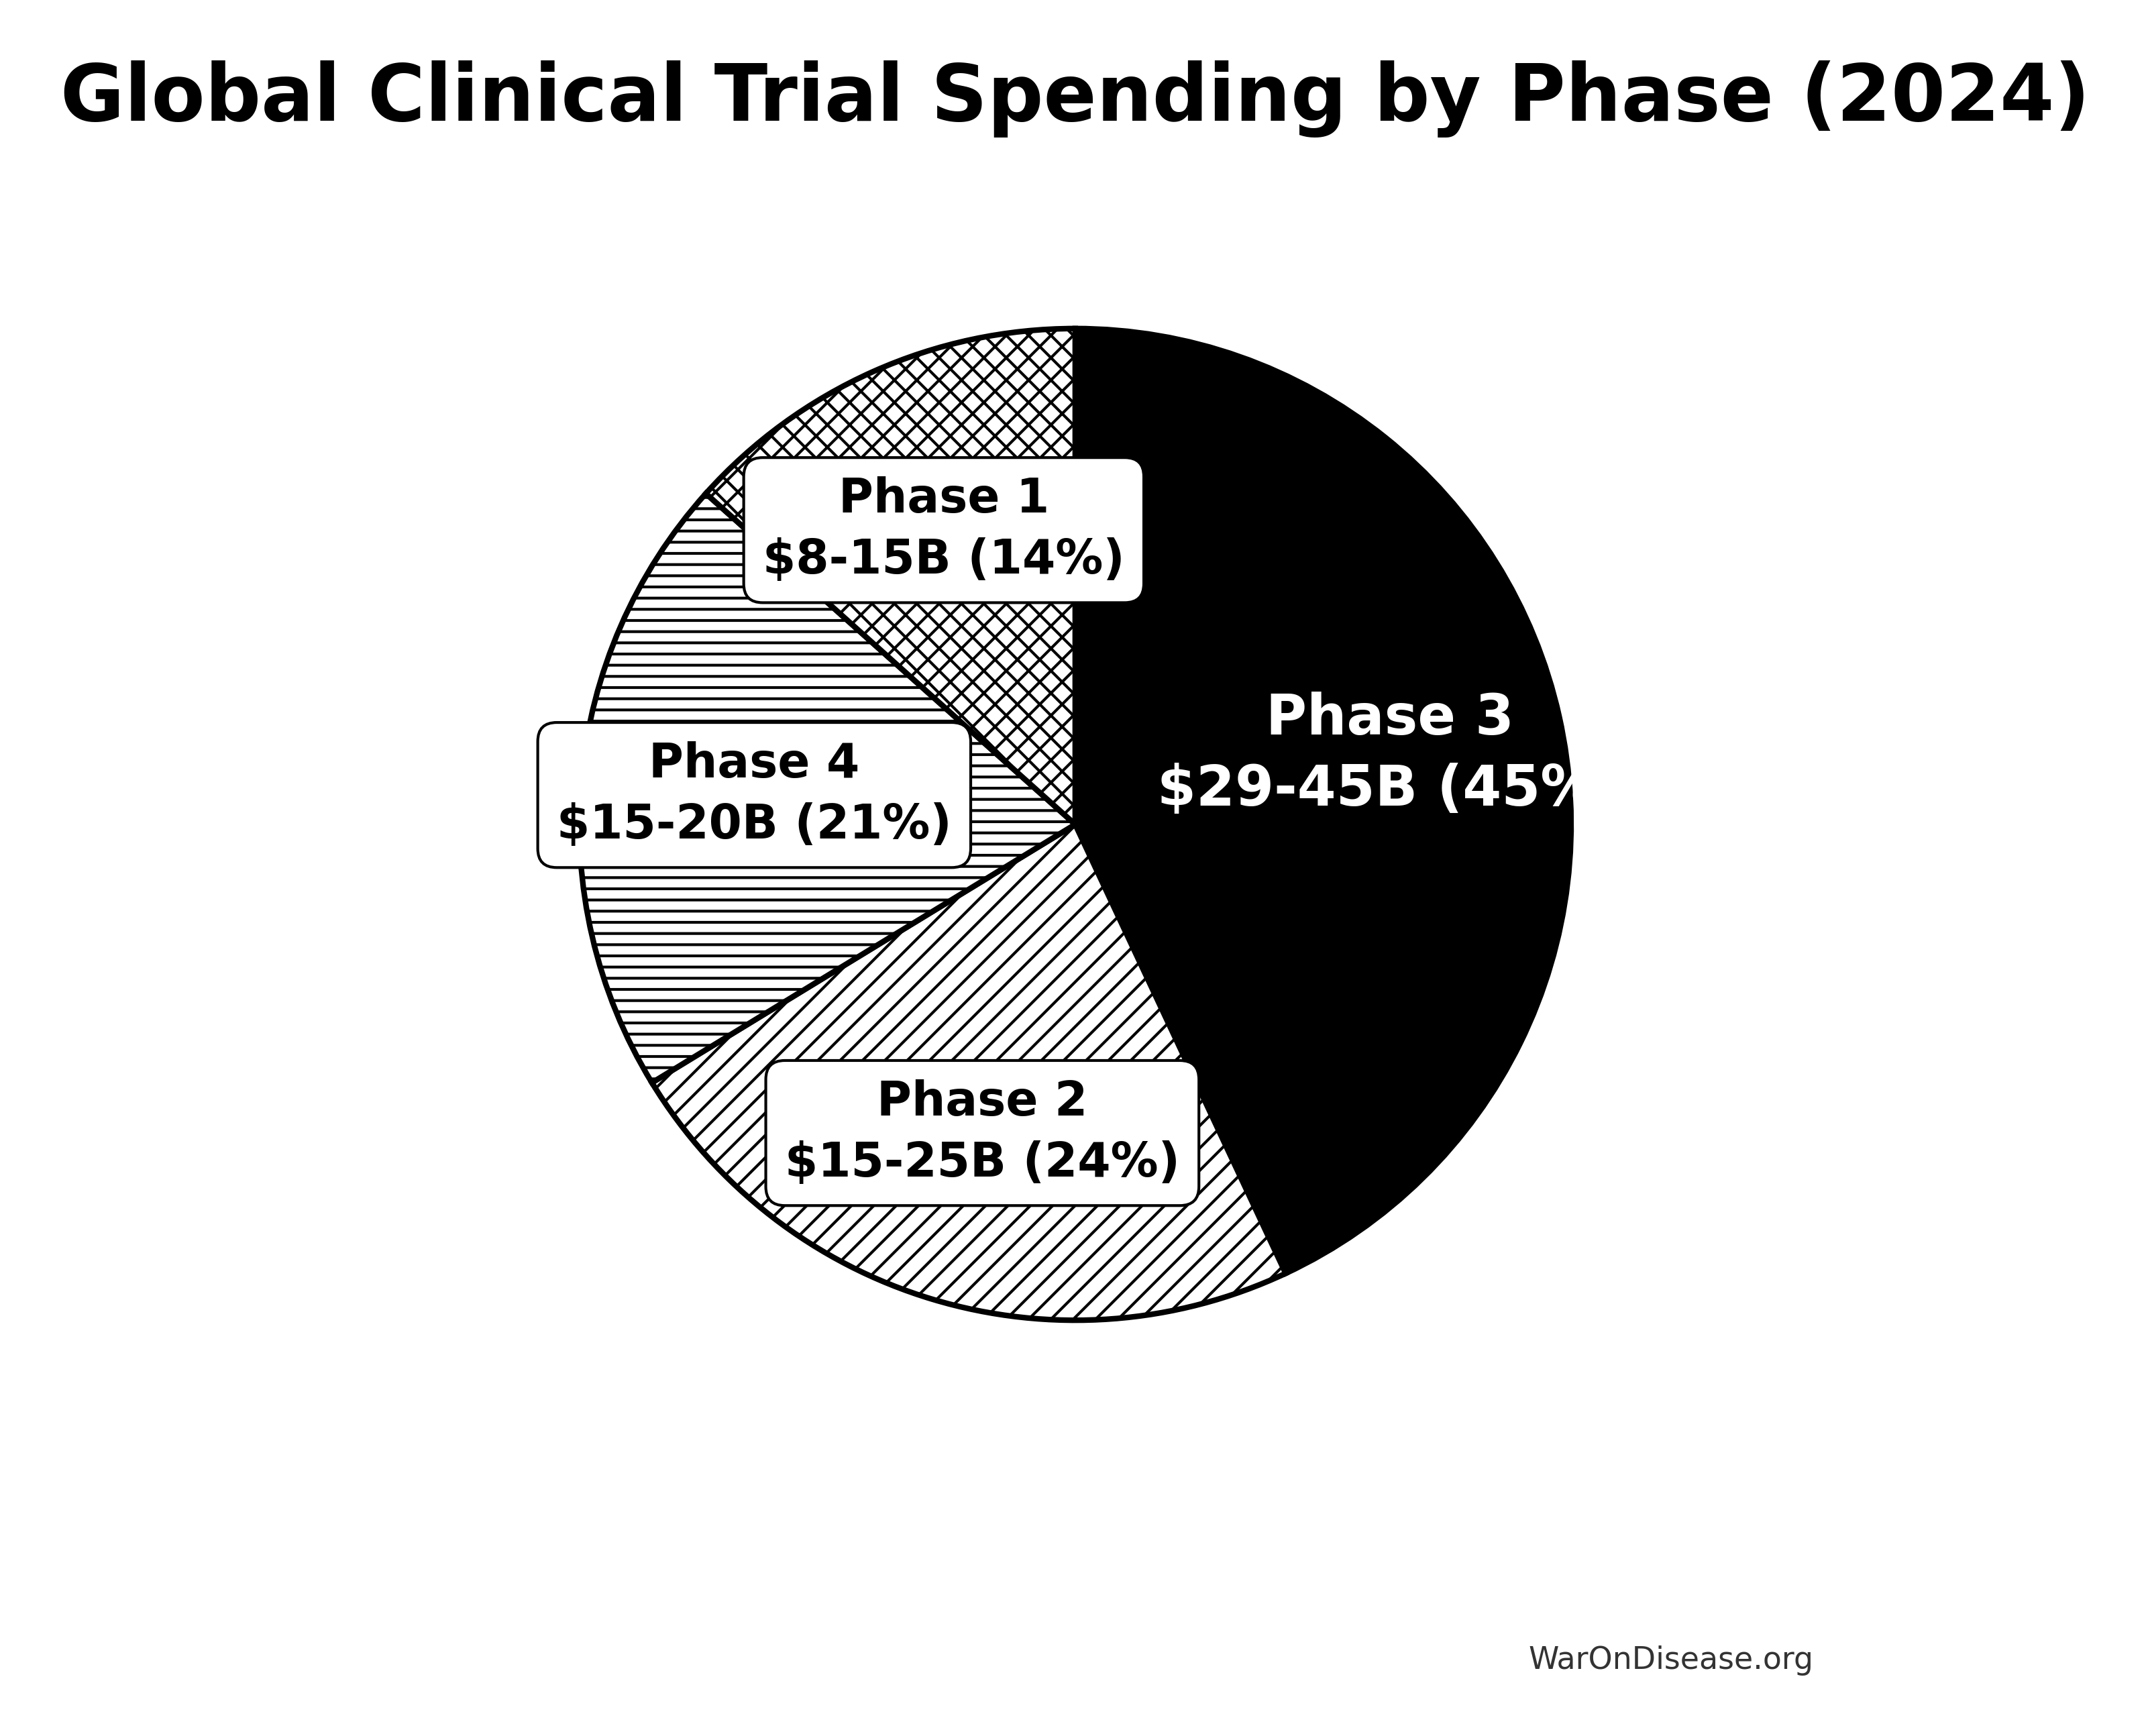
Spending by Clinical Trial Phase
Phase 3: The Money Pit
Global Spending: $29-45 billion annually (~53-55% of total market)
Why Phase 3 dominates:
- Largest market share at 53.3% of all clinical trial spending (2024)
- Requires 300-3,000 participants
- Longest treatment periods (38 months average)
- Most expensive phase per trial
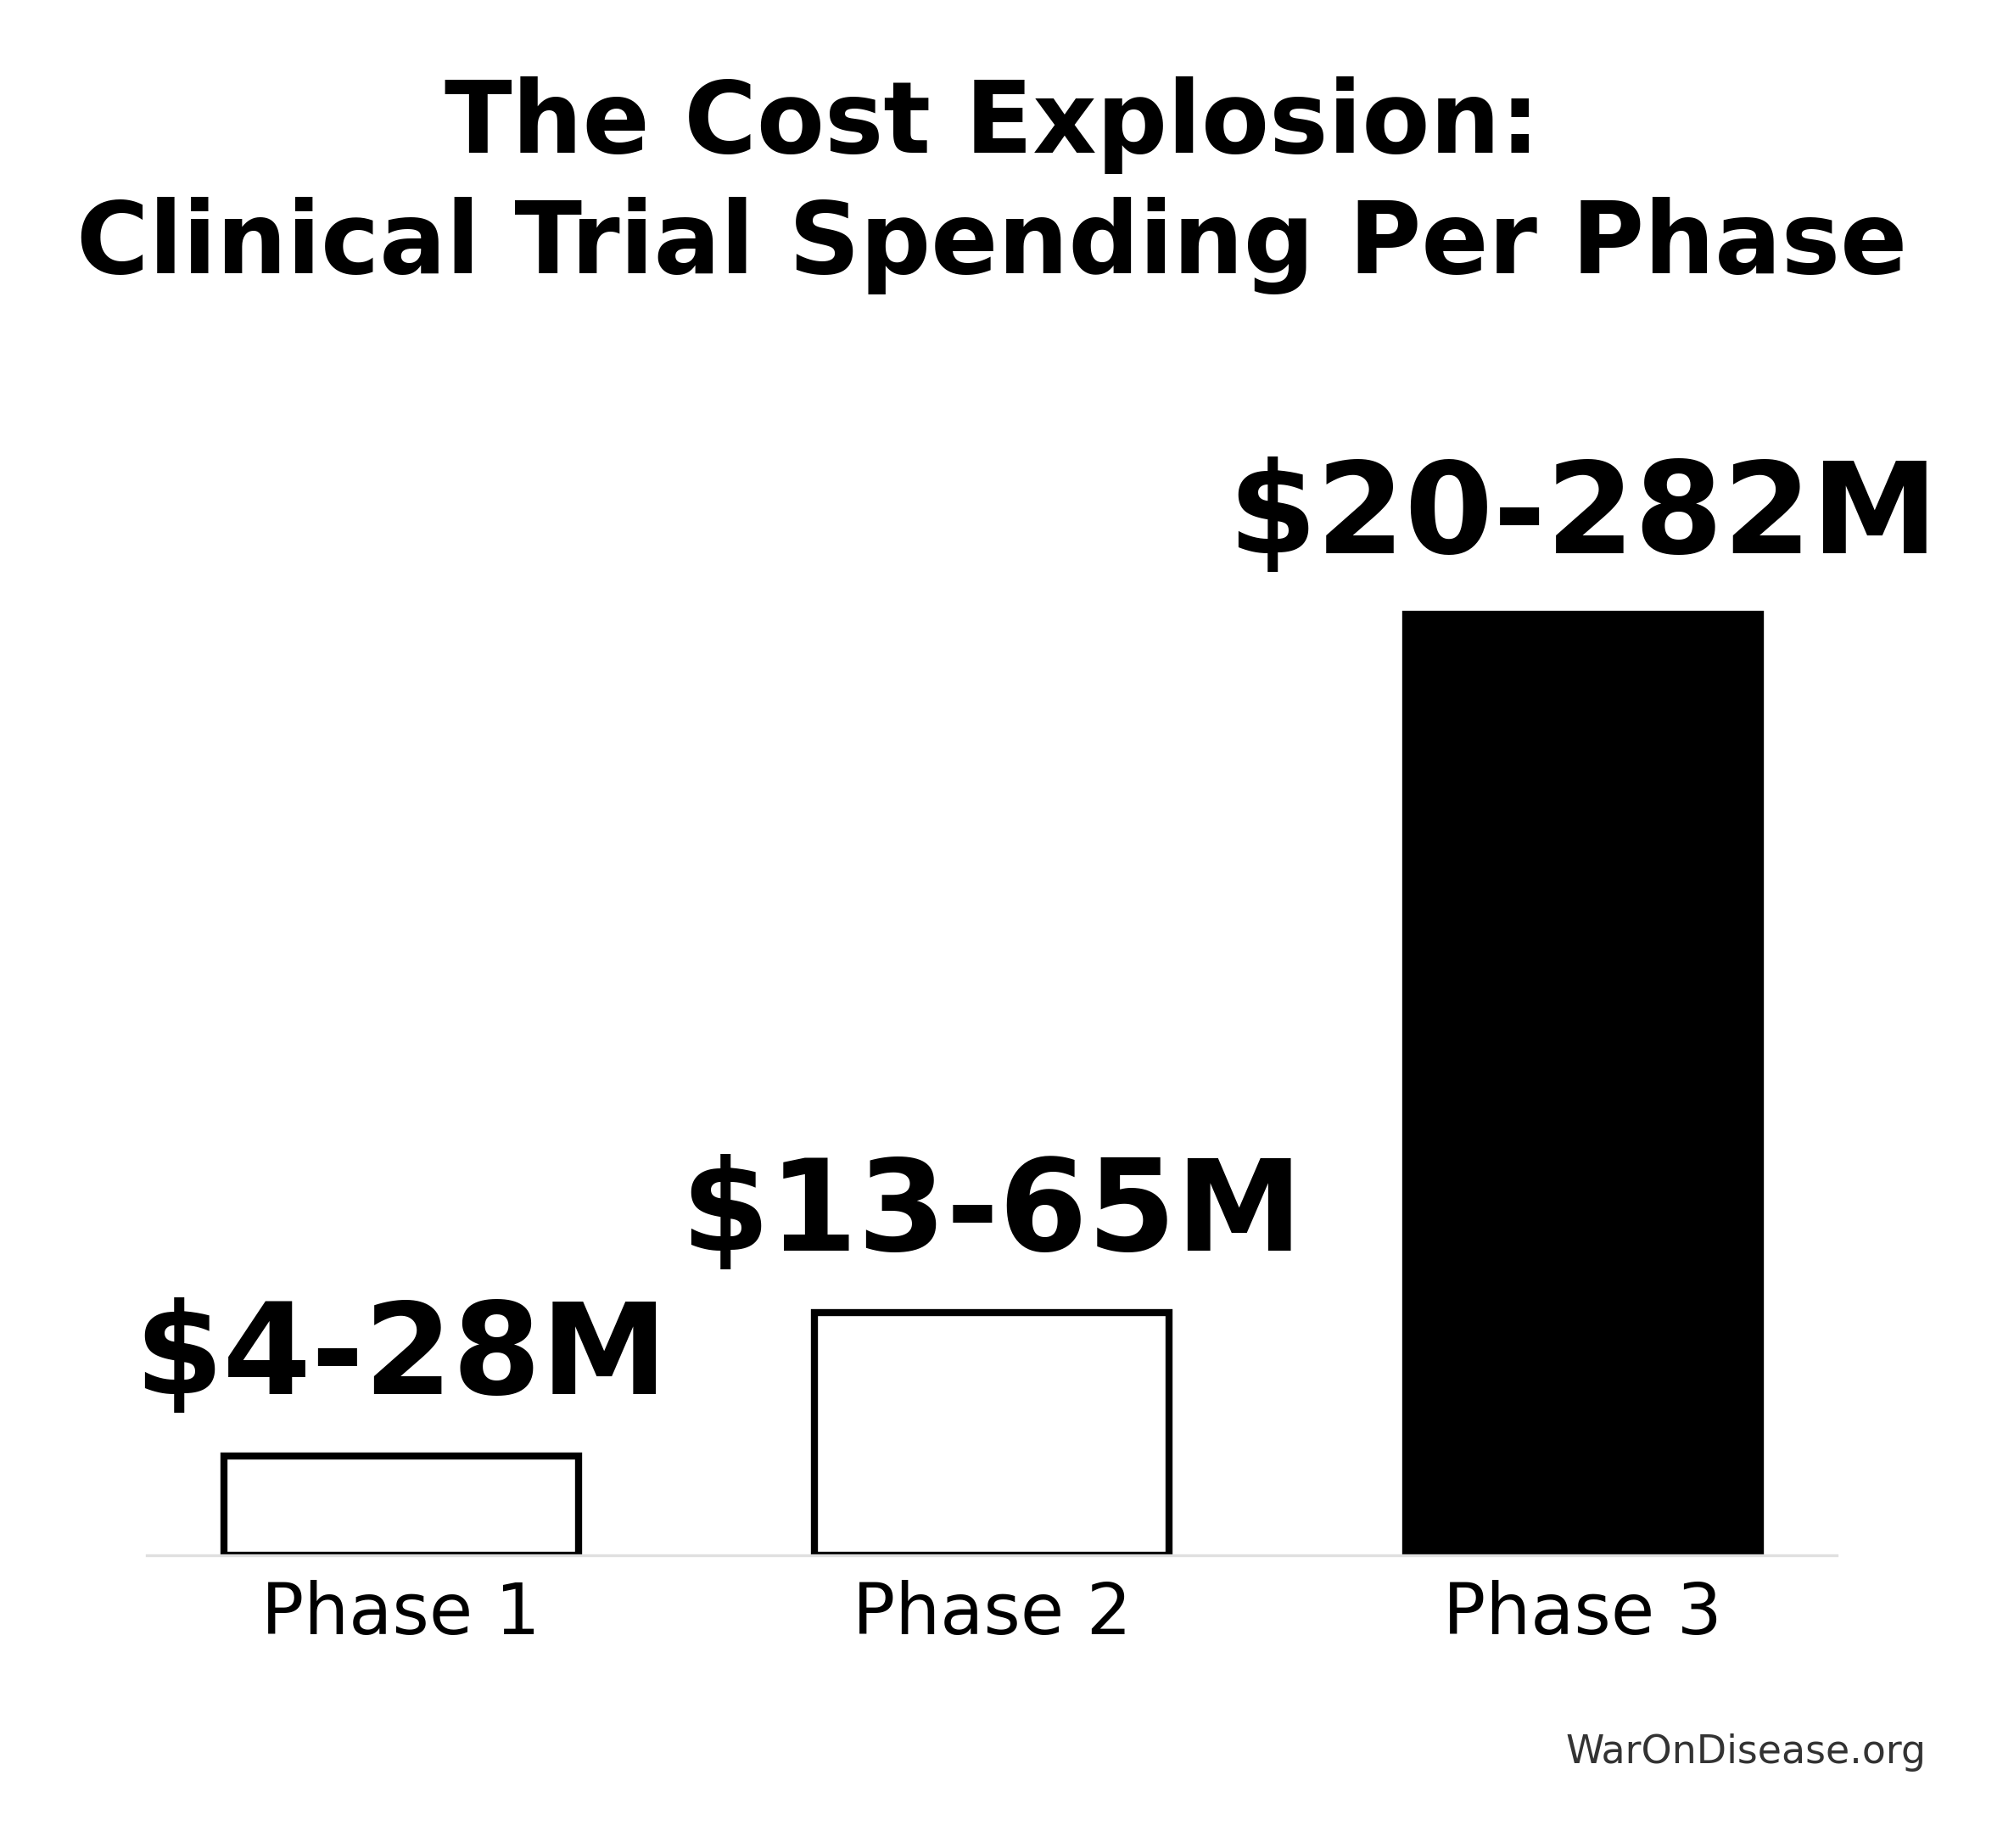
Cost per trial
- Average: $20-282 million per trial
- Median: Over $19 million per trial
- Range by therapeutic area: $11.5M (dermatology) to $52.9M (pain/anesthesia)
Cost per patient
- Traditional Phase 3: $40,000-$120,000 per patient
- Average: $113,000 per patient
As percentage of total drug development
- 39.8% of total R&D expenditure goes to Phase 3 trials
Phase 2: The Middle Child
Global Spending: $15-25 billion annually (estimated ~20-30% of market)
Cost per trial
- Average: $13-65 million per trial
- Range by therapeutic area: $7.0M (cardiovascular) to $19.6M (hematology)
Cost per patient
- Average: $130,000 per patient
As percentage of total drug development
- 17.4% of total R&D expenditure goes to Phase 2 trials
Trial characteristics
- Average participants: ~100-300 patients
- Average duration: 2-3 years
Phase 1: The Safety Gauntlet
Global Spending: $8-15 billion annually (estimated ~10-18% of market)
Cost per trial
- Average: $4-28 million per trial
- Typical: $25 million per trial
Cost per patient
- Average: $137,000 per patient (highest per-patient cost!)
As percentage of total drug development
- 9.2% of total R&D expenditure goes to Phase 1 trials (combined with proof of mechanism)
Trial characteristics
- Average participants: ~51 patients
- Average duration: 27.8 months
- 17% of all NIH-funded trials are Phase 1
Phase 4: The Forgotten Phase
Global Spending: $12+ billion annually (2007 estimate; likely ~$15-20 billion in 2024)
Key facts
- 11% of pharmaceutical R&D budgets allocated to Phase 4
- Growing at 23% annually (as of 2007)
- Also called “post-marketing surveillance” or “pharmacovigilance studies”
- Often mandated by FDA after approval
- 5% of NIH-funded trials are Phase 4
Why it matters
- Monitors long-term safety in real-world populations
- Detects rare adverse events not seen in smaller trials
- Evaluates effectiveness beyond controlled trial conditions
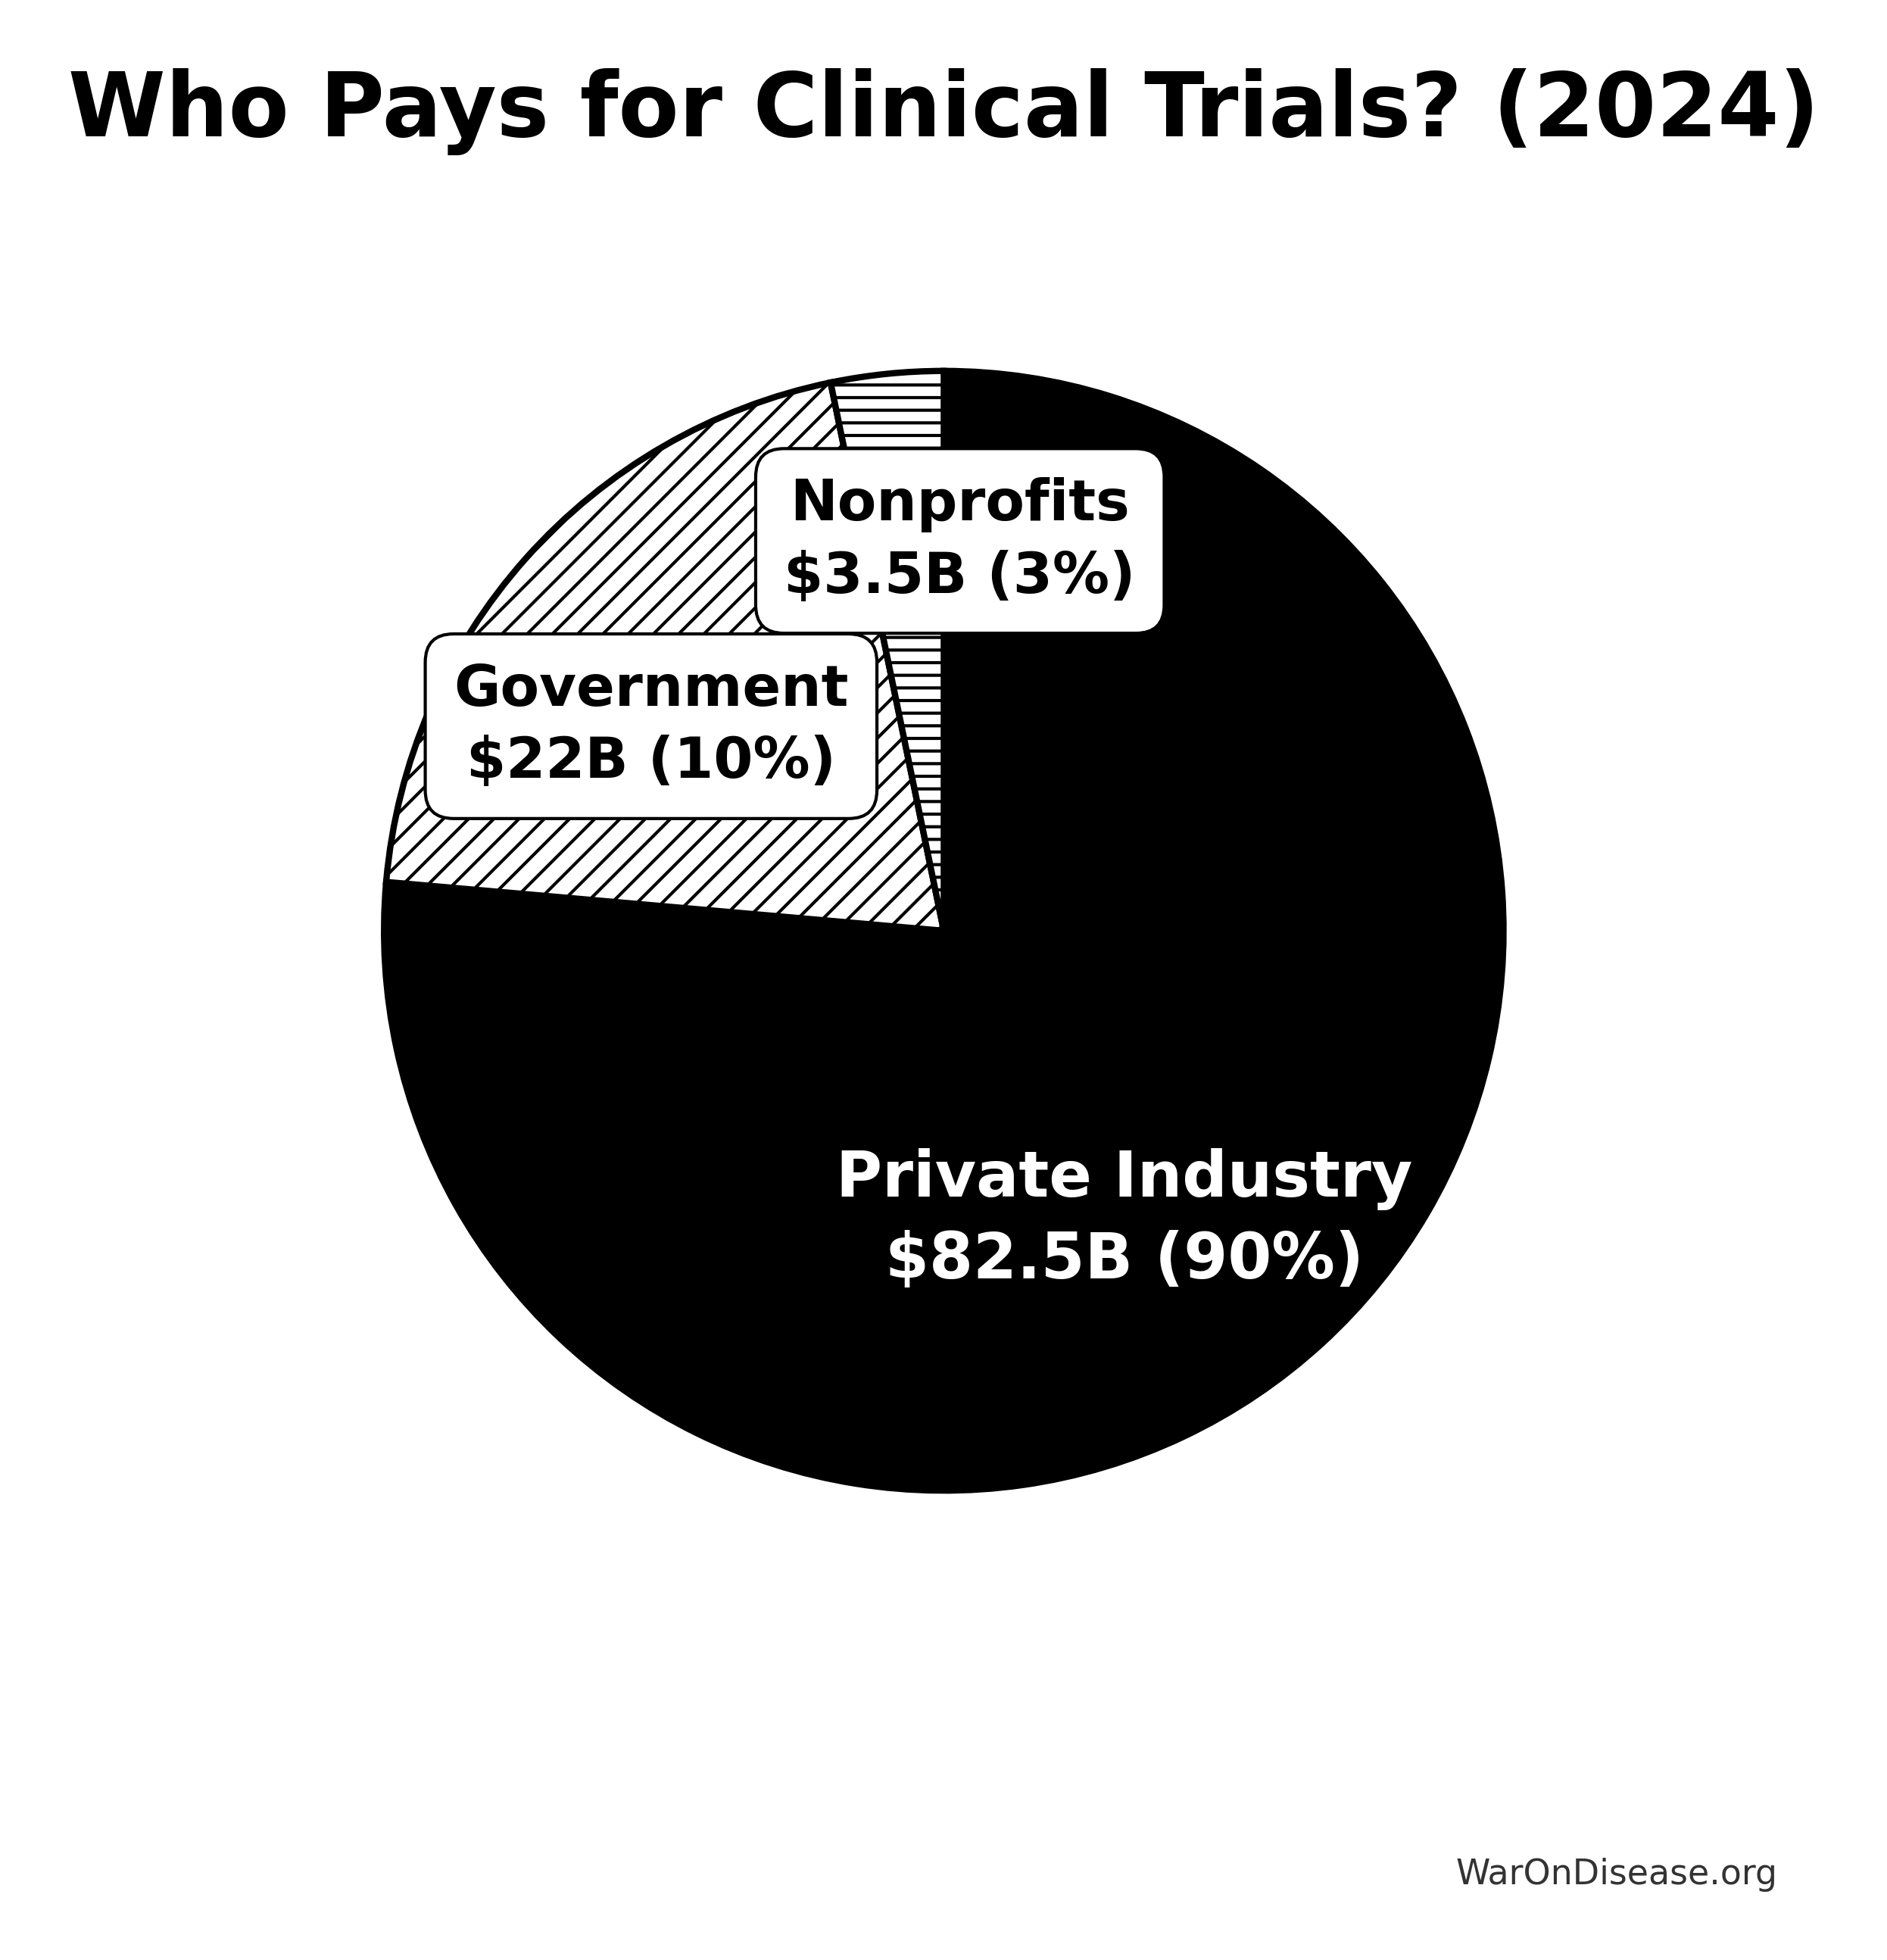
Who’s Paying: Funding Source Breakdown
Private Industry: The Heavy Hitter
Total Annual Spending: $75-90 billion (~90% of global total)
Global pharmaceutical R&D
- Total industry R&D: $300+ billion annually
- Clinical trials portion: ~25-30% of total R&D
- Industry R&D grew 44% (inflation-adjusted) from 2012-2022: $170B → $247B
Top spenders (2024 R&D budgets)
- Pharmaceutical companies dominate funding
- Biotech firms increasingly important (especially in early phases)
- Venture capital: $146 billion invested over 3 years
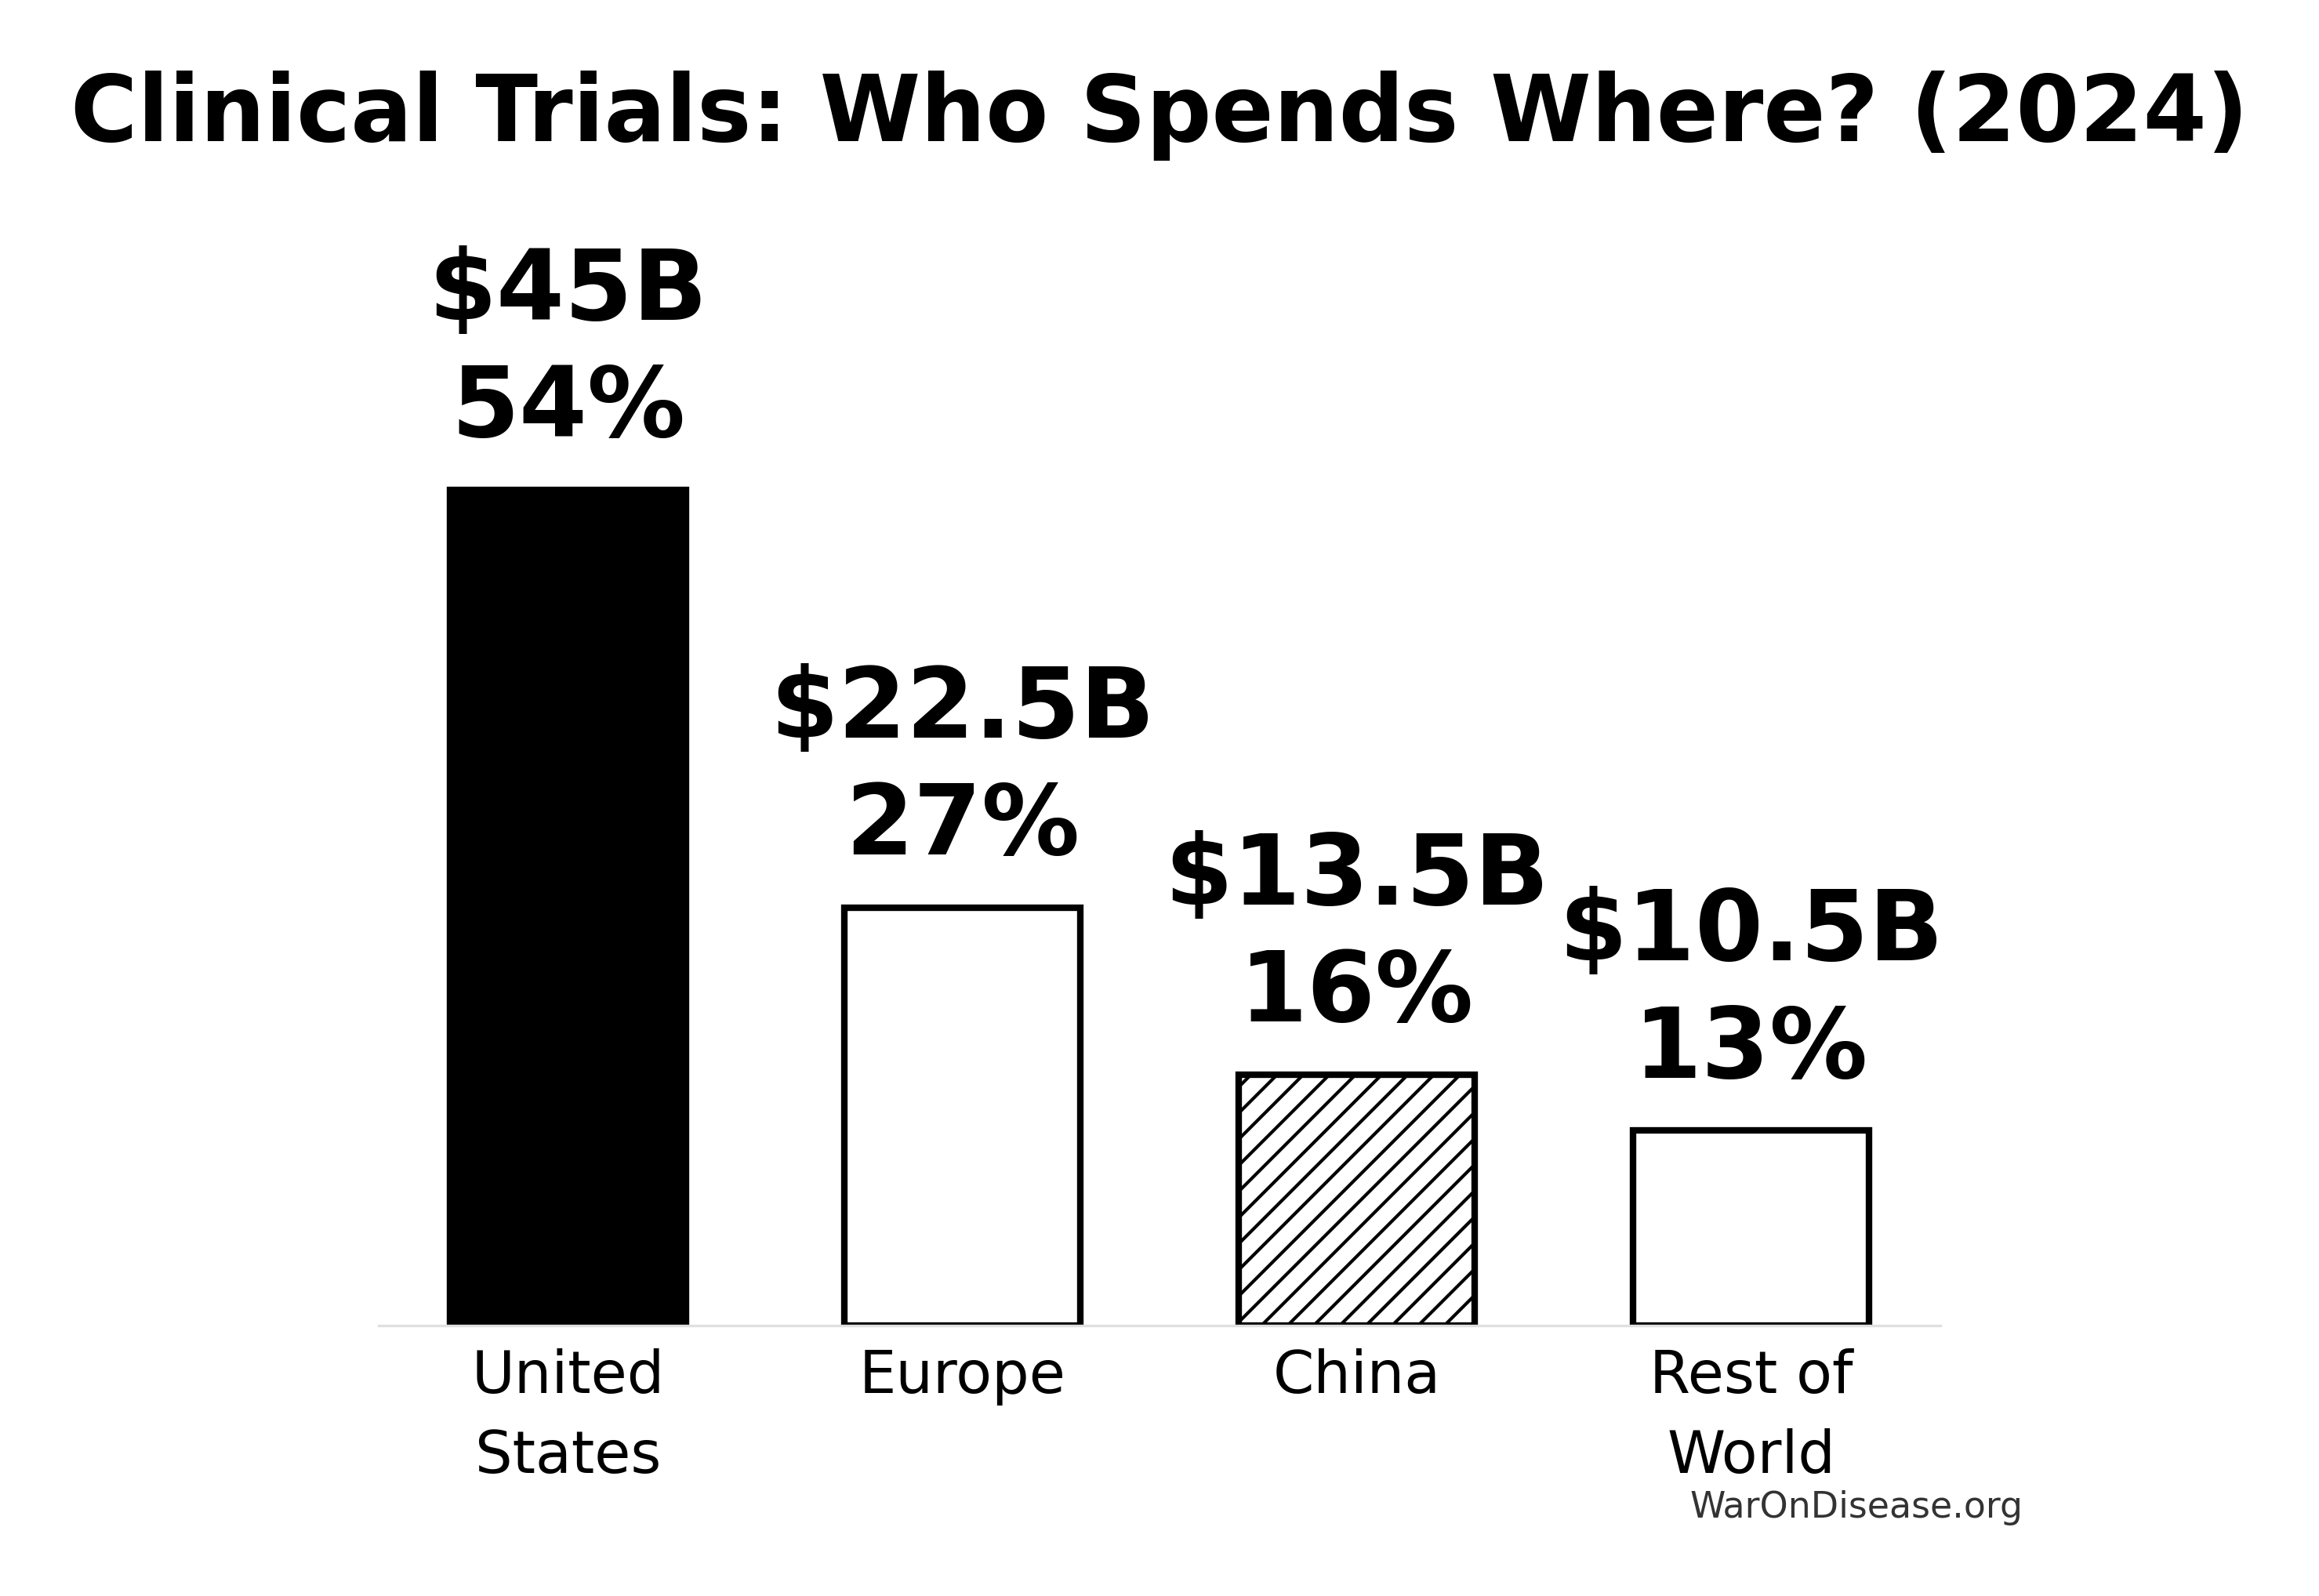
Regional breakdown
- United States: Largest market for clinical trials
- US clinical trials market: $45 billion in 2024
- ~54% of global market
- China: Rising rapidly
- Europe: Steady player
- Innovative Health Initiative (IHI) under Horizon Europe funds public-private partnerships
Government: The Seed Investor
Total Annual Spending: $19-25 billion on clinical trials (~10-12% of global total)
United States (NIH)
- Total NIH budget: $47.1 billion (FY2024)
- ~80% goes to research, including clinical trials
- NIH clinical research funding: $18.9 billion (FY2023)
- NIH spent $8.1 billion on phased clinical trials (2010-2019) for drugs ultimately approved
- Only ~10% of industry spending over same period
NIH spending by phase (per approved drug, 2010-2019 data):
- Phase 1: $13.9 million average
- Represents 24.6-25.3% of industry Phase 1 costs
- Phase 2: $22.2 million average
- Represents 21.4-23.2% of industry Phase 2 costs
- Phase 3: $12.9 million average
- Represents only 3.7-4.3% of industry Phase 3 costs
- Total NIH per drug: $33.8 million (when ultimately approved)
NIH trial distribution
- 17% Phase 1
- 35% Phase 2 (largest share)
- 11% Phase 3
- 5% Phase 4
- 33% “Other” or unspecified phase
Key insight: NIH focuses on early-stage risk
- NIH covers ~25% of Phase 1 costs
- NIH covers ~22% of Phase 2 costs
- NIH covers only ~4% of Phase 3 costs
- Industry takes over once commercial potential is clearer
European Union
- Horizon Europe total: €95.5 billion (2021-2027)
- Health research portion: Billions allocated
- Horizon Europe Health Budget: €8.2 billion (2021-2027)
- ~€1.17 billion per year (~$1.3 billion)
- EU4Health Programme: €5.3 billion (2021-2027)
China
- Government R&D investment: Part of $15 billion total biopharma R&D
- Rapid growth: $35 million (2015) → $15 billion (2023)
Other major government funders
- UK: ~$3 billion annually on medical research
- Germany: ~$6 billion annually
- Japan: ~$5 billion annually
- Canada: ~$1.5 billion annually
Nonprofit Foundations: The Niche Players
Total Annual Spending: $2-5 billion globally (~2-5% of global total)
Major players (2024)
Gates Foundation + Wellcome Trust + Novo Nordisk:
- New 3-year initiative: $300 million total ($100M each)
- Focus: Climate-health, infectious disease, AMR, nutrition-immunity
- TB vaccine funding: $550 million
- Up to $150M from Wellcome, ~$400M from Gates
Gates Foundation
- Active in global health clinical trials
- Focus: Infectious diseases, vaccines, maternal/child health
- Hundreds of millions to low billions annually
Wellcome Trust
- Major global health research funder
- Clinical trial funding in infectious diseases, mental health
Other major nonprofit funders
- Cancer research charities (American Cancer Society, Cancer Research UK, etc.)
- Disease-specific foundations (Alzheimer’s Association, Michael J. Fox Foundation, etc.)
- Patient advocacy groups funding rare disease trials
Special initiatives
- COVID-19 Therapeutics Accelerator: Gates + Wellcome + Mastercard
The Brutal Economics: Cost Per Approved Drug
/tmp/ipykernel_4829/3000867792.py:44: UserWarning:

set_ticklabels() should only be used with a fixed number of ticks, i.e. after set_ticks() or using a FixedLocator.
Industry average spending on clinical trials per approved drug:
- Total clinical trial costs: $1,065 million per approved drug
- Includes spending on failed drugs (most drugs fail)
Breakdown by phase (industry average)
- Phase 1: $28 million per approved drug
- Phase 2: $65 million per approved drug
- Phase 3: $282 million per approved drug
- Subtotal for completed drugs: $375 million
- Additional $690 million: Spent on contemporaneous drugs that failed
Success rates (the depressing math)
- Only ~12% of drugs entering Phase 1 gain FDA approval
- 100 drugs start Phase 1
- ~60 advance to Phase 2
- ~20 enter Phase 3
- ~12 gain approval
Total drug development cost (preclinical + clinical):
- Estimates range from $1.0 billion to $2.6 billion per approved drug
- Tufts Center 2021 estimate: $2.6 billion
- Nearly 3× increase from $802M in 2003 (inflation-adjusted)
Regional Market Distribution
/tmp/ipykernel_4829/511585387.py:44: UserWarning:

set_ticklabels() should only be used with a fixed number of ticks, i.e. after set_ticks() or using a FixedLocator.
North America: The Dominant Player
Market share: ~50-54% of global clinical trials market
United States
- Clinical trials market size: $45 billion (2024)
- NIH: $18.9 billion in clinical research (2023)
- Industry: Remainder (~$25-30 billion)
Asia-Pacific: The Rising Giant
China
Why China is winning
- Faster and more affordable clinical trials
- Larger patient populations
- Government support for biopharma innovation
- Improved regulatory framework
Other Asia-Pacific
- India, Japan, South Korea, Australia all significant players
- Combined: Substantial portion of global market
Europe: The Steady Player
What This Actually Means
The Good News
- Industry spending grew 44% (2012-2022)
- More trials running globally than ever
- Technology enabling cheaper trials (see: RECOVERY trial at $500/patient)
The Bad News
- $83 billion annually, yet most diseases still have no treatment
- 95% of spending goes to Phase 2-3 trials for molecules that can be patented
- Success rate: 12%
- Average time to develop one drug: 10+ years
- Cost per approved drug: Rising 8.5% annually
The Context
- Global clinical trial spending: $83 billion
- Global military spending: $2.7 trillion
- Global pharmaceutical marketing: $180 billion
- Humans spend 33× more on weapons and 2× more on drug ads than on testing new treatments
The Efficiency Paradox
Current system
- $83 billion spent annually
- ~50 new drugs approved per year globally
- Cost per approved drug: $1.66 billion (using clinical trial spending alone)
- Most are “me-too” drugs (minor variations of existing treatments)
What the same money could buy (with a decentralized framework for drug assessment):
- At $500/patient (RECOVERY model): 166 million patient-participants
- At $2 million per efficient trial: 41,500 trials annually
- Instead of 50 drugs: Hundreds or thousands of treatments tested
- Instead of 10 years: Months to years
The waste
- Traditional Phase 3: $40,000-$120,000 per patient
- RECOVERY achieved: $500 per patient
- That’s an 80-240× markup for bureaucracy
Summary Table
| Category | Annual Spending | % of Total |
|---|---|---|
| Total Global Clinical Trials Market | $83 billion | 100% |
| By Phase: | ||
| Phase 3 | $29-45 billion | 53-55% |
| Phase 2 | $15-25 billion | 20-30% |
| Phase 1 | $8-15 billion | 10-18% |
| Phase 4 | $15-20 billion | ~10-15% |
| By Funding Source: | ||
| Private Industry | $75-90 billion | ~90% |
| Government | $19-25 billion | ~10% |
| Nonprofits | $2-5 billion | ~2-5% |
| Major Regional Markets: | ||
| United States | $45 billion | ~54% |
| Europe | $20-25 billion | ~25-30% |
| China | $12-15 billion | ~15-18% |
| Rest of World | $8-13 billion | ~10-15% |
The Path Forward
Humans spend $83 billion annually to develop ~50 drugs over 10+ years each.
A decentralized framework for drug assessment (dFDA) model could achieve 50-95% cost reduction, enabling:
- 10-20× more treatments tested
- 5-10× faster development
- Access for billions instead of thousands
The money exists. The patients exist. The technology exists.
What we lack is the political will to stop lighting $50 billion per year on fire for the privilege of bureaucracy.
Every phase, every dollar, every delay is a choice. And we’re choosing wrong.